Judgment and Decision Making, Vol. 13, No. 1, January 2018, pp. 23-32
Thinking dynamics and individual differences: Mouse-tracking analysis of the denominator neglect task
Barnabas Szaszi*
Bence Palfi#
Aba Szollosi$
Pascal J. KieslichX
Balazs AczelY
|
Most decision-making models describing individual differences in
heuristics and biases tasks build on the assumption that reasoners
produce a first incorrect answer in a quick, automatic way which they
may or may not override later and that the advantage of high capacity
reasoners arises from this late correction mechanism. To investigate
this assumption, we developed a mouse-tracking analysis technique
to capture individuals’ first answers and subsequent thinking dynamics.
Across two denominator neglect task experiments, we observed that
individuals initially move the mouse cursor towards the correct answer
option in a substantial number of cases suggesting that reasoners may
not always produce an incorrect answer first. Furthermore, we observed
that, compared to low capacity reasoners, high capacity individuals
revise their first answer more frequently if it is incorrect and make
fewer changes if it is correct. However, we did not find evidence that
high capacity individuals produce correct initial answers more
frequently. Consistent with the predictions of previous decision-making
models, these results suggest that in the denominator neglect task the
capacity-normativity relationship arises after the initial response is
formulated. The present work demonstrates how the analysis of mouse
trajectories can be utilized to investigate individual differences in
decision-making and help us better apprehend the dynamics of thinking
behind decision biases.
Keywords: individual differences, process-tracing, reasoning,
heuristics and biases, denominator neglect, mouse-tracking
1 Introduction
In the simplest form of the denominator neglect task, participants are
asked to choose the larger of two ratios. The fact that individuals
often base their answer on the comparison of the numerators instead of
comparing the value of the ratios suggests that simple changes in the
way this information is presented may influence decisions (Bonner &
Newell, 2010). For example, the perceived risk of developing cancer
(Yamagishi, 1997) or the willingness to accept health-related risks
(Pinto, Martinez & Abellan, 2006) can increase if the risk
probabilities are expressed as a ratio of large numbers compared to an
equivalent ratio of small numbers. One central goal of reasoning and
decision-making research is to understand why such biases occur and
why some individuals are more susceptible to these biases than others
(Baron, 2008; Kahneman, 2011). Joining this endeavor, the current
research aims to investigate individual differences in susceptibility
to biases and the dynamics of cognitive processes underlying those
individual differences.
Individual differences in cognitive capacity1 have been shown to be a powerful
predictor of normatively correct responding in a variety of heuristics
and biases (HB) tasks. This capacity-normativity relationship has
been found in syllogistic reasoning problems (Stanovich & West, 1998;
Stanovich & West, 2008; Svedholm-Häkkinen, 2015), framing tasks
(Bruine de Bruin, Parker & Fischhoff, 2007; Frederick, 2005; Parker
& Fischhoff, 2005; Stanovich & West, 2008), base rate tasks
(Stanovich & West, 1998), belief bias (Stanovich & West, 2008) and
probability matching tasks (West & Stanovich, 2003). Similarly,
people with higher IQ and SAT scores give more correct answers in the
denominator neglect task (Kokis, Macpherson, Toplak, West &
Stanovich, 2002; Stanovich & West, 2001; Thompson & Johnson, 2014).
Kahneman and Frederick (2002) argued that more intelligent individuals
show better performance on HB tasks because they use their deliberative
processes more efficiently to override the output of the first,
incorrect heuristic response. They add that this can occur via two
possible paths. High ability reasoners may be more likely to learn the
necessary logical rules (commit fewer errors of comprehension) and/or
they may be better able to apply the learned rules in a more effective
way (commit fewer errors of application).
Stanovich and West (2008) further developed these ideas in their
framework and determined three loci from where individual differences
can arise. First, if the reasoner does not have the relevant
declarative knowledge and procedures (mindware) available to solve an
HB task, she will end up with the incorrect answer. Second, even if the
reasoner has the necessary mindware available, she has to recognize the
need of applying the appropriate strategy; otherwise, she will not
override the heuristic response. Finally, even if the reasoner has the
sufficient knowledge to solve the problem and detects the need to
override the first incorrect response, she will not come to the correct
answer if she does not have the sufficient cognitive capacity for the
required sustained inhibition and cognitive decoupling.
De Neys and Bonnefon (2013) applied a similar partitioning of the
possible causes of the individual differences in thinking biases, using
the ‘storage’, ‘monitoring’ and ‘inhibition’ labels to refer to the
different loci of individual differences (the ‘whys’). The authors
suggested an additional approach to organize the literature and
differentiated between early and late divergence between biased and
non-biased individuals (the ‘whens’). Interestingly, in their
framework, even in the case of early divergence, biased and non-biased
reasoners start to go on a different path only after the first
intuitive response has been formulated.
Evans (2007) developed two hypotheses aiming to provide explanations for
the capacity-normativity relationship. According to the
quantity hypothesis, individuals with higher cognitive ability
have a higher propensity to engage in analytic reasoning which makes
them more prone to override the first heuristic answer. In contrast,
the quality hypothesis states that better performance of
higher ability individuals arises because they are more likely to come
to the normative solution once they are engaged in analytic reasoning.
The common aspect of these approaches is that they all assume a
specific pattern that people’s decision-making process follows when
solving HB tasks: initially they will produce an incorrect answer,
which they may or may not override at a later point.2 Consequently, all
of these models assume that the capacity-normativity relationship
arises late3 in the
decision-making process. This late correction mechanism determines
whether one changes her mind from the initially produced incorrect
response.
However, recent studies using the two-response paradigm (Thompson,
Prowse Turner & Pennycook, 2011) challenged the assumption that
people always start their thinking with an incorrect response in the HB
tasks. In the two-response paradigm, people are asked to provide an
initial intuitive answer (along with other measures), after which they
are encouraged to take as much time as they need to rethink their
response to give the correct answer (for a detailed description, see
Thompson et al., 2011). Applying this paradigm to several HB tasks
(such as the denominator neglect task, the base rate task, a causal
reasoning task, and a categorical syllogism task), Thompson and Johnson
(2014) provided evidence that people start their thinking with a
correct initial response in a considerable number of cases (see, for
additional supporting results: Pennycook & Thompson, 2012; Thompson et
al., 2011). Bago and De Neys (2017) found similar results applying
time-pressure and cognitive load in the two-response paradigm which
further supports the idea that people often have a correct initial
response. Szaszi, Szollosi, Palfi and Aczel (2017) employed a thinking
aloud procedure to investigate the thinking processes in the Cognitive
Reflection Test (CRT), a popular measure showing how HB tasks can
trigger an incorrect initial answer. The authors found that in 77% of
the trials with correct responses, the respondents did not begin by
verbalizing any consideration of the intuitive response, suggesting
that they may have started their thinking already with a correct
response or with a line of thought leading to the correct response when
solving the tasks of the CRT.
Some recent data also question that the capacity-normativity
relationship in HB tasks arises from thought processes that occur after
the first response is formulated. Thompson and Johnson (2014) found
that in three of the four HB tasks investigated in their study, IQ
significantly correlated with the normativity of the first answer to a
similar extent as with the normativity of the final response,
suggesting that IQ is associated with correct first responses.
Svedholm-Hakkinen (2015) found that in contrast to the less cognitively
abled, the highly skilled reasoners did not show a sign of
belief-inhibition (longer reaction times) in the conflict version of
the belief bias syllogisms task compared to the non-conflict version of
the same task. Szaszi et al. (2017) investigated whether individuals
with higher cognitive capacity, as measured by the Berlin Numeracy Test
(Cokely, Galesic, Schulz, Ghazal & Garcia-Retamero, 2012), more often
start their thinking with a correct intuition or strategy in the CRT
tasks. Bayes factor analysis revealed that their data were too
insensitive to draw conclusions regarding this question.
There are two possible limitations of the previously described studies
investigating individuals’ first answers in HB tasks. First, as the
results are based on self-report measures, it cannot be ruled out that
in order to look more socially desirable, individuals do not report
their very first (and potentially incorrect) response, but only an
answer on which they elaborated more already. Second, a critic can
argue that the fact that participants have to provide the initial
answer in the two-response paradigm can affect the subsequent
reasoning process – even if it does not alter the final answer
compared to conditions without interruption (Thompson et al., 2011).
In the current research, we developed a mouse-tracking analysis
technique to assess individual differences in people’s decision
dynamics in HB tasks. An important advantage of this method is that it
does not rely on self-reports and that it does not interrupt people’s
decision process. In our experiments, we recorded participants’ mouse
movements in a computerized version of the denominator neglect task.
Our goal was twofold. First, we aimed to investigate the assumption that
reasoners first produce incorrect answers in HB tasks. Accordingly, we
explored the proportion of trials in which individuals moved their
mouse initially towards the correct response. Second, we investigated
why higher capacity people give more normative answers. Specifically,
we tested three explanations: Higher capacity people (1) have a higher
likelihood for initially correct answers, (2) are more likely to stay
with their initial answer when it is correct, and (3) are more likely
to change their mind when their initial answer is incorrect.
We chose the denominator neglect task to test these hypotheses, firstly,
because as a simple two choice reasoning problem, it is an ideal
candidate for mouse-tracking analysis; secondly, because previous
studies demonstrated that individual differences robustly arise in this
task (e.g., Kokis et al., 2002; Stanovich & West, 2001; Thompson &
Johnson, 2014). Our third reason was that the denominator neglect task
contains both incongruent and congruent trials which can be used to
measure the sensitivity of the mouse-cursor analysis: we expected to
find fewer correct initial response and more changes of minds in the
incongruent trials (see Bonner & Newell, 2010; Thompson & Johnson,
2014).
The current paper contains two experiments: a mouse-tracking experiment
and its replication. Since we had to make several post-hoc changes in
the analysis of Experiment 1, we replicated the study to ensure that
our findings are robust. As the methods and the analyses were identical
for both experiments, we report them conjointly.
2 Methods
2.1 Denominator neglect task
In the denominator neglect task, participants were presented with two
ratios and were asked to choose the larger one. Note that in this
simple version of the denominator neglect task, we displayed only the
ratio pairs but not pictures of trays and the description of the task
was also simplified accordingly.4 The ratio pairs
used in the current study were taken from Experiment 2 of Bonner and
Newell (2010). Every ratio pair consisted of a ‘small-ratio’ and a
‘large-ratio’. The denominator of the ‘small ratio’ was always 10
while the numerator was either 1, 2, or 3. For the ‘large ratio’, the
denominator was always 100 while the numerator changed in a way that
the value of the large ratio could differ from the smaller ratio
within the range of −9/100 and 9/100. In 27 trials, the large ratio
had a higher value (congruent trials), while in the other 27 trials, the
value of the small ratio was higher (incongruent trials).
It has been argued that, in the incongruent trials, an incorrect
heuristic response is triggered based on the comparison of the
numerators (e.g., Stanovich & West, 2001; Bonner & Newell, 2010;
Thompson & Johnson, 2014). As a result, people (incorrectly) tend to
choose the ratio with the higher numerator while neglecting the
denominator.
Note that we used both the incongruent and congruent trials to test
the sensitivity of our analysis, but used only the incongruent trials
to test our main hypotheses, since our interest in the current study
was the investigation of thinking dynamics in a task where supposedly
the first heuristic answer is incorrect.
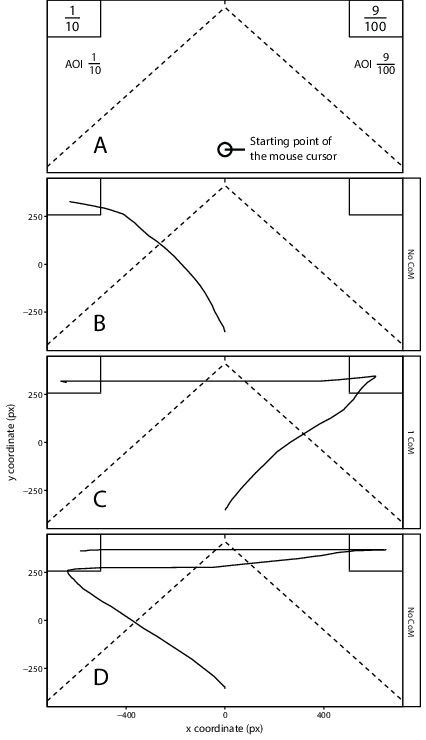
| Figure 1: Figure 1A shows an exemplary ratio pair along
with the borders of the corresponding areas of interests (AOIs) and
the starting position of the mouse cursor. Figure 1B, 1C and 1D show
three exemplary mouse trajectories. Figure 1B depicts a
case where the participant moves the mouse-cursor directly to the
left option. As the mouse trajectory enters only into the left AOI,
here we conclude that there was only one choice commitment towards
the left option and there was no Change of Mind (CoM).
Figure 1C shows a case where ultimately the left
option is chosen but the cursor was first moved into the right
AOI. Here, we conclude that there were two choice commitments, the
first commitment was to the right option which differed from the
final answer, consequently we classify this as a CoM
trial. Figure 1D illustrates a case when the individual
moves the mouse cursor first into the left AOI, then to the right
AOI and finally again to the left AOI. Here, we conclude that the
individual was first committed towards the left option, then towards
the right option before finally choosing the left option. We
categorize such trials as no CoM, since the first commitment and the
final answer were the same. |
2.2 Cognitive capacity measures
We administered an adaptive IQ test (Kovacs & Temesváry, 2016) which
applies Raven-like matrices and was adapted to the Hungarian
population.5 In contrast
to classical paper-pencil tests, the adaptive IQ test uses a response
item-bank and the items shown to each participant is determined by the
individual past performance. The procedure ends when the error range
of estimation is smaller than a pre-defined threshold. Participants
were also asked to fill out the Berlin Numeracy Test (BNT) which
measures numeracy (Cokely et al., 2012).6
2.3 Procedure
The experiments consisted of two sessions, an offline and an online
session. For the offline session, participants were invited in groups
of 15–20 to a computer test room. The computer screens had a 1440×900
px resolution and the standard mouse-sensitivity settings for
Microsoft Windows 8 Enterprise were used (medium mouse speed,
acceleration turned on). The experiments were built and run in
OpenSesame (Mathôt, Schreij & Theeuwes, 2012). The mousetrap plug-in
for OpenSesame (Kieslich & Henninger, 2017) was used to record the
x- and y-coordinates of the computer
mouse-cursor every 10 ms during the trials. At the beginning of each
experiment, participants provided informed consent and read the
following instructions: “In the experiment, you will see ratio pairs
and your task is to choose the larger value. Use the mouse cursor to
indicate your decision.” No information was provided about the
mouse-tracking aspect of the experiment. Afterwards, participants
completed four practice trials to familiarize themselves with the
task. This was followed by the presentation of 54 ratio pairs in a
randomized order for each participant. Participants had to click a
start button in the bottom center of the screen to start a new trial
(after which the mouse-cursor was automatically relocated to a
predefined start position in the bottom center of the screen). In each
trial, participants were presented with two ratios it the top right
and left corner of the computer screen (Figure 1). The left/right
position of the ratios was randomized on the trial level. Participants
had 3 seconds to make their decision in each trial.7 Aside
from the mouse movements, the accuracy and response time were recorded
in each trial. After the offline session, participants were sent an
email containing the information about the online session. Here, they
were asked to fill out an online test package containing the cognitive
capacity measures. Only participants who completed both the cognitive
capacity tests and the denominator neglect task were included in the
analysis.
2.4 Measuring dynamics of thinking using mouse-tracking
In a typical mouse-tracking paradigm, participants are asked to choose
between two spatially separated options on the screen while the
movement of their computer mouse is recorded. It is assumed that, if
the decision maker considers choosing one of the choice options, she
moves the mouse cursor towards that option (Freeman, Dale & Farmer,
2011; Koop & Johnson, 2011; Koop, 2013; Spivey, Grosjean & Knoblich,
2005; Travers, Rolison & Feeney, 2016). To assess the temporal
development of participants’ choice commitments, we developed a
mouse-tracking analysis using the areas of interest (AOI) technique
(see Palfi, Kieslich, Szaszi, Wulff & Aczel, 2018, for a detailed
description of the method and a comparison with other
methods).8 The main idea behind this technique is that one can
explore a reasoner’s first and subsequent choice commitments by
creating AOIs surrounding the choice options (see Figure 1A) and
analyzing the order in which the AOIs were visited by the mouse cursor
in each trial (for similar approaches, see Travers et al., 2016, and
Gürçay & Baron, 2017).9
In the current study, we used the reasoner’s initial commitment (i.e.,
first AOI around one of the choice options visited by the
participant’s mouse cursor) as a proxy for the participant’s first
answer. If this first commitment differed from the individual’s final
answer, we classified the trial as a Change of Mind (CoM) trial (e.g.,
in Figure 1C). Note, that to categorize a trial as a CoM trial, it was
necessary that the first and final answer differed (as is the case in
Figure 1C but not in Figure 1D). This was done as we were specifically
interested in changes between the first commitment and the final
response – and not in potential additional changes happening in
between.
2.5 Analysis
Analyses were performed using the statistical programming language R (R
Core Team, 2016). Mouse movements were processed and analyzed using the
mousetrap R package (Kieslich, Wulff, Henninger, Haslbeck &
Schulte-Mecklenbeck, 2016). In the analyses, choices and responses were
predicted in linear mixed models using the lme4 package (Bates,
Maechler, Bolker & Walker, 2015), specifying a random intercept for
each participant (the tested models are available in the Supplementary
Analysis Code). For response times, we used a linear mixed model and
p-values were obtained with the lmerTest package
(Kuznetsova, Brockhoff & Christensen, 2017); for dichotomous outcomes
(choices, correct first answers, changes of mind), we used a
generalized linear mixed model with a binomial link function.
| Table 1: Descriptive statistics of accuracy of the final and the first answer,
changes of mind, and response times in experiment 1 and 2. |
| | | Accuracy of first response (%) | Accuracy of final response (%) | Change of mind (%) | Response time (ms) |
| | | M | SD | | M | SD | | M | SD | | M | SD |
| Experiment 1 | Congruent | 73 | 44 | | 85 | 36 | | 20 | 40 | | 1479 | 495 |
| | Incongruent | 45 | 50 | | 84 | 37 | | 45 | 50 | | 1625 | 498 |
| Experiment 2 | Congruent | 69 | 46 | | 85 | 36 | | 26 | 44 | | 1567 | 477 |
| | Incongruent | 43 | 50 | | 85 | 35 | | 49 | 50 | | 1695 | 469 |
| Note. Means and standard deviations are calculated based on the
trial level values (ignoring participants).
|
2.6 Participants
Experiment 1:
Participants were recruited from a local
university subject pool in Hungary and received course credit in
exchange for participation. 109 undergraduate students provided answers
on the cognitive capacity tests and the denominator neglect task. The
participants who provided only 0 or 1 (out of 27) correct answers in
one of the conditions of the denominator neglect task (8 participants)
and those participants who obtained (for university students)
unrealistically low scores on the IQ test (<85, 4
participants) were excluded as these patterns indicated that the
participants were unmotivated to follow the instructions. Furthermore,
the trials on which participants failed to respond within the 3 second
time limit were omitted from the analyses (4% of trials). 97
participants were included in the final analyses (88% female, mean age
= 20.95 years, SD = 1.75; all Hungarian native speakers).
Experiment 2:
Participants were recruited from the same local
subject pool excluding those who participated in Experiment 1. From the
143 participants that completed the cognitive capacity measures and the
denominator neglect task, 10 and 4 participants were excluded
respectively employing the same exclusion criteria (and 4% of trials
were excluded as they exceeded the 3 seconds time limit). The remaining
129 participants were included in our final analyses (53% female, mean
age = 20.27 years, SD = 1.55; all Hungarian native speakers).
3 Results
Table 1 summarizes several aspects of participants’ responses: accuracy
of the first answer, accuracy of the final answer, CoMs, and response
times in both the congruent and in the incongruent conditions. While
the accuracy of the final answer was significantly higher in congruent
compared to incongruent trials, the difference was only small on a
descriptive level. However, participants took significantly longer to
respond in incongruent trials. The mouse-tracking method showed the
expected pattern regarding the effect of congruency: there was a
substantially lower percentage of correct first answers in incongruent
compared to congruent trials. Likewise, there were more CoMs in
incongruent compared to congruent trials. As can be seen in Table 2,
all differences were statistically significant.
| Table 2: Results of (generalized) linear mixed models for different
predicted variables in Experiment 1 and 2 with congruency as a
predictor. |
| Predicted variable | Experiment | Estimate (OR/b) | 95% CIs | Test statistic (z/t) | p |
| Accuracy of first response | 1 | 3.80 | [2.81, 5.14] | 8.67 | < .001 |
| | 2 | 3.30 | [2.62, 4.16] | 10.07 | < .001 |
| Accuracy of final response | 1 | 2.16 | [1.33, 3.54] | 3.08 | .002 |
| | 2 | 2.23 | [1.28, 3.86] | 2.84 | .004 |
| Changes of mind (CoM) | 1 | 0.29 | [0.23, 0.36] | −10.66 | < .001 |
| | 2 | 0.34 | [0.28, 0.41] | −11.26 | < .001 |
| Response time (RT) | 1 | −152.99 | [−181.78, −124.20] | −10.42 | < .001 |
| | 2 | −129.78 | [−155.67, −103.89] | −9.83 | < .001 |
| Note. The estimates represent the change in the estimate in the
congruent condition compared to the incongruent condition in a
(generalized) linear mixed model on the trial level specifying a random
intercept and random slope per participant. For RT, unstandardized
coefficient estimates (b) and t-values are
reported; for all other variables, odds Ratios (OR) and
z-values are reported.
|
3.1 Exploring the dynamics of thinking: accuracy of first
and final answers
Since our interest in the current study was the investigation of
thinking dynamics in a task where supposedly the first heuristic answer
is incorrect, in the subsequent analyses we analyzed only the
incongruent trials. Table 3 shows the number of correct and incorrect
final responses in the incongruent trials based on what the
participant’s first commitment was. As expected, in many trials,
participants started to move the mouse towards the incorrect answer
first; they mostly ended up changing their mind and choosing the
correct answer in the end. Still, several trials with an initially
incorrect response resulted in incorrect final responses. However,
there were also several trials in which an individual’s first answer was
the correct response and where this also corresponded to the final
answer. If the initial response was correct, participants changed their
mind only in a small number of cases and provided an incorrect final
response.
| Table 3: Percent of trials (in the incongruent condition) per experiment
classified based on the correctness of the initial and final response. |
| Expt. | | Correct initial response | Incorrect initial response |
| 1 | Correct final response | 42% | 42% |
| | Incorrect final response | 3% | 13% |
| 2 | Correct final response | 40% | 45% |
| | Incorrect final response | 3% | 11% |
| Table 4: Results of generalized linear mixed models using the cognitive capacity
score to predict the correctness of the initial and final response in
the incongruent condition in Experiment 1 and 2. (All models are generalized linear mixed models with a
binomial link function.) |
| Predicted variable | Expt. | OR | 95% CI | z | p |
| 21inCorrectness of final response | 1 | 1.43 | [1.13, 1.81] | 3.01 | .003 |
| | 2 | 1.58 | [1.30, 1.93] | 4.62 | < .001 |
| 21inCorrectness of initial response | 1 | 1.05 | [0.93, 1.18] | 0.80 | .424 |
| | 2 | 0.98 | [0.90, 1.07] | −0.45 | .656 |
3.2 Dynamics of the capacity-normativity relationship
To explore whether cognitive capacity predicts individual differences
in this task, we first investigated whether higher capacity people
gave more normative responses in the incongruent trials of the
denominator neglect task. We calculated composite scores from the IQ
and the BNT10 scores and used these as an
indicator for an individual’s general cognitive capacity. These composite
scores were calculated as the sum of the z-transformed IQ
and the BNT scores. Then we regressed the accuracy of the final answer
on the composite score in a generalized linear-mixed model. As
expected, the composite score predicted overall normative accuracy in
both experiments, as the odds of accurate answers increased with
increasing composite scores (Table 4).
In addition, we investigated whether the composite scores predicted the
accuracy of participants’ first commitments. The analysis revealed no
significant effect of the composite score in either of the experiments
(Table 4).
Finally, we aimed to assess whether higher capacity individuals give
more accurate final answers either because they make fewer changes when
their initial answer is correct or because they are more likely to
change their mind when their initial answer is incorrect – or both.
Accordingly, we built a generalized linear mixed model testing whether
the composite score predicted the number of CoMs when the initial
answer was correct, and another model testing the relationship of
composite score and CoMs when the initial answer was incorrect. As can
be seen in Table 5, the analyses in both experiments revealed
a significant main effect of the composite score on CoMs: higher
capacity people made more normative CoMs and less non-normative CoMs.
4 Discussion
| Table 5: Results of generalized linear mixed models using the cognitive capacity
score to predict the occurrence of a change of mind depending on the
correctness of the initial answer in the incongruent condition in
Experiment 1 and 2. (All models are generalized linear mixed models with a
binomial link function.) |
| Initial answer | Experiment | OR | 95% CI | z | p |
| Incorrect | 1 | 1.45 | [1.11, 1.90] | 2.75 | .006 |
| | 2 | 1.77 | [1.42, 2.20] | 5.06 | < .001 |
| Correct | 1 | 0.67 | [0.47, 0.95] | −2.28 | .023 |
| | 2 | 0.70 | [0.53, 0.93] | −2.43 | .015 |
In two experiments, we aimed to explore the dynamics of people’s
decision-making to better understand why some individuals are more
susceptible to biased thinking than others. We applied a novel
mouse-tracking analysis technique to track people’s first answer and
thinking dynamics in reasoning situations without interrupting the
reasoning process or relying on self-report measures. Using this
method, we investigated the assumption that reasoners initially produce
an incorrect answer in HB tasks. We observed that even in the
incongruent trials of the denominator neglect task individuals move the
mouse cursor first toward the correct response option in a substantial
number of cases. This finding provides converging evidence with the
result of recent studies using different methods (such as two response
paradigms or thinking aloud protocols; see e.g., Bago & De Neys, 2017;
Szaszi et al., 2017; Thompson & Johnson, 2014; Thompson et al., 2017)
that people sometimes produce correct initial responses in HB tasks and
that not everyone begins with a commitment to the incorrect response.
This finding suggests that models describing processes and individual
differences in HB tasks need to explain and integrate the existence of
the correct first responses. Bago and De Neys (2017) proposed that
neither the classic default-interventionist (corrective) dual process
theory nor the classic parallel dual process models can account for
this pattern and that such results are most aligned with a
hybrid-model.11 Their hybrid model suggests
that several initial, intuitive responses (correct and/or incorrect)
can be generated simultaneously, and their absolute strength will
determine which of them will be used as the first answer. If the
strength of the correct alternative is stronger, peoples’ first answer
will be correct (for an alternative hybrid model, see Pennycook,
Fugelsang & Koehler, 2015). Note, however, that we cannot
differentiate between the hybrid, default or parallel dual process
models based on our results, since we cannot test one crucial element:
which answer was generated by intuition and which by
deliberation. Future research is needed to address this issue.
Travers et al. (2016) applied a similar mouse-tracking analysis to
investigate the time-course of conflict in the CRT. In their paradigm,
4 different response options were presented to the participants and the
authors analyzed the mouse trajectories to determine the sequence in
which reasoners considered the response options. According to the model
supported by their experiment, participants move the mouse-cursor
towards the incorrect ‘heuristic’ option before choosing the correct
option. Based on this result, the authors concluded that the CRT tasks
automatically trigger a heuristic response which has to be suppressed
in order to respond correctly. One might be tempted to infer that these
results contradict our findings, but note that their results do not
imply that reasoners never start with the correct response. Similarly,
our findings do not indicate that the participants never had an
incorrect first answer. The data suggests that although in the majority
of incongruent trials individuals move the mouse cursor towards the
incorrect response, sometimes they are first committed to the correct
response.
We investigated another important aspect of individual differences in
the HB tasks: the time point at which the capacity-normativity
relationship arises. In contrast to Thompson and Johnson (2014), we
did not find evidence for the idea that the high capacity reasoners
produce more correct first answers.12 Instead, we found that differences in performance
between high and low capacity people arise after the first response is
formulated. This finding is in line with the predictions of previous
frameworks (De Neys & Bonnefon, 2013; Evans, 2007; Kahneman &
Frederick, 2002; Stanovich & West, 2008). We observed that
deliberation after the first response benefited higher capacity
people in two ways: they changed their mind more often after an
incorrect first response, and they changed their first response less
often if it was correct. To our knowledge, this is the first empirical
study showing that the latter effect also contributes to the
capacity-normativity relationship.13
Further research needs to investigate the exact role of previously
identified causal mechanisms such as differences in the storage,
monitoring ability, inhibition of the first response (De Neys &
Bonnefon, 2013), feeling of conflict (Pennycook, Fugelsang & Koehler,
2015), qualitative versus quantitative differences in deliberation
(Evans, 2007) or answer verification (Szollosi, Bago, Szaszi & Aczel,
2017) which potentially drive the advantage of these late processes.
We think that the AOI mouse-tracking analysis technique can provide an
additional way to test important questions in the reasoning literature
and has some important advantage in tracking the first answer. First,
in contrast to studies where participants are aware that the process of
their thinking is tracked, mouse-tracking is much less obtrusive and
might therefore decrease the likelihood that participants try to
deliberately hide their dynamics of thinking. This is especially
important if participants are not confident about their intuitions or
strive to appear more competent. Secondly, the AOI mouse-tracking
technique can assess the initial response without interrupting the
decision process. Therefore, mouse-tracking based methods can be
especially useful and sensitive tools to track individuals first
commitments and choice tendencies.
A key underlying assumption of the employed mouse-tracking paradigm is
that, if a choice option (i.e., response) is activated in the reasoners
mind, she will move the mouse towards the activated option.14 However, a critic might
argue that we cannot exclude unequivocally that the reasoners
deliberatively suppressed an activated heuristic answer before they
started to move their mouse cursor. Although we accept this possibility
as a limitation of our findings, we argue that our paradigm appeared to
be at least to some degree sensitive to initial responses, given
that the reasoners were more likely to first move the mouse towards the
incorrect response option in incongruent than in congruent trials.
Three more issues need to be considered in relation to our findings.
First, similar to previous research investigating the
capacity-normativity relationship, we cannot make conclusions on which
component of cognitive capacity caused the observed effects in our
study. Second, it also remains for future research to explore what
effect cognitive style has on the dynamics of thinking in HB tasks.
Finally, since previous studies suggested that HB tasks are not as
homogenous as previously thought (Aczel, Bago, Szollosi, Foldes &
Lukacs, 2015), future studies should explore how the present findings
generalize to other tasks or even to other versions of the denominator
neglect task. Although the present results indicate that more accurate
responding of higher capacity individuals in the denominator neglect
task generally arises from either the override of the first response
if it was incorrect or the less frequent change of the first response
if it was correct, it is safe to hypothesize that the model supported
in this paper is not going to work everywhere.15 In some contexts, some individuals give biased answers
because they produce quick incorrect responses, while in other cases
the biased answer is rather the results of a lack of deliberate
thinking. Future research needs to create a taxonomy and determine the
personality and task features which lead one or the other type of bias
to dominate.
In the present research, we studied how individuals differ in their
ability to provide normative responses and tested some of the key
predictions of the models describing individual differences in HB
tasks. Using a novel mouse-tracking analysis technique (based on AOIs), we
consistently found that individuals produce both correct and incorrect
first answers in the denominator neglect task. Furthermore, the
capacity-normativity relationship seemed to arise late in the
decision-making process in line with the predictions of several
decision-making models; that is, we did not find evidence that higher
capacity individuals had more correct initial answers but observed that
reasoners corrected their first answer more often if it was incorrect.
Moreover, we observed that high capacity individuals made fewer changes
after correct first answers. Our study showcases how mouse-trajectory
analysis can be utilized to investigate individual differences in
decision-making and its results can help better apprehend the
time-course of thinking and individual differences in HB tasks.
References
Aczel, B., Bago, B., Szollosi, A., Foldes, A., & Lukacs, B. (2015).
Measuring Individual Differences in Decision Biases: Methodological
Considerations. Frontiers in Psychology, 6, 1770.
Bago, B., & De Neys, W. (2017). Fast logic?: Examining the time course
assumption of dual process theory. Cognition, 158,
90–109.
Bates, D., Maechler, M., Bolker, B., & Walker, S. (2015). Fitting
Linear Mixed-Effects Models Using lme4. Journal of Statistical
Software, 67(1), 1–48. https://doi.org/10.18637/jss.v067.i01
Baron, J. (2008). Thinking and deciding. New York: Cambridge
University Press.
Bonner, C., & Newell, B. R. (2010). In conflict with ourselves? An
investigation of heuristic and analytic processes in decision making.
Memory & Cognition, 38(2), 186–196.
Bruine de Bruin, W., Parker, A. M., & Fischhoff, B. (2007). Individual
differences in adult decision-making competence. Journal of
Personality and Social Psychology, 92(5), 938–956.
Cokely, E. T., Galesic, M., Schulz, E., Ghazal, S., & Garcia-Retamero,
R. (2012). Measuring risk literacy: The Berlin numeracy test.
Judgment and Decision Making, 7(1), 25–47.
De Neys, W., & Bonnefon, J.-F. (2013). The “whys” and “whens” of
individual differences in thinking biases. Trends in Cognitive
Sciences, 17(4), 172–178.
Epstein, S., & Pacini, R. (2001). The influence of visualization on
intuitive and analytical information processing. Imagination,
Cognition and Personality, 20(3), 195–216
Evans, J. S. B. (2007). On the resolution of conflict in dual process
theories of reasoning. Thinking & Reasoning, 13(4),
321–339.
Frederick, S. (2005). Cognitive reflection and decision making.
The Journal of Economic Perspectives, 19(4), 25–42.
Freeman, J. B. (2014). Abrupt category shifts during real-time person
perception. Psychonomic Bulletin & Review, 21(1),
85-92.
Freeman, J., Dale, R., & Farmer, T. (2011). Hand in motion reveals mind
in motion. Frontiers in Psychology, 2, 59.
Gürçay, B., & Baron, J. (2017). Challenges for the sequential
two-system model of moral judgement. Thinking & Reasoning, 23(1), 49–80.
Hehman, E., Stolier, R. M., & Freeman, J. B. (2015). Advanced
mouse-tracking analytic techniques for enhancing psychological science.
Group Processes & Intergroup Relations, 18(3),
384–401. https://doi.org/10.1177/1368430214538325
Kahneman, D. (2011). Thinking, fast and slow. New York, USA:
Farrar, Straus, and Giroux.
Kahneman, D., & Frederick, S. (2002). Representativeness revisited:
Attribute substitution in intuitive judgment. In T. Gilovich, D.
Griffin, & D. Kahneman (Eds.), Heuristics of Intuitive
Judgment: Extensions and Applications (pp. 49–81). New York, NY, USA:
Cambridge University Press.
Kieslich, P. J., & Henninger, F. (2017). Mousetrap: An integrated,
open-source mouse-tracking package. Behavior Research Methods, 49(5),
1652–1667. https://doi.org/10.3758/s13428-017-0900-z.
Kieslich, P. J., Wulff, D. U., Henninger, F., Haslbeck, J. M. B., &
Schulte-Mecklenbeck, M. (2016). Mousetrap: An R package for processing
and analyzing mouse-tracking data.
https://doi.org/10.5281/zenodo.596640
Kokis, J. V., Macpherson, R., Toplak, M. E., West, R. F., & Stanovich,
K. E. (2002). Heuristic and analytic processing: Age trends and
associations with cognitive ability and cognitive styles.
Journal of Experimental Child Psychology, 83(1),
26–52.
Koop, G. J. (2013). An assessment of the temporal dynamics of moral
decisions. Judgment and Decision Making, 8(5), 527–539.
Koop, G. J., & Johnson, J. G. (2011). Response dynamics: A new window
on the decision process. Judgment and Decision Making, 6(8),
750–758.
Kovacs, K., & Temesvari, E. (2016). Számítógépes, adaptív IQ-mérés: Egy
gyakorlati példa. [Computerized, adaptive IQ measurement: An example
from Hungary]. Magyar Pszichológiai Szemle, 71(1),
143–163.
Kuznetsova, A., Brockhoff, P. B., & Christensen, R. H. B. (2017).
lmerTest package: Tests in linear mixed effects models. Journal
of Statistical Software, 82(13), 1–26.
Mathôt, S., Schreij, D., & Theeuwes, J. (2012). OpenSesame: An
open-source, graphical experiment builder for the social sciences.
Behavior Research Methods, 44(2), 314–324.
Parker, A. M., & Fischhoff, B. (2005). Decision-making competence:
External validation through an individual-differences approach.
Journal of Behavioral Decision Making, 18(1), 1–27.
Palfi, B., Kieslich, P. J., Szaszi, B., Wulff, D. U., & Aczel, B.
(2018) Detecting changes of mind through mouse-tracking.
Manuscript in preparation.
Pennycook, G., & Thompson, V. A. (2012). Reasoning with base rates is
routine, relatively effortless, and context dependent.
Psychonomic Bulletin & Review, 19(3), 528–534.
Pennycook, G., Fugelsang, J. A., & Koehler, D. J. (2015). What makes us
think? A three-stage dual-process model of analytic engagement.
Cognitive Psychology, 80, 34–72.
Pinto-Prades, J. L., Martinez-Perez, J. E., & Abellán-Perpiñán, J. M.
(2006). The Influence of the Denominator neglect Phenomenon on the
Elicitation of Health States Utilities. Judgment and Decision
Making, 1(2), 118–133.
R Core Team (2016). R: A language and environment for
statistical computing. Vienna,
Austria: R Foundation for Statistical Computing.
https://www.R-project.org/.
Scherbaum, S., & Kieslich, P. J. (in press). Stuck at the starting
line: How the starting procedure influences mouse-tracking
data. Behavior Research Methods.
Spivey, M. J., Grosjean, M., & Knoblich, G. (2005). Continuous
attraction toward phonological competitors. Proceedings of the
National Academy of Sciences of the United States of America,
102(29), 10393–10398.
Stanovich, K. E., & West, R. F. (1998). Individual differences in
rational thought. Journal of Experimental Psychology: General,
127(2), 161–188.
Stanovich, K. E., & West, R. F. (1998). Who uses base rates and P
(D/∼ H)? An analysis of individual differences. Memory
& Cognition, 26(1), 161–179.
Stanovich, K. E., & West, R. F. (2001). Individual differences in
reasoning: Implications for the rationality debate? Behavioral
and Brain Sciences, 23(5), 645–665.
Stanovich, K. E., & West, R. F. (2008). On the relative independence of
thinking biases and cognitive ability. Journal of Personality
and Social Psychology, 94(4), 672–695.
Svedholm-Häkkinen, A. M. (2015). Highly reflective reasoners show no
signs of belief inhibition. Acta Psychologica, 154,
69–76.
Szaszi, B., Szollosi, A., Palfi, B., & Aczel, B. (2017). The cognitive
reflection test revisited: exploring the ways individuals solve the
test. Thinking & Reasoning, 23(3), 207–234.
Szollosi, A., Bago, B., Szaszi, B., & Aczel, B. (2017). Exploring the
determinants of confidence in the bat-and-ball problem. Acta
Psychologica, 180, 1–7.
Thompson, V. A., & Johnson, S. C. (2014). Conflict, metacognition, and
analytic thinking. Thinking & Reasoning, 20(2),
215–244.
Thompson, V. A., Pennycook, G., Trippas, D., & Evans, J. S. G. (2017).
Do smart people have better intuitions? Unpublished
manuscript.
Thompson, V. A., Prowse Turner, J. A., & Pennycook, G. (2011).
Intuition, reason, and metacognition. Cognitive Psychology,
63(3), 107–140.
Travers, E., Rolison, J. J., & Feeney, A. (2016). The Time Course of
Conflict on the Cognitive Reflection Test. Cognition, 150,
109-118.
West, R. F., & Stanovich, K. E. (2003). Is probability matching smart?
Associations between probabilistic choices and cognitive ability.
Memory & Cognition, 31(2), 243–251.
Yamagishi, K. (1997). When a 12.86% mortality is more dangerous than
24.14%: Implications for Risk Communication. Applied Cognitive
Psychology, 11, 495–506.
This document was translated from LATEX by
HEVEA.