Judgment and Decision Making, Vol. 12, No. 6, November 2017, pp. 572-583
Are additives unnatural? Generality and mechanisms of additivity dominanceSydney E. Scott*
Paul Rozin#
|
Naturalness is important and valued by most lay Western individuals.
Yet, little is known about the lay meaning of “natural”. We examine
the phenomenon of additivity dominance: adding something to a
natural product (additive) reduces naturalness more than removing an
equivalent entity (“subtractive”). We demonstrate additivity
dominance for the first time using equivalent adding and subtracting
procedures. We find that adding something reduces naturalness more
than removing the same thing (e.g., adding pulp to orange
juice reduces naturalness more than removing pulp from orange juice;
Study 1); an organism with a gene added is less natural than one
with a gene removed (Study 2); and framing a product as an additive
(versus as a subtractive) reduces naturalness (Study 3). We begin to
examine accounts of additivity dominance. We find that it is not
due to the connotations of the word “additive” (Study 4). However,
data are consistent with an extra processing account — where
additives involve more processing (extracting and adding) than
subtractives (only removing) — and with a contagion account — where
adding is more contaminating than removing (Study 5).
Keywords: natural, process, contagion, additivity dominance, additive
1 Introduction
For many in the Western world, naturalness is an important and valued
concept (Rozin et al., 2004; Rozin, Fischler & Shields-Argeles,
2012). Consumers search for and prefer products that are labeled as
“natural”1, especially foods
(Rock, 2016). In fact, between 2003 and 2010 “natural” was the
second-most common claim made by new food and beverage products (USDA,
2017). Of course, individuals sometimes prefer unnatural products when
those products are better on other attributes (e.g., prefer an
unnatural medicine because it is more potent). However, most people
prefer a natural product when other attributes — such as price,
potency, and taste — are held constant (Rozin et al., 2004; Scott,
Rozin, & Small, 2017). In spite of this widespread natural
preference, little attention has been paid to what natural means to
the lay individual. In the present research, we investigate one key
feature of the lay meaning of natural: the absence of additives.
Prior work suggests that there are at least two defining features of
naturalness: absence of human processing or interventions and absence
of additives. In open-ended questions with American and European
respondents, the most common definitions of natural were “no
processing” (e.g., not altered, not touched by humans) and “no
additives” (e.g., no chemicals, nothing added; Rozin et al., 2012).
Some research has been devoted to understanding how the presence and
type of human processing alters perceptions of naturalness. This work
demonstrates, for example, that chemical transformations are less
natural than physical transformations (Rozin, 2005; Evans, de
Challemaison & Cox, 2010); mixing different entities is less natural
than mixing like entities (Rozin, 2005; Evans et al., 2010); and
genetic modification is particularly unnatural (Rozin, 2005; Tenbült,
de Vries, Dreezens & Martijn, 2005).
Less research has been devoted to understanding the psychology of
additives. We hypothesize the presence of additives2, one result
of human processing, reduces naturalness more than “subtractives”
(removals of some part of a natural product). We call this phenomenon
additivity dominance (Rozin, Fischler & Shields-Argeles, 2009). For
example, milk with all of the fat removed is viewed to be more natural
than milk with a small amount of natural vitamin D added, even though
the former manipulation much more substantially alters the content of
the milk (Rozin et al., 2009). The word “additive” is lexicalized in
many more languages than the logically equivalent word “subtractive,”
indicating additives may be more salient than subtractives (Rozin et
al., 2009). While this body of evidence is suggestive, only one paper
has directly examined the asymmetry between adding and
removing. Moreover, to our knowledge, no prior work has systematically
examined whether removing something (e.g., fat from milk) is less
natural than adding the exact same thing (e.g., fat to milk) or why
such an effect might occur.
We experimentally test whether additivity dominance occurs, using purer
examples than the previous literature. We expect that adding something
will reduce naturalness more than removing the same thing. Furthermore,
we test the generality of additivity dominance across many types of
products and for many types of additives. We examine two domains where
this type of asymmetry (adding versus removing the same thing) exists
in the real world: beverages and genetic modification.
Additivity Dominance for Beverages Hypothesis.
Additivity
dominance occurs for beverages, whether modified by physical or
chemical processes, such that products with ingredients added are rated
as less natural than products with the same ingredients
removed.
Additivity Dominance for Genetic Modification Hypothesis.
Additivity dominance occurs for genetically modified organisms, such
that organisms with genes added are rated as less natural than
organisms with genes removed.
Another way to examine whether additives are thought to be especially
unnatural, more so than subtractives, is to frame the same product in
different ways. In particular, we expect framing the same product as a
potential additive reduces naturalness.
Additivity Dominance Framing Hypothesis.
Framing a product as
an additive (versus a subtractive) reduces its perceived naturalness.
We also aim to investigate the reasons why additivity dominance occurs.
We present three possible accounts for additivity dominance.
We call the first account the connotation account. Additives may be
considered particularly harmful to naturalness because of the
connotations of the word “additive.” According to this account, when
the same product is described as having an “additive” as opposed to
being “fortified” or “supplemented” (which carry more positive
connotations), the additive effect should be enhanced.
Connotation Account Hypothesis.
Products described as having
an “additive” (a negatively valenced synonym) are rated as less natural
than the same products described as being “fortified” or “supplemented”
(more positively valenced synonyms), where the substance added is the
same in all three cases.
We call the second account the extra processing account. Rozin (2005)
found that processing substantially reduces naturalness. Additives are
a salient manifestation of processing. Additives must be 1) obtained
(often by a process, such as extraction) and 2) added to a product.
Subtractives, on the other hand, need only be removed. If individuals
view additives as involving extra human processing, then additives
should be especially detrimental to naturalness. According to this
account, two final products with the same content will be judged
differently depending on how the additive was added (i.e., the
processing history). For example, adding one unit of an additive in one
process (less processing history) is more natural than adding 1/3 a
unit three times in three separate processes (more processing history).
Extra Processing Account Hypothesis.
Additivity dominance will
be greater when the product contains an additive with more processing
history, controlling for the content of the product.
We call the third account the contagion account. This account arises
from the contagion law of sympathetic magic (Frazer, 1890/1922/1959;
Mauss, 1902/1972; Rozin & Nemeroff, 2002), a lay belief that once a
source entity comes into contact with a target entity, the source
transfers its essence and properties to the target. In other words,
“once in contact, always in contact.” Rozin, Millman & Nemeroff
(1986) show that magical contagion beliefs, initially thought to be
limited to traditional cultures, are very common in modern-day
Americans. In the case of additives, lay beliefs may hold that adding
foreign content involves a transfer of some unnatural quality from the
source (additive) to the target (product). This account is related to
purity, a frequent free associate of natural (Rozin et al., 2012).
Additives contaminate a product with a foreign essence, thereby
reducing purity. One principle of contagion is dose insensitivity,
where contagion increases minimally across different amounts of contact
(Rozin & Nemeroff, 2002). According to this account, naturalness
should be sensitive to the presence versus absence of an additive, but
insensitive to the dose of the additive. Generalizing dose
insensitivity to processing, we should also find that once processing
has occurred, additional amounts of it should not matter much.
Contagion Account’s Dose Insensitivity Hypothesis.
Increasing
the dose of an additive has small effects on the naturalness of the
product.
Contagion Account’s Processing Insensitivity Hypothesis.
Increasing the amount of the same process has small effects on the
naturalness of a product.
The current studies aim to clarify and begin to explain additivity
dominance. In Study 1, testing the additivity dominance for beverages
hypothesis, we investigate a set of pure cases of additivity dominance
by comparing naturalness ratings of beverages with something added to
beverages with the same thing removed. In Study 2, testing the
additivity dominance for genetic modification hypothesis, we examine
whether an organism with an added gene is less natural than an organism
with a deleted gene. In doing so, we extend additivity dominance to a
new domain. In Study 3, testing the additivity dominance framing
hypothesis, we examine whether framing a product as a potential
additive (versus a subtractive) reduces its naturalness. In Studies 4A
and 4B, we test the connotation account hypothesis; we examine whether
products are rated as particularly unnatural when they are described
with a negatively valenced synonym (“additive”) as compared to a
positively valenced synonym (“supplemented” or “fortified”). In Study
5, we test hypotheses from the extra processing and contagion accounts;
we examine the impact of tripling the additive’s dose or processing
history.
2 Study 1
Study 1 tests the additivity dominance for beverages hypothesis. We
expect that beverages are judged to be more natural when a component is
removed from the beverage than when the exact same component
is added to the beverage.
2.1 Method
2.1.1 Subjects
One hundred fifty-eight University of Pennsylvania undergraduate
students completed a web-based survey in exchange for class credit in
November 2011. In this and all following studies with the 0 to 100
perceived naturalness scale, we excluded subjects who gave
inconsistent responses to the scale training (see details below). In
this study, six subjects were excluded based on the scale training
criteria, leaving a final sample of 152 subjects (56.6% female,
Mage=19.4, SD=1.4).
2.1.2 Scale training
In this and all following studies measuring perceived naturalness on a 0
to 100 scale, subjects read the below scale training instructions
(adapted from Rozin, 2005):
3in
Please rate the following choices in terms of how natural you believe
they are. The scale runs from 0, which is completely unnatural, to
100, which is completely natural. For this scale and all scales with a
slider, you must move the slider for your answer to register. Even if
you want your answer to be 50, you still have to move the slider away
and back to 50 for your answer to count.
How natural are the following items?
______ A tree on a mountain peak in the Andes that has never been
climbed
______ A plastic toy model of a pistol
______ A hard boiled egg
The tree should get a rating at or near 100, the plastic toy model of a
pistol should be at or near zero, and the egg should be somewhere in
between. Please check to make sure this is true for your ratings, and
if not, think a bit before going on.
In this and following studies, we excluded subjects who rated the
tree as less natural than the egg or the egg as less natural than the
pistol3.
2.1.3 Procedure
After the scale training, subjects rated the naturalness of fourteen
beverages. There were four baseline beverages — organic and commercially
produced milk and orange juice. Additionally, there were five
additive-subtractive beverage pairs (ten beverages total): organic milk
with a) 100% more fat, b) 100% less fat, c) 100% more sugar, d)
100% less sugar, e) 50% more calcium, f) 50% less calcium, and
organic orange juice with g) 100% more pulp, h) 100% less pulp, i)
100% more vitamin C, j) 100% less vitamin C.
An additive drink was described as follows: “organic high sugar milk
(which is organic whole milk with double the sugar content, made by
adding the sugar removed from another batch of organic whole milk in
the process of making that batch low sugar milk).” A subtractive drink
was described as follows: “organic low sugar milk (which is organic
whole milk with all the sugar removed).”
These questions were embedded on one page in a larger survey on
preferences for natural products. Questions about milk products were
presented in one block together, and questions about orange juice were
presented in a different block together. Subjects first answered
questions about milk and then questions about orange juice. Beverages
within each block were presented in randomized
order4.
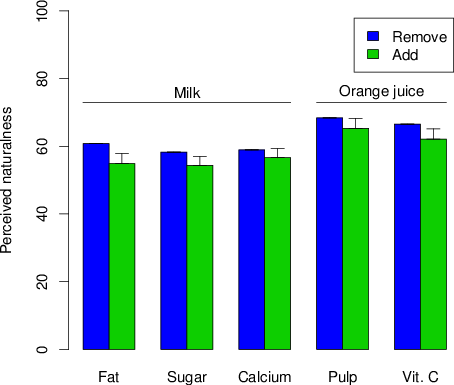
| Figure 1: Perceived naturalness of additive (versus subtractive) versions of milk and orange juice in Study 1. Because the t-test for each pair is a within-subjects (i.e., paired samples) t-test, the error bars are 95% confidence intervals of the difference between add and remove (as opposed to 95% confidence intervals of the mean). |
2.2 Results
2.2.1 Are beverages with something added less natural than those
with the same thing removed?
We conducted a 2 (Process: Added, Subtracted) x 5 (Beverage Pairs:
Milk with Fat, Milk with Sugar, Milk with Calcium, Orange Juice with
Pulp, Orange Juice with Vitamin C) repeated measures ANOVA on the
rated naturalness of the five additive-subtractive beverage pairs (ten
beverages total). Drinks with additives were rated as less natural
than those with subtractives (F(1,151)=16.57, p
< 0.001,
ηp2=0.10),
beverage pairs varied in naturalness (F(4,604)=28.46,
p<0.001,
ηp2=0.16),
and the additive effect did not depend on the beverage pair (no
interaction, F(4,604)=1.09, p=.360). Additive
beverages were rated as significantly less natural in four out of five
beverage pair comparisons (see Figure 1;
dRM5 from .13 to .30; see Table S2 in
Supplement for
descriptive statistics and t-tests for each pair).
2.2.2 How much does any intervention (adding or removing) affect
naturalness relative to no intervention?
As ancillary measures, we asked subjects to rate the naturalness of
organic milk (M=91.13, SD=13.88), organic orange
juice (M=91.84, SD=15.20), conventionally produced
milk (M=47.61, SD=28.21) and conventionally produced
orange juice (M=46.07, SD=29.07). These measures
illustrate that though additivity dominance is reliable, it is small
compared to other effects. Conventional processing versus organic
processing reduced naturalness by an average of 44.65 points. Removing
something versus no intervention reduced naturalness by an average of
28.82 points, and adding something (versus removing something) reduced
naturalness by another 3.94 points (32.76 points compared to no
intervention).
2.3 Discussion
Consistent with the additivity dominance for beverages hypothesis, Study
1 finds that consumers perceive a product with something added as less
natural than one with the same thing removed. We also find additivity
dominance for both healthy (e.g., vitamin C) and unhealthy (e.g.,
sugar) additives.
3 Study 2
Study 2 tests the additivity dominance for genetic modification
hypothesis. To examine the generality of additivity dominance, we move
to a very different domain — genetic modification of plants and animals.
We expect additivity dominance to extend to the domain of genetic
modification, such that organisms with a gene added are less natural
than those with a gene removed.
3.1 Method
One hundred ninety-five University of Pennsylvania undergraduate
students completed a web-based survey in exchange for class credit in
March 2012. Four subjects were excluded based on inconsistent
responses in scale training (see Study 1 scale training for more
information), resulting in a final sample of 191 subjects (59.2%
female, Mage=19.6, SD=1.7).
Subjects rated the naturalness of cocker spaniel dogs and of corn
plants. The scenario read as follows (emphasis in original):
3in
Imagine that, through new innovation, scientists have found a
way to insert or remove a gene. The scientists add or remove genes
in cocker spaniel dogs and in corn plants when the organisms are
fertilized eggs. When scientists add gene A to a cocker spaniel or
corn plant, they are adding the exact same gene A, extracted from
yeast cells. In all cases, the only effect of the genetic
modification is to make the cocker spaniel’s fur lighter in color,
and to make the corn lighter in color
How natural are the following organisms?
Dogs and corn plants either had a) “no genes inserted or removed”, b)
“additional gene A inserted by a scientist”, c) “original gene B
removed by a scientist”, or d) “original gene B replaced with new gene
A by a scientist”. Thus, subjects rated eight exemplars in a 2
(Organism: Dog, Corn) x 4 (Modification: None, Gene Added, Gene
Removed, Gene Replaced) design. The eight exemplars were presented on
one page in a randomized order. This page was embedded in a larger
survey on natural preference. Our primary comparison was gene added
exemplars versus gene removed exemplars, and no modification exemplars
were included to give a sense of the impact of any genetic
modification. Gene replaced exemplars were included as an exploratory
measure.
3.2 Results
3.2.1 Are organisms with genes added less natural than those with
genes removed?
We conducted a 2 (Organism: Dog, Corn) x 2 (Modification: Gene Added,
Gene Removed) repeated measures ANOVA on naturalness ratings. Adding a
gene reduced naturalness more than removing one
(F(1,190)=10.91, p=0.001,
ηp2=0.05),
corn plants and dogs did not reliably differ in naturalness
(F(1,190)=2.75, p=.099), and the additive effect did
not differ between corn plants and dogs (no interaction between
additive and organism, F(1,190)=0.66, p=.417).
Follow-up, two-tailed t-tests indicated that a dog with a gene added
was less natural than one with a gene removed
(Mdog, gene added=40.61,
SD=23.47, Mdog, gene
removed=43.18, SD=23.72, t(190)=2.53,
p=0.012, dRM=0.18) and a
corn plant with a gene added was less natural than one with a gene
removed (Mcorn, gene added=41.34,
SD=23.68, Mcorn, gene
removed=44.65, SD=23.57, t(190)=3.36,
p=0.001, dRM=0.24).
3.2.2 How much does any genetic modification (adding or
removing) affect naturalness compared to no genetic modification?
As ancillary measures, we asked subjects to rate the naturalness of
a dog with no genetic modification (M=87.50,
SD=22.44), a corn plant with no genetic modification
(M=89.60, SD=19.25), a dog with a gene replaced
(M=40.03, SD=23.49), and a corn plant with a gene
replaced (M=41.48, SD=24.21). As in Study 1, these
measures illustrate that additivity dominance is reliable but small
compared to other effects. On average, removing a gene reduced
naturalness by 44.64 points compared to not intervening, and adding a
gene reduced naturalness by 2.94 points compared to removing a gene
(47.58 points compared to no intervention).
3.3 Discussion
Consistent with the additivity dominance for genetic modification
hypothesis, Study 2 demonstrates that organisms with genes added are
perceived as less natural than those with genes removed.
4 Study 3
Study 3 tests the additivity dominance framing hypothesis. We expect
that framing the same product as a potential additive reduces its
naturalness, in comparison to a subtractive framing.
4.1 Method
Two hundred three American subjects completed a web-based survey on
Amazon’s Mechanical Turk in exchange for monetary compensation in July
2013. Twelve subjects were excluded based on inconsistent
responses in scale training (see Study 1 scale training for more
information) resulting in a final sample of 191 subjects (48.2%
female, Mage=32.0, SD=11.7).
Subjects rated naturalness of four items — peanut oil, orange pulp,
fat, and calcium. Each item was rated twice: once when the item was
framed as a subtractive and once framed as an additive. The subtractive
framings of these items were: “peanut oil that was removed from peanut
butter”, “yogurt fat that was removed from yogurt”, “orange pulp that
was removed from orange juice”, and “calcium that was removed from
milk”. The additive framings of these items were: “peanut oil that was
removed from peanut butter and is going to be added to another batch of
peanut butter”, “yogurt fat that was removed from yogurt and is going
to be added to another batch of yogurt”, “orange pulp that was removed
from orange juice and is going to be added to another batch of orange
juice”, and “calcium that was removed from milk and is going to be
added to another batch of milk.”
Subjects were randomly assigned to either view a page with four
items in the additive framing and then a page with four items in the
subtractive framing or vice versa. In between viewing the additive and
subtractive framings, subjects completed an unrelated study. On
each page, the order of the four items was randomized.
4.2 Results
The order of the framing manipulation (additive items first versus
subtractive items first) did not have any main or interactive effects,
so we collapse across order.6 We conducted
a 2 (Framing: Additive, Subtractive) x 4 (Item: Oil, Pulp, Fat,
Calcium) repeated measures ANOVA on naturalness ratings. Framing
items as potential additives reduced naturalness
(F(1,190)=37.03, p<.001, ηp2=.16),
items varied in naturalness (F(3,570)=39.70,
p<.001, ηp2=.17), and there was no framing
by item interaction (F(3,570)=1.46,
p=.225). Additive framing (versus subtractive framing)
significantly reduced naturalness in the paired comparisons for all
four items (see Figure 2; dRM from
.32 to .46; see Table S3 in
Supplement for
descriptive statistics and t-tests for each pair).
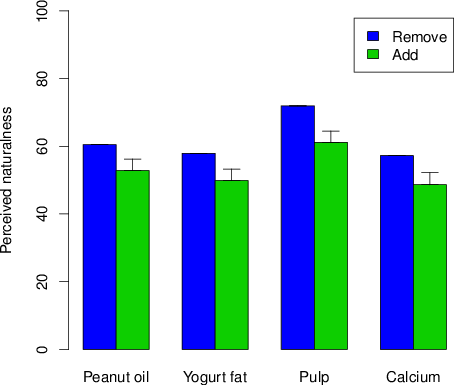
| Figure 2: Perceived naturalness of additive (versus subtractive) framings of four items in Study 3. Because the t-test for each pair is a within-subjects (i.e., paired samples) t-test, the error bars are 95% confidence intervals of the difference between add and remove (as opposed to 95% confidence intervals of the mean). |
4.3 Discussion
Consistent with the additivity dominance framing hypothesis, Study 3
finds that merely describing products as potential additives reduces
naturalness, for both healthy (e.g., calcium) and unhealthy (e.g., oil)
products. In the next studies, we begin to examine different accounts
of additivity dominance.
5 Study 4A
In Study 4A, we examine a connotation account of additivity dominance:
that additives are perceived as unnatural because the connotations of
“additive” are negative. In the connotation account hypothesis, we
predict that describing a substance as having an “additive” (negatively
valenced term) versus being “fortified” or “supplemented” (more
positively valenced terms) reduce perceived naturalness of the product
to which it was added.
| Table 1: Perceived naturalness of products described by synonyms with
different valence in Study 4a. |
| Word | Mean valence score (s.d.) | Mean rating for orange juice with
pulp added (s.d.) | Mean rating for peanut butter with fat added (s.d.) | Mean rating for milk with calcium added (s.d.) |
| Additive | −1.02 (1.85) | 59.66 (23.94) | 47.80 (25.29) | 54.31 (25.73) |
| Fortified | 1.83 (1.36) | 52.15 (26.86) | 39.05 (25.74) | 48.46 (24.72) |
| Supplemented | 1.67 (1.58) | 55.04 (24.83) | 45.19 (23.05) | 53.72 (21.85) |
| Note. Valence of free associates to a synonym is displayed in column 2 and naturalness ratings of different products depending on the synonym used to describe the additive are displayed in columns 3 through 5.
|
5.1 Method
Two hundred one American subjects completed a web-based survey on
Amazon’s Mechanical Turk in exchange for monetary compensation in July
2013. Eight subjects were excluded based on inconsistent responses
in scale training (see Study 1 scale training for more information)
resulting in a final sample of 193 subjects (50.3% female,
Mage=33.1, SD=12.0).
In the first part of the survey subjects completed a pretest to
assess whether different synonyms had different valence. There were
three blocks — an additive block, a fortified block, and a supplemented
block. Subjects completed all three blocks in a randomized order.
Within each block, subjects first generated three free associates
for the word (e.g., three free associates for additive in the additive
block), and then, on the next page, subjects rated the valence of
each free associate as positive, negative, or neutral.
In the second part of the survey, subjects were randomly assigned to
one of three conditions: additive description, fortified description,
or supplemented description. Subjects rated the naturalness of six
products: a) orange juice, b) orange juice with 50% extra pulp, c)
peanut butter, d) peanut butter with 50% extra fat, e) milk, and f)
milk with 50% extra calcium. Results for products without additives
are not central to our hypotheses, and are not discussed further.
Product descriptions varied depending on the subjects’ condition.
For example, a subject in the additive condition would have rated:
“Orange juice with a pulp additive (which is orange juice with 50%
extra pulp, made by adding pulp removed from another batch of orange
juice).” A subject in the fortified or supplemented condition would
have read the same description, except that it started with
“Pulp-fortified orange juice (which is…” or “Pulp-supplemented orange
juice (which is…” respectively. All six products were presented on one
page in a randomized order.
5.2 Results
5.2.1 Do synonyms vary in valence?
We assessed whether additive was a more negatively valenced synonym.
Subjects’ indicated their free associates were positive, neutral,
or negative, and we used these ratings to create valence scores. Each
free associate was assigned a score of +1 for positive, 0 for neutral,
and −1 for negative. The three free associates were then summed for
each word, such that subjects’ valence scores for a given word
ranged from +3 to −3.
Synonyms did differ substantially, such that the “additive” synonym
was more negatively valenced than other synonyms. In a repeated
measures ANOVA, subjects’ valence scores differed for the three words
(F(2,384)=223.60, p<0.001,
ηp2=0.54). In follow-up two-tailed paired t-tests, additive
valence was more negative than fortified valence and supplemented
valence (additive versus fortified, t(192)=17.54,
p<0.001,
dRM=1.26; additive versus
supplemented, t(192)=16.98, p<0.001,
dRM=1.22). Fortified and
supplemented valence did not differ (t(192)=1.18,
p=.239). Means and standard deviations of valence scores are
displayed in Table 1.
5.2.2 Do negatively valenced synonyms reduce naturalness?
Next, naturalness ratings were examined. According to a connotation
account hypothesis, the additive description should produce lower
naturalness scores than other descriptions because it is more
negatively valenced. We conducted a 3 (Description: Additive,
Fortified, Supplemented) by 3 (Item: Orange Juice with Pulp, Peanut
Butter with Fat, Milk with Calcium) mixed ANOVA on naturalness
ratings, with the first factor between-subjects and the second factor
within-subjects. Contrary to the connotation account hypothesis,
describing an item using different synonyms did not reliably alter
naturalness ratings (F(2,190)=2.14, p=.121).
Additionally, items varied in naturalness (F (2, 380)=25.96,
p<0.001, ηp2=0.12), and there was no
interaction between item and description (F(4,380)=0.37,
p=.834).
Opposite to the prediction of the connotation account, in follow-up
t-tests the additive description directionally increased
naturalness for all six pairwise comparisons. In one case, this
difference was significant (additive description was rated as more
natural than fortified description of peanut butter;
t(134)=2.00, p=.048, d=.34). Means and
standard deviations of naturalness ratings are displayed in Table 1.
For full information on the t-tests for each pairwise comparison, see
Tables S4–S6 in the
Supplement.
5.3 Discussion
Describing a product as having an “additive” (negative connotation) did
not reduce perceived naturalness as a connotation account would
predict. In fact, it directionally increased perceived naturalness.
This data is inconsistent with the connotation account of additivity
dominance. This result is surprising to us, since a negative
descriptor (additive) should intuitively act, if anything, to decrease
perceptions of a related positive feature (natural). This surprising
finding motivated our next study.
6 Study 4B
Study 4A finds that “orange juice with a pulp additive” and
“pulp-fortified orange juice” are viewed as similar in naturalness,
even though people rate the word “additive” as much more negatively
valenced than the word “fortified”. One possibility is that additive
is more negative than fortified because the two words make different
examples psychologically accessible. Additives could make examples
like preservatives and high fructose corn syrup accessible, whereas
fortifications and supplements could make examples like vitamins
accessible. When we control for these denotations in Study 4A by
specifying the content of the additive (e.g., pulp), the connotations
of additive versus fortified versus supplement have no effect on
naturalness.
In Study 4B, we aim to test this account. We examine whether
respondent-generated exemplars of “additives,” “fortifiers,” and
“supplements” differ in valence, healthfulness, and naturalness. We
expect that the psychologically accessible (i.e., easily generated)
exemplars of additives will be more negative, less healthy, and less
natural, consistent with findings in Study 4A. If so, the seeming
contradiction between the valence and naturalness ratings in Study 4A
can be interpreted to indicate that connotation (valence) does not
affect naturalness ratings, once controlling for subtly different
denotations (i.e., the content of the additive, such as “pulp”).
6.1 Method
Two hundred two American subjects completed a web-based survey on
Amazon’s Mechanical Turk in exchange for monetary compensation (46.5%
female, Mage=37.3, SD=13.6), in
August 2013.
Subjects were presented with each word (in the noun form) — additive,
fortifier, and supplement — and asked to generate three examples per
synonym in the context of food. Then, subjects went back to the
examples they had generated. They rated the valence of all examples
(“positive,” “neutral” or “negative”), then the healthfulness of all
examples (“healthy”, “neutral” or “unhealthy”), and finally the
naturalness of all examples (“natural”, “neither natural or unnatural”
or “unnatural”). All items were presented in this fixed order.
| Table 2: Perceived Valence, Healthfulness, and Naturalness of
subject-generated Additive, Fortifier, and Supplement examples in
Study 4B. |
Example | Mean valence score (s.d.) | Mean healthfulness score (s.d.) | Mean naturalness score (s.d.) |
Additive | −0.68 (1.97) | −1.45 (1.48) | −0.70 (1.90) |
Fortifier | 2.01 (1.44) | 1.94 (1.49) | 1.82 (1.51) |
Supplement | 1.97 (1.45) | 1.98 (1.46) | 1.59 (1.68) |
| Note. Scores calculated from subjects’ ratings of their own examples of additives, fortifiers, and supplements on valence, healthfulness, and naturalness are displayed. Scores range from −3 to 3.
|
| Day 1: | Create base product | | Create base product | | Create base product | | Create base product |
| Day 2: | Store product | | Store product | | Store product | | Add 5% additive |
| Day 3: | Store product | | Store product | | Store product | | Add 5% additive |
| Day 4: | Store product | | Add 5% additive | | Add 15% additive | | Add 5% additive |
| Day 5: | Package product | | Package product | | Package product | | Package product |
| Figure 3: Overview of stimuli in Study 5. A summary of the information
subjects received for each type of product is displayed (from left
to right: No additive, Add 5% via 1 process, Add 15% via 1
process, Add 15% via 3 processes). Information in bold represents
processing steps that differ from the “no additive” baseline
product. |
6.2 Results
Subjects rated valence, naturalness, and healthfulness of the nine
examples that they had just generated (three examples each for
additive, fortifier, supplement). We used these ratings to create
valence, healthfulness, and naturalness mean scores for each word.
Valence scores were calculated in the same manner as Study 4A.
Similarly, for healthfulness scores, each subject-generated example
was assigned as a score of +1 for healthy, 0 for neutral, and −1 for
unhealthy, then summed (resulting in a range of +3 to −3), and for
naturalness scores, each subject-generated example was assigned +1
for natural, 0 for neither natural or unnatural, and −1 for unnatural,
then summed (resulting in a range of +3 to −3).
We conducted three repeated measures ANOVAs, one each for valence
scores, healthfulness scores, and naturalness scores. Valence scores
differed across the three synonyms (F(2,402)=211.27,
p<0.001, ηp2=0.51), as did healthfulness
scores, (F(2,402)=440.43, p<0.001,
ηp2=0.69) and naturalness scores (F(2,402)=159.36,
p<0.001, ηp2=0.44). In follow-up,
two-tailed paired t-tests, additive examples were more negatively
valenced, more unhealthy, and more unnatural than fortifier and
supplement examples (all ps<0.001). Fortifier and
supplement examples did not differ in valence, healthfulness or
naturalness scores (ps > .08). The means and
standard deviations of valence, healthfulness and naturalness scores
are displayed in Table 2. For full information on the t-tests
comparing examples from different synonyms on valence, health, and
naturalness, see Tables S7–S9 of the
Supplement.
6.3 Discussion
Study 4A offered data inconsistent with the connotation account. Though
“additive” is more negatively valenced than “fortified” or
“supplemented”, “orange juice with a pulp additive” is not perceived as
less natural than “pulp-fortified orange juice” or “pulp-supplemented
orange juice.” We reconcile this apparent contradiction in Study 4B.
The synonyms elicit different psychologically accessible examples of
the entity to be added. “Additive” makes negative examples like
“preservatives” accessible, whereas “fortification” makes positive
examples like “vitamins” accessible. When we control for these
different denotations by specifying which entity has been added (as
done in Study 4A, with “pulp” in the above example), connotations of
the synonyms do not affect naturalness ratings
7 Study 5
Up to this point, we have presented some evidence suggesting that the
connotation account is weak, at best. In Study 5 we examine the extra
processing account and contagion accounts of additivity dominance. We
examine the effects of tripling a dose of an additive (same processing,
different content) and the effects of tripling the processing of an
additive by administering it in three smaller doses, each one third of
the total dose (more processing, same content). According to the extra
processing account hypothesis, administering three doses, each one
third of the same total amount, should notably decrease naturalness,
because it represents a shift from one to three processes (more
processing, same content). The contagion theory predicts that, due to
dose insensitivity, tripling a dose should have minimal effect
(contagion account’s dose insensitivity hypothesis), as should
administering the same content in three processes (contagion account’s
processing insensitivity hypothesis).
7.1 Method
Two hundred ten American subjects completed a web- based survey on
Amazon’s Mechanical Turk in exchange for monetary compensation in
February 2015. Sixteen subjects were excluded based on inconsistent
responses in scale training (see Study 1 scale training for more
information) resulting in a final sample of 194 subjects (51.5%
female, Mage=34.1, SD=11.3).
Subjects rated eleven beverages in a randomized order in a fully
within-subjects design. Each beverage was presented on a separate page.
Nine beverages followed a 3 (Beverage: Milk with Extra Calcium, Milk
with Extra Fat, Orange Juice with Extra Vitamin C) x 3 (Addition: 5%
More Through 1 Process, 15% More Through 1 Process, 15% More Through
3 Processes) design. For example, milk with 15% more fat through 3
processes was described as follows:
3in
Imagine a bottle of organic milk. The milk was produced in the following
manner.
Day 1: The cow was milked. The milk was placed in a
large refrigeration tank and cooled to 40 degrees Fahrenheit.
3in
Day 2: Extra milk fat from another batch of organic milk was added to
the refrigeration tank. The milk now contains 5% more fat than it did
on day 1.
Day 3: Extra milk fat from another batch of organic milk was added to
the refrigeration tank. The milk now contains 5% more fat than it did
on day 2.
Day 4: Extra milk fat from another batch of organic milk was added to
the refrigeration tank. The milk now contains 5% more fat than it did
on day 3.
Day 5: The milk was pumped into a plastic bottle and sealed.
How natural is this bottle of organic milk (which now contains
15% more fat)?
When the additive (e.g., fat) was added through one process, then the
scenario specified that milk was stored in the refrigeration tank on
days 2 and 3 and the 5% or 15% additive was inserted on day 4.
Subjects also rated two baseline beverages — organic milk and organic
orange juice — which were described in a similar manner except that they
were just stored on days 2–4. Figure 3 displays an overview of the
process and content of each type of product (no additive, 5% added via
1 process, 15% added via 1 process, and 15% added via 3 processes).
7.2 Results
7.2.1 Effects of increased dosage versus processing
First, we estimate how much tripling the dose of the additive reduces
naturalness. We compare cases with only one process (5% more through
1 process versus 15% more through 1 process) to estimate the effect
of a 5% versus 15% dose, averaging across the beverages (i.e., milk
with calcium, milk with fat, and orange juice with vitamin C). On
average, adding 15% of an additive as compared to 5% of an additive
reduced naturalness by 3.69 extra points on the 0 to 100 scale
(M5%, 1 Process=61.97,
SD=23.61, versus M15%, 1
Process=58.28, SD=24.83, t(193)=5.00,
p<0.001, dRM=.36; see
Figure 4; see Table S10 in
Supplement for
descriptive statistics and t-tests for each beverage). Insofar as this
difference is small, it supports both the contagion account and extra
processing account.
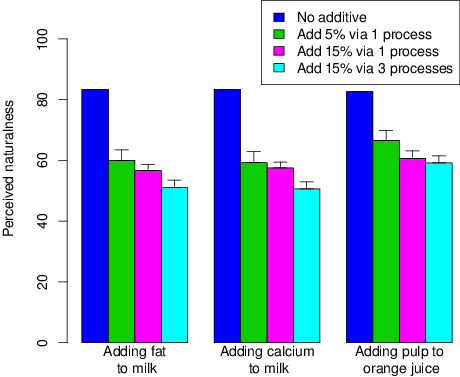
| Figure 4: Perceived naturalness of products in Study 5. Because the experimental design was fully within-subjects, the error bars are 95% confidence intervals of the differences between the mean and the mean to the left. For example, the error bar on “add 5% via 1 process” reflects the confidence interval on the difference between no additive and adding 5% via 1 process. |
Second, we estimate how much tripling the number of processes reduces
naturalness. We compare cases with 15% doses (15% more through 1
process and 15% more through 3 processes) and estimate the effect of
1 versus 3 processes, averaging across the beverages (i.e., milk with
calcium, milk with fat, and orange juice with vitamin C). On average,
three processes as compared to one process reduced naturalness by 4.68
extra points on the 0 to 100 scale
(M15%, 1 Process=58.28,
SD=24.83 versus M15%, 3
Processes=53.60, SD=25.82, t(193)=5.59,
p<0.001, dRM=.40; Figure 4; see Table S11
in Supplement for
descriptive statistics and t-tests for each beverage). Insofar as this
difference is significant, it supports the extra processing account,
but insofar as it is small, it supports the contagion account.
7.2.2 How much does any additive affect naturalness compared to no
additive?
To determine the relative size of each of our manipulations, we
examined the naturalness of baseline beverages — organic orange juice
(M=82.66, SD=23.44) and organic milk
(M=83.36, SD=22.68). On average adding a small 5%
dose compared to the no-intervention baseline reduced naturalness by
21.04 points (e.g., comparing organic milk to organic milk with 5%
more fat through 1 process). Tripling that dose reduced naturalness by
another 3.69 points (e.g. comparing organic milk with 5% more fat
through 1 process to organic milk with 15% more fat through 1
process). Tripling the processing history reduced naturalness by 4.68
points (e.g., comparing organic milk with 15% more fat added through 1
versus 3 processes).
7.3 Discussion
Consistent with both the contagion account and the extra processing
account, tripling the dosage of the additive only slightly reduces
naturalness, and this effect is relatively small compared to the effect
of inserting versus not inserting an additive. Consistent with the
extra processing account, adding the same amount of additive with more
processes reduces naturalness. However, consistent with the contagion
account, the effect of tripling processing history is small.
8 General discussion
In five studies, we examine additivity dominance — an entity with
something added is less natural than an entity with the same thing
removed. Study 1 demonstrates that adding something is more
detrimental to naturalness than removing the same thing, regardless of
whether the additive is healthy (e.g., vitamin C) or unhealthy (e.g.,
sugar). Study 2 extends additivity dominance to the domain of genetic
modification, showing that organisms with genes added are perceived as
less natural than organisms with genes removed. Study 3 demonstrates
that merely framing an entity as a potential additive reduces its
naturalness. In Studies 4 and 5, we examine possible mechanisms of
additivity dominance.
8.1 Mechanisms of additivity dominance
We do not yet know the mechanisms of additivity dominance, but we
examine three accounts. Study 4 shows that the negative connotations of
the word “additive” cannot be the sole or even primary explanation of
additivity dominance. Using more positive synonyms such as
“supplemented” does not increase naturalness. Study 5 offers a test of
the validity of both the contagion account and the extra-processing
account. Consistent with both accounts, the largest decrease in
naturalness occurs for inserting an additive compared to leaving a
product unaltered; increasing the dose of the additive has a relatively
small effect. Consistent with the extra processing account, increasing
the processing history of the additive has a statistically significant
impact, reducing naturalness of the final product. However, consistent
with the contagion account, the effect of tripling processing history
is small. We expect that the contagion and extra processing accounts
work in concert. In fact, one possibility is that extra processing
reduces naturalness in part because it increases contagion and contact
with outside sources. Three processes imply more direct or indirect
human contact. One potential direction for future research is exploring
the relationships between contagion, processing, and additivity
dominance.
We do not yet know exactly why the first effect — the first addition or
removal relative to baseline — is so large. One possibility is that an
additive product (e.g., organic orange juice with extra pulp)
spontaneously brings to mind the product category (e.g., orange juices;
see Kahneman & Miller, 1986). In the context of that category, the
unaltered organic product (e.g., organic orange juice) represents a
state of purity. Any deviation (e.g., by adding or removing orange
juice) destroys that purity. This account is consistent with the
relatively high naturalness ratings given to baseline products
throughout these studies (products that represent a state of purity
within the category). However, even if this account is true, it is
incomplete. We still do not know why the first addition or removal
relative to the baseline product destroys purity. It could be a
combination of contagion and processing, or it could involve a yet
unidentified process. Contagion predicts almost no effect of tripling
the dose or dividing it into three sub parts (three processes). The
minimal (though significant) effect of both of these processes suggests
a more important role for contagion.
8.2 Relationships to other judgment and decision-making
processes
The relationship between the present results and other principles in
judgment and decision-making, such as omission bias and status quo
bias, is open for future research. Kahneman & Tversky (1982) first
observed that people feel more regret when bad outcomes are brought
about by actions versus by inactions. Researchers later discovered
multiple biases were at work including omission bias — where harms
caused by actions are worse than harms caused by inactions — and
status quo bias — where people prefer to keep the status quo (Ritov &
Baron, 1992; Spranca, Minsk & Baron, 1991). The naturalness bias is
closely related to this body of research. Naturalness bias describes
a dislike of action (human processing) and desire for status quo
(keeping things in nature the same). Indeed, it is possible that
perceived naturalness is one mediator for some instances of these
effects (e.g., omission bias in vaccination decisions, Asch et al.,
1994).
However, we also note that additivity dominance is not easily explained
by omission bias or status quo bias. It is true that both accounts
predict that additives will reduce naturalness. Additives are
generated by human processing and they involve a departure from the
status quo (the original state of the product). However, subtractives
are also a result of action and involve an equally large departure from
the status quo in these studies. Thus, we expect the
commission-omission and status quo distinctions are less useful when
comparing additives and subtractives, specifically.
8.3 Conclusion
We think examining additivity dominance furthers understanding about the
lay definitions of natural and accounts of naturalness judgments. We
leave open whether additivity dominance extends to other cultures. We
also leave open the possibility that additivity dominance reflects a
broader principle that extends beyond naturalness judgments.
References
Aubrey, A. (2015, November 11). What’s ‘natural’ food? The government
isn’t sure and wants your input. National Public Radio.
Retrieved from
http://www.npr.org/sections/thesalt/2015/11/11/455506222/whats-natural-food-the-government-isnt-sure-and-wants-your-input.
Asch, D. A., Baron, J., Hershey, J. C., Kunreuther, H., Meszaros, J.,
Ritov, I., & Spranca, M. (1994). Omission bias and pertussis
vaccination. Medical Decision Making, 14(2), 118–123.
Evans, G., de Challemaison, B., & Cox, D. N. (2010). Consumers’
ratings of the natural and unnatural qualities of
foods. Appetite, 54(3), 557–563.
Frazer, J. G. (1959). The new golden bough: A study in magic and
religion (abridged). New York: Macmillan (Edited by T. H. Gaster,
1922; Original work published 1890).
Kahneman, D., & Miller, D. T. (1986). Norm theory: Comparing reality to
its alternatives. Psychological Review, 93(2), 136–153.
Kahneman, D., & Tversky, A. (1982). The psychology of preferences.
Scientific American, 246, 160–173.
Mauss, M. (1972). A general theory of magic. (Robert Brain,
Trans.) New York: W. W. Norton. (Original work published 1902).
Morris, S. B., & DeShon, R. P. (2002). Combining effect size
estimates in meta-analysis with repeated measures and
independent-groups designs. Psychological Methods, 7(1),
105–125.
Rock, A. (2016, January 29). Peeling back the ‘natural’ food label.
Consumer Reports. Retrieved from
http://www.consumerreports.org/food-safety/peeling-back-the-natural-food-label/.
Ritov, I., & Baron, J. (1992). Status-quo and omission biases.
Journal of Risk and Uncertainty, 5, 49–61.
Rozin, P. (2005). The meaning of “natural”: Process more important
than content. Psychological Science, 16(8), 652–658
Rozin, P., Fischler, C., & Shields-Argelès, C. (2009). Additivity
dominance: Additives are more potent and more often lexicalized across
languages than are “subtractives”. Judgment and Decision
Making, 4(5), 475–478.
Rozin, P., Fischler, C., & Shields-Argelès, C. (2012). European and
American perspectives on the meaning of natural. Appetite,
59(2), 448–455.
Rozin, P., Millman, L., & Nemeroff, C. (1986). Operation of the laws
of sympathetic magic in disgust and other domains. Journal
of Personality and Social Psychology, 50(4),
703–712.
Rozin, P., & Nemeroff, C. (2002). Sympathetic magical thinking: The
contagion and similarity “heuristics”. In T. Gilovich, D. Griffin
& D. Kahneman (Eds.), Heuristics and biases: The psychology of
intuitive judgment. (pp. 201–216). Cambridge: Cambridge University
Press.
Rozin, P., Spranca, M, Kreiger, Z., Neuhaus, R., Surillo, D., Swerdlin,
A., & Wood, K. (2004). Preference for natural: Instrumental and
ideational/moral motivations, and the contrast between foods and
medicines. Appetite, 43, 147–154.
Scott, S. E., Rozin, P., & Small, D. A. (2017). Consumers
Prefer “natural” more for preventatives than for curatives. Manuscript
submitted for publication.
Spranca, M., Minsk, E., & Baron, J. (1991). Omission and commission in
judgment and choice. Journal of Experimental Social
Psychology, 27(1), 76–105.
Tenbült, P., de Vries, N. K., Dreezens, E., & Martijn,
C. (2005). Perceived naturalness and acceptance of genetically
modified food. Appetite, 45(1), 47–50.
United States Department of Agriculture (2017). New products.
Retrieved from
http://www.ers.usda.gov/topics/food-markets-prices/processing-marketing/new-products.aspx.
This document was translated from LATEX by
HEVEA.