| Figure 1: The visual arrangement of elements on the screen, the same across all tasks (only elements in black were visible to subjects). |
Judgment and Decision Making, Vol. 12, No. 6, November 2017, pp. 596-609
A novel approach to studying strategic decisions with eye-tracking and machine learningMichal Krol* Magdalena Krol# |
We propose a novel method of using eye-tracking to study strategic decisions. The conventional approach is to hypothesize what eye-patterns should be observed if a given model of decision-making was accurate, and then proceed to verify if this occurs. When such hypothesis specification is difficult a priori, we propose instead to expose subjects to a variant of the original strategic task that should induce processing it in a way consistent with the postulated model. It is then possible to use machine learning pattern recognition techniques to check if the associated eye-patterns are similar to those recorded during the original task. We illustrate the method using simple examples of 2x2 matching-pennies and coordination games with or without feedback about the counterparts’ past moves. We discuss the strengths and limitations of the method in this context.
Keywords: task recognition, eye-tracking, strategic games, machine learning
Recently, there has been growing interest in using the eye-tracking method, already well established in psychology, to study economic decision-making. The purpose is to gain insights about behavior that would be unavailable based on observed choice data alone. At the same time, in contrast with more expensive and complex procedures, like fMRI, eye-tracking makes it possible to test subjects under exactly the same conditions as those that they encounter in standard behavioral experiments.
To date, the prevalent approach has been to formulate models of the decision process, together with the corresponding characteristic gaze patterns that should occur if each of the alternative models was accurate. One can then select the best model based on: a) the fit between the postulated and observed gaze patterns; and b) the fit between the choices predicted by the model for the observed gaze patterns and the choices that actually occur. Such a potential use of process tracing techniques in studying decisions has long been acknowledged (Schulte-Mecklenbeck and Kü, 2011).
For instance, Krajbich, Armel and Rangel (2010) and Krajbich and Rangel (2011) evaluate a number of alternative drift-diffusion models in the context of choosing between two or between three food items, and report, among other things, that: a) as predicted by the theory, eye-fixations immediately prior to choice are relatively short; and b) some of the models, but not others, correctly predict that food items that were looked at more often are also more likely to be selected. In a similar context (but for a larger number of alternative choice items), Reutskaja et al. (2011) compare an optimal costless search model, a satisficing search model and a hybrid search model, while Arieli, Ben-Ami and Rubinstein (2011) consider choosing between lotteries. Relatedly, Rubaltelli, Dickert and Slovic (2012) report that eye-movement patterns differ across two variants of the same task, depending on whether subjects evaluate gambles on an attractiveness scale or via specifying the monetary amount one would pay to partake in or avoid the gamble. This suggests that the impact of decision consequences (even hypothetical ones) on the underlying decision process could be reflected in the accompanying eye-movements — an idea that will be important for this study. Interestingly, Glö (2011) report that eye-movement patterns recorded while choosing between gambles “conflict with the idea that necessary calculations are deliberately conducted by computing weighted sums”, while Venkatraman, Payne and Huettel (2014) use eye-data to argue that people readily switch between different decision strategies.1
These results are important, given our focus on a particular type of decisions, namely those between different strategies, each of which will yield payoffs contingent on the unknown choice of another party. Because of this strategic uncertainty, such decisions may also be thought of as gambles. In this context, eye-tracking becomes technically more challenging to conduct on more than one computer terminal at the same time. Hence, many studies use a related but less complex mouse-tracking procedure, which entails hiding parts of the decision screen containing various pieces of information behind boxes that reveal their contents only as long as the subject hovers the mouse cursor over them. This has some limitations, such as the fact that subjects might be reluctant to explore the screen to collect data when this requires more effort, and need not look at the data under the cursor at all. An example of this approach is the work of Johnson et al. (2002), who reject backward induction reasoning in a sequential bargaining game based on the fact that subjects do not look at the information sufficiently far ahead. A number of studies focus on subject heterogeneity. For example, Costa-Gomes, Crawford and Broseta (2001) and Costa-Gomes and Crawford (2006) group subjects into a priori-defined types, depending on their choices and the accompanying mouse lookup pattern, and find that deviations of observed choices from equilibrium can be largely explained by subjects belonging to types based on various degrees of k-level thinking (see also Stewart and Gä, 2016). More recently, Brocas et al. (2014) and Polonio, Di Guida and Coricelli (2015) use cluster analysis to group subjects into types without having to define them beforehand (thereby requiring less model structure to be imposed a priori). Note that the latter study is based on eye-tracking (rather than mouse-tracking), and reports that the subjects’ types can remain stable over time and across different strategic tasks. Our aim is similar, in that we want the analysis to be as model-free as possible, but with the focus on heterogeneity of cognitive processing across different tasks, rather than between subjects.
More specifically, in many situations it may be difficult to specify a priori what gaze patterns should accompany a given decision rule. For instance, suppose we have subjects playing a coordination game in which they each independently choose one of two numbers shown on-screen, and get rewarded only if they both choose the same number. Suppose we want to ascertain how confident they are of the counterpart’s expected choice, and consequently of their own decision. As shown by Rutstrom and Wilcox (2009), asking subjects to state their beliefs can interfere with game play, while inferring the beliefs from counterparts’ past observed actions requires data from several decision trials and feedback from previous trials being available to subjects. In contrast, eye-tracking is completely noninvasive (does not interfere with the choice problem), and makes it possible to analyze single decision trials in isolation, or scenarios in which feedback on counterparts’ past actions is unavailable.
At the same time, however, it is difficult to specify a priori what eye-movement patterns would be a marker of making confident predictions of others’ choices, as opposed to being unsure about them. In the former case, we might expect subjects to look carefully at both options in turn in order to compare them and form a well-grounded expectation. However, switching one’s gaze between the options could also be a sign uncertainty and indecision (Patalano, Juhasz and Dicke, 2009). Similarly, focusing on one of the options could mean that one is sure the counterpart would choose it, or that, on the contrary, one thinks that to predict the choice of the other player is impossible and hence chooses the first option she happens to look at.
Instead of making assumptions about how players’ decision strategies dictate the distribution of eye fixations between options, it would therefore be prudent to establish this relationship empirically. For example, we might ask subjects to play two additional variants of the original task against a computer player: (1) where they are told that the computer will “flip a coin” to select one of the numbers with equal probability; and (2) where the computer will select the number according to a pre-specified rule. Thus, in the latter case subjects should be considerably more certain of the counterpart’s choice than in the former case. We can then check which of the two variants in question is more similar to the original strategic task (playing against a human player) in terms of the accompanying eye-tracking data. This should allow us to gain insight into decision-making strategies involved in the original task.
Of course, as a prerequisite for this analysis, we need to have a method of measuring similarity that would allow us to distinguish between the two variants of the task with good accuracy. In other words, given eye-data of a subject playing a single trial of the game against the computer, we should be able to predict whether the trial was an instance of variant (1) or (2) of the original task.
This alone is a considerable challenge, much more so than simply documenting the statistical differences between the two variants of the task. An early encouraging result is the work of Day (2010), who uses the Needleman-Wunsch algorithm to predict which of a number of decision-strategies a given sequence of eye-movements corresponds to, with accuracy significantly above chance. However, this is done by comparing the sequence to a hypothetical model sequence, specified a priori for each strategy by the researcher. In this sense, the study resembles the bulk of existing literature, as described above, in theorizing in advance as to what gaze patterns we should find in order for a given hypothesis to be confirmed. Furthermore, the decision strategies themselves are imposed on the subjects, who are first extensively trained and then explicitly instructed to use them. This puts into question the ability of the method to identify the decision strategy when people can choose it freely, and when eye-movements actually accompanying each strategy are different from the hypothetical ones specified by the researcher (as was in fact observed by the author).
Indeed, Greene, Liu and Wolfe (2012) reported a negative result, suggesting that it is impossible to identify the observer’s task by comparing the accompanying eye movements with those of other subjects pursuing each different type of task. However, Borji and Itti (2014) showed that applying non-parametric machine learning classification techniques can change this state of affairs. In particular, subjects’ gaze patterns were recorded while performing one of a number of image-viewing tasks (like estimating the ages of people shown in the picture or their material circumstances). In the end, the classification algorithm was able to guess which task was performed based on eye-data with an accuracy significantly above chance.
In this paper, we extend this approach, for the first time, to economic and particularly strategic decisions. Furthermore, we show that it can be used to analyze tasks that are visually similar, but where the underlying decision strategy is unknown, in order to gain meaningful insights into the impact of factors such as the game’s payoff structure or the availability of feedback on the players’ decision process.
More specifically, our demonstration of the proposed method using simple 2x2 games proceeds as follows. Depending on the experimental condition, we ask each subject to play either a coordination game or a matching pennies game a number of times. Initially, the subject plays against a computer player, who behaves according to variant (1) above in some trials, and otherwise according to variant (2), where the subject is always told which scenario occurs in a given trial. Next, the subject plays the same game against another human player, where (depending on the second experimental condition) feedback about the counterpart’s past decisions is either available or not.
To analyze the process tracing data, we use a neural-network classification algorithm with reaction time, pupil dilation and gaze dispersion as inputs. In other words, we refrain from using more complex identifiers, such as the various similarity or distance measures between scanpath sequences (Cristino and Mathô, 2010; Dewhurst and Nyströ, 2012), or scanpath representation matrices (Hayes, Petrov and Sederberg, 2011). This is because, with only two numbers required to convey all information about the game (and hence only two areas of interest), we considered the complete scanpath sequence information superfluous. At the same time, we conjectured that the main problem would be that different people might use different viewing strategies to approach the same variant of the task. Such a tendency would result in considerable noise and possibly non-linear relationships between the variables. This motivated our use of the machine-learning neural network technique.
We find that we are able to predict, with cross-validated accuracy significantly above chance, whether eye-data from a given trial played against the computer corresponds to the latter being known to behave according to variant (1) or (2) of the task. In addition, the accuracy rate is slightly, but significantly higher than when using the canonical logistic regression model instead of a neural network. This demonstrates that eye-tracking, combined with machine-learning, can be used to identify the information that players have about the counterparts’ play in strategic games.
We therefore proceed to use the trained neural network algorithm to investigate unknown decision-processes involved in playing against a human player, and investigate how these are influenced by the experimental conditions. As might be expected, we find that the availability of feedback results in more trials being classified as instances of variant (2) of play against the computer (where the behavior of the latter is fully predictable). More surprisingly, the effect of a more competitive payoff structure is similar. Specifically, when playing the matching-pennies game, compared with the coordination game, subjects’ eye-movements are more similar to those observed when playing a predictable computer player. This holds despite subjects being incentivized to hide their mode of play from the rival in the matching-pennies game, and to make it transparent and predictable in the coordination game.
To further illustrate the strengths and limitations of the proposed method, we conclude by discussing the implications of the results of our demonstration for existing theories, particularly the interpretation of the mixed-strategy Nash Equilibrium concept, and existing research on mixed-strategy play by “amateur” subjects in the lab vs. “professional” subjects in the field (Wooders, 2010; Levitt, List and Reiley, 2010).
The experiment was conducted at the University of Social Sciences and Humanities in Wroclaw (SWPS), Poland. 96 subjects were recruited from the local population of undergraduate and postgraduate students (mean age =23.66, SD =6.7, 51 females). Subjects did not previously take part in any Economics or related courses, nor in any experiments on strategic interactions. The data of four subjects who were not able to successfully undergo the eye-tracking calibration procedure (see Section 2.3) was removed from the analysis, leaving 92 subjects.
Every point scored in the study was converted to 0.50 PLN (local currency, equivalent to 13 US cents). The experiment took around 30 minutes and the average payoff was 29.67 PLN (7.55 USD). This was in line with the rewards typically offered to subjects in similar studies in Poland.
The experiment adapted the fixed-pair protocol (subjects randomly matched into pairs and interacting only with the other subject from the same pair). This was first used in the classic study by (O’Neill, 1987), and subsequently by most related experimental studies mentioned in the previous section. The tasks were presented in visual form with instructions communicated in words (both verbally and on-screen), rather than as a matrix. In addition, the procedure was adapted to enable the use of eye-tracking.
Each subject attempted three different tasks a number of times, where
the visual arrangement of the elements on the screen was simple and
identical for all tasks. This was to ensure that any between-task
variation in eye-activity could not be attributed to differences in
visual appearance, and to eliminate any potential pupil foreshortening
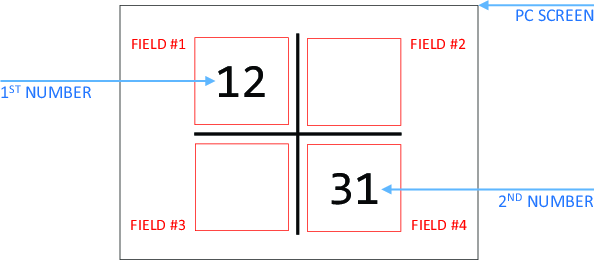
error (Hayes and Petrov, 2016). In particular, as illustrated in Figure
1, subjects were shown two two-digit integers, displayed in
two of four possible square fields. The fields in which the numbers
were shown, as well as the numbers themselves, changed randomly in
each round. This made it impossible for subjects to memorize the exact
visual structure of the tasks, and thus inducing them to constantly
explore the screen (which provided us with the required
eye-data). Throughout the whole study, divided into Stage One and
Stage Two, subjects were asked to select one of the two numbers, based
on varying rules and criteria.
Figure 1: The visual arrangement of elements on the screen, the same across all tasks (only elements in black were visible to subjects).
In the first of two stages of the study, we presented every subject with 40 rounds of play against two types of a computer player (20 rounds for each type, in random order, where subjects were always told before the trial which type of computer player they would face).
Unpredictable computer player. Subjects were told that the computer would randomly select one of the numbers with equal probability. They were told that choosing the same number as the computer would earn two points. — every point scored in the experiment was converted to a monetary payoff at a known fixed rate — but choosing a different number would earn zero points. A subtle exception to this rule occurred if a subject was assigned to play the matching-pennies game at Stage Two of the study, and rewarded for choosing a different number than the other human player (see below). In that case, the subject was also told to select a different number than the computer player at Stage One.
Predictable computer player. Subjects were told that the computer would pick the number closer to X, where X was an integer larger than one of the two numbers subject to choice but smaller than the other (and closer to one of the two numbers). For example, given a choice between 12 or 31 and X=14, the computer would select 12. The value of X varied between rounds and was disclosed just before displaying the choice screen presented in Figure 1. Subjects were told they would receive one point if they select the same number as the computer, and zero points otherwise. Once again, the exception was that subjects assigned to play the matching-pennies game at Stage Two of the study, and rewarded for choosing a different number than the other human player, were also told to select a different number than the computer player at Stage One.
Upon completion of Stage One, each subject was then asked to repeatedly play one of two strategic games with the subject she was paired with for a total of 20 rounds. In each round, both subjects would now see the same pair of two distinct two-digit numbers, placed in the same two slots/fields for both subjects (i.e., they would both face exactly the same choice, of which they were made aware).
The numbers and their positions would continue to randomly change between rounds, while ensuring that no number that has already appeared in Stage One appears during Stage Two, and that no number appears more than once. The two alternative strategic games that we considered were as follows:
Coordination Game. The subject was told that she and the counterpart would each receive two points if they independently select the same number. Otherwise, they would each receive zero points.
Matching Pennies Game. One of the subjects was told that she would receive two points if she independently selects the same number as the counterpart (and zero points otherwise). The subject was also told that the counterpart has an opposite objective and would receive two points if she independently selects a different number than the rival player (and zero points otherwise). In accordance with this, the other of the two subjects was told the exact opposite.
Our choice of games was dictated partly by the fact that they were both very simple to present visually, facilitating our eye-tracking analysis. In addition, the matching pennies game is a classic example of a competitive constant-sum game in the sense of (Schelling, 1960), one in which it is essential to conceal one’s actions from the counterpart. In contrast, in the coordination game it is essential to be as predictable as possible in order to coordinate on the mutually-beneficial outcome. Note that we require each pair of subjects to play only one of the two games, and do not alternate the roles in matching-pennies, so as to make it easier to learn the game, the strategic properties of which remain unchanged between rounds ((Grimm and Mengel, 2012) showed that taking turns to play strategically distinct games impedes convergence to the equilibrium over time).
The other feature of the Stage Two strategic task that we manipulate is the availability of information about the counterparts’ previous choices. Specifically, we consider two possibilities (experimental factor levels), with every pair of subjects playing according to one of the two throughout the entire Stage Two:
No Feedback. Every subject is told that she would only learn the counterpart’s choices (and her own and the other player’s payoffs) upon completion of the study.
Full Feedback. Each subject is told that, in every trial of the task, after she and the other player make their choices, they will each learn which number was selected by the counterpart, as well as the resulting payoffs that each of them receives (this information was displayed after the conclusion of each trial but before starting the next one and displaying the corresponding choice screen).
There were two between-group factors affecting Stage Two of the experiment: the type of strategic game and the presence of feedback, giving rise to a total of four experimental conditions: Coordination × No Feedback, Coordination × Full Feedback, Matching-Pennies × No Feedback and Matching-Pennies × Full Feedback. We assign twelve pairs of subjects to each of the four conditions, testing a total of 96 subjects of which 4 were later removed from data analysis due to poor calibration.
The experiments were computerized — our stimulus presentation software was programmed in C# using Microsoft Visual Studio Express 2015. Each of the paired subjects was seated at a separate computer terminal and both were asked not to communicate with each other. One of the computer terminals had attached underneath the screen a RED250mobile eye-tracking device, the other a RED-m device (both manufactured by SensoMotoric Instruments and set to 60Hz frequency). Immediately prior to the commencement of the study we conducted a standard five-point semi-automatic calibration and validation procedure. The average deviation was below 0.5∘ for 92 subjects, the other 4 subjects’ data was removed from the analysis.
We considered it essential to avoid asking subjects to use keyboard to make their choices. This would result in taking eyes off the screen, potentially even for the entire duration of the task (when playing an unpredictable computer player subjects could simply press one of the two choice keys at random without looking at the screen). Using the computer mouse instead would similarly result in a distortion of the recorded eye-data, since some of it would be an artefact of subjects seeking out and then following the cursor with their gaze.
In order to address these issues, we ask subjects to first decide which number they wish to select, then press any keyboard key (which they can do without taking eyes off the screen), and finally to look at their number of choice. The eye-tracking device would detect this instantly, but to prevent choices being made accidentally, the subject had to hold her gaze on the chosen number for a further two seconds before the choice was finalized. This kind of eye-control is widely used in “augmentative and alternative communication” (to enable people with disabilities to navigate their computer with their eyes), and is adapted here for our research purposes. Subjects found the protocol straightforward and intuitive, and had no difficulty using it.
For every trial/choice made by every subject, a total of 92×( 40+20) trials, we gather the eye-tracking data corresponding to the time period starting with showing the choice screen (Fig. 1), and ending with the subject finalizing her choice. For each trial, we then calculate and record the values of the following three variables.
This we calculate as the difference (in milliseconds) between the time of the subject pressing a key to signal the readiness to submit her choice (by looking at the chosen number), and the time of the choice screen being displayed.
This we define and compute as the proportion of the total time of the trial which the subject spent looking at the square field (as in Fig. 1) containing the number she did NOT subsequently choose. Note that in this case we include the time after the key has been pressed, because it takes a further two seconds since pressing it to finalize the choice (recall Section 2.3). The decision on whether to use data until pressing the key or until finalizing the choice is not important for the measurement of reaction times, because the latter option simply adds a constant to each value. However, considering the total duration of the trial for the measurement of the other two variables slightly increases the accuracy of distinguishing between the Stage One tasks, while having no effect on the sign and significance of the differences between the four experimental conditions.
Pupil dilation can serve as a measure of both cognitive workload and emotional response (see (Wang, 2011) for a review of the related literature). However, pupillary responses have so far rarely been used to study economic decisions, although there are a few notable exceptions (Wang, Spezio and Camerer, 2010; Glöckner et al., 2012; Fiedler, Glöckner and Nicklisch, 2012; Franco-Watkins and Johnson, 2011). A significant difficulty associated with this kind of analysis is that pupil dilation varies periodically in response to changes in the intensity of light that falls on the retinal ganglion cells of the eye, creating undesirable noise in the signal. We solve this issue using the procedure introduced in (Marshall, 2007). Specifically, we conduct a discrete wavelet transform of the pupil dilation (measured in mm) time series using a Daubechies wavelet. The coefficient outputs of the wavelet decomposition are subsequently submitted to a unit threshold to remove noise. The remaining high frequency details are then extracted from the convolution and inverse wavelet transform used to construct a residual time series. This gives the sudden unexpected changes (deviations) in pupil dilation that cannot be explained by adjustments to changes in lumination, and are therefore indicative of cognitive or emotional activity. We record the maximum value of the residual during each trial, again including the time after pressing the key.
We investigate if it is possible to predict, based on the values of reaction time, gaze dispersion and pupil deviation corresponding to an individual trial, whether that single trial is of “predictable” or “unpredictable” type.
To this end, we collect each subject’s data corresponding to the 40 instances of Stage One trials. Of these, we drop the (chronologically) first 5 instances of both the predictable and unpredictable type, because the subjects need to learn the general structure of the problem at hand before the data becomes representative of the underlying cognitive processes.
We then conduct within-subject standardization of the remaining data (using the mean and standard deviation of each subject’s remaining 30 trials). This removes between-subject differences not related to the specific task types. As a result, it becomes feasible to train and validate a classification model based on data from all 92 subjects, instead of having 92 individual models. We find the former preferable, as it will allow us to extract the overall features of the entire tested population, as well as providing the classification model with more training and validation data.
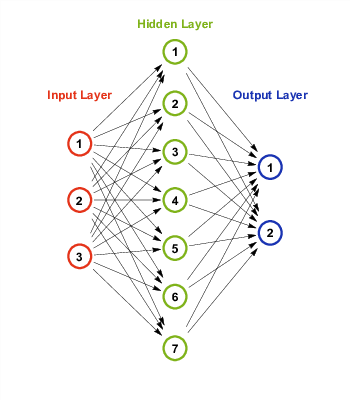
We analyze the data using a neural network classifier with one input layer of three nodes (one for each variable), one hidden layer of seven nodes and one output layer of two nodes (one for each class: predictable vs. unpredictable). The structure of the resulting “multi-layered perceptron” is illustrated in Figure 2. Using a single hidden layer is standard practice and the most common neural network architecture across various fields of research; it has been demonstrated that any continuous function can be represented by a neural network that has only one hidden layer with exactly 2n + 1 nodes, where n is the number of input nodes (see Stathakis, 2009 for more detail). We use a rectified linear hidden layer activation function instead of the logistic sigmoid function in order to improve training time and performance of the network (Nair and Hinton, 2010).
In addition, to prevent overfitting and allow the model to generalize to the Stage Two strategic tasks in rounds 41–60, we conduct K-fold repeated cross-validation with R=5 runs and K=2 folds in the following manner.
First, we randomly split the data (30×92 trials) in half, the first of these K=2 subsamples used to train the neural network, and the second one used for testing. In addition, a fifth of the training data is set aside for validation purposes. In the process of training, each case in the training data is presented to the model, and the weights of the neural network are adjusted to fit the (known) true classes of the training cases (predictable vs. unpredictable). Once all cases have been presented, the average error between the true classes and the ones predicted by the network is calculated for the training and validation data. The entire process is repeated until the validation error starts to increase (despite continuing to decrease for the training data), indicating that overfitting begins to occur. Note that we use L2 regularization, which is a technique that reduces overfitting by adding a fraction of the sum of the squared weights to the error term.
After that, the accuracy of the trained neural network is evaluated on previously unseen testing data (the other of the two subsamples). More specifically, we compute the fraction of trials in the testing data that were correctly classified as predictable or unpredictable by the trained network.
To complete the cross-validation, we repeat the whole procedure, but this time use the first of the two subsamples for testing and the second one for training and validation. In addition, we re-run the entire cross validation R=5 times, each time randomly re-partitioning the data into the K=2 subsamples.
We report the overall average cross-validated accuracy of the classification algorithm. We evaluate it both against the chance level and against the accuracy achieved by the canonical logistic regression model with the same independent variables and subject to an identical cross-validation process (including an identical partitioning of the data). We use the 5-by-2 repeated cross-validation test (Dietterich, 1998) to assess the statistical significance of the latter comparison.
We also wish to explore the possibility that aggregating data over time may reduce noise and improve accuracy. To this end, we proceed in the same way as described above, except that instead of treating each subject’s 30 trials, 15 for each kind of task, as 30 separate data points, we take the average values of reaction time, gaze dispersion and pupil deviation over the 15 trials of each type, turning them into a single, averaged, data point. Thus, we obtain a pair of data points for each subject: one representing the subject’s average profile during the predictable task, the other corresponding to the unpredictable task.
Using the resulting, reduced dataset of 92×2 cases, we carry out the same K-fold cross validation procedure (of the same neural network model) that was described and conducted for single-trial classification above. Once again, we report the overall average cross-validated accuracy of classification, comparing it against the chance level and against the accuracy of the logistic regression model.
For each of the 92 subjects we proceed as follows. We collect the subject’s data (reaction time, gaze dispersion and pupil deviation) corresponding to the first 40 trials of the study, drop the first 5 instances of both the predictable and unpredictable tasks, and perform within-subject standardization. In case of multi-trial classification, each subject’s data for each type of task is additionally averaged. Thus, for both single- and multi-trial classification we use the same data as in Section 2.4.2.
The difference is that we now use the entire Stage One data (rather than just one fold amounting to half of it) for the purpose of training and validation of the neural network. This is to maximize the accuracy of the trained model when dealing with the unseen Stage Two data.
As with both Stage One tasks, the first 5 trials of the Stage Two strategic task are dropped, and the rest of the data standardized using the same mean and standard deviation as the training and validation data. In case of the multi-trial classifier, the data from the remaining 15 trials of the Stage Two task is averaged to constitute a single data point for each subject. The trained neural network then predicts whether each data point in the testing data (trials 46−60) is an instance of the predictable or unpredictable class.2 Specifically, for each subject we compute the overall average proportion of Stage Two task data points classified as predictable rather than unpredictable. We will refer to this proportion as “similarity to predictable task”. Note that, in the Coordination × Full Feedback and Matching-Pennies × Full Feedback conditions, we further average the proportions for each pair of matched subjects. This is because, playing against each other, each pair of subjects then constitutes an independent observation for the purpose of statistical analysis.
We compare the values of similarity to predictable task between the conditions, using non-parametric two-tailed Mann-Whitney tests to assess significance, and report the test statistic and p-value for each comparison. We do this separately for each of the two classifiers (single- and multi-trial).
To indicate how our three variables may be used to classify trials, we compared the average value of each variable for every subject, separately for the 20 Stage One trials of each type (thus obtaining 3×92 matched pairs of values), and the resulting median value of each set of 92 averages. To this end, we used non-parametric matched-pair Wilcoxon tests.
Thus, compared with unpredictable rival trials, during predictable trials subjects’ reaction times are longer, their gaze is more evenly distributed across the two options, and they exhibit greater unexpected increases in pupil dilation.
Based on reaction time, gaze dispersion and pupil deviation, the neural network model can predict whether a single Stage One trial is played against a predictable or unpredictable computer player with an accuracy of 0.67. This value is significantly above chance level (binomial test p-value <0.001), and is also significantly higher than the 0.65 accuracy achieved by the logistic regression model (5-by-2 paired t(5)=3.80,p=0.012).
Based on the average reaction time, gaze dispersion and pupil deviation from all Stage One trials of the same type of task by the same subject, the neural network model can predict whether those trials are played against a predictable or unpredictable computer player with an accuracy of 90%. This value is significantly above chance level (binomial test p-value <0.001), and is significantly higher than the 0.88 accuracy achieved by the logistic regression model (5-by-2 paired t(5)=3.94,p=0.011).
We begin by comparing the four experimental conditions separately in terms of each of our independent variables: reaction time, gaze dispersion and pupil deviation. For each variable, we report all four pairwise comparisons between the conditions and the associated Mann-Whitney test results. In each case, we evaluate the statistical significance of the four comparisons using the step-wise Bonferroni-Holm correction (where the successive p−values, in descending order, are evaluated against respective α−thresholds of 0.05,0.025,0.017 and 0.0125).
Thus, we see that pupil deviation is generally higher under full feedback than under no feedback, while gaze dispersion is higher in the matching-pennies game than in the coordination game. In addition, under full feedback both reaction time and pupil deviation are almost significantly higher in matching pennies than in the coordination game.
In other words, giving subjects access to feedback at Stage Two has a similar effect on pupil deviation as giving them information about how the computer player would make its choice at Stage One. It may be that sudden increases in pupil dilation can be a sign of an “Aha! moment”, i.e., of a subject realizing that she has arrived at the correct answer to the problem, something that is only possible if enough information is available.
As for the gaze dispersion, in this respect the matching-pennies game is more similar to the predictable task than the coordination game. This could reflect the fact that in matching pennies more effort is put into comparing the two numbers subject to choice. In contrast, in the coordination game, without feedback, people might tend to choose the first option that catches the eye, hoping that the counterpart will do the same. Even when feedback is given, subjects might quickly determine the rule based on which the counterpart makes her choice, reducing the number of eye transitions between the numbers.
More generally, it appears that different predictor variables are best at discriminating between different experimental factors (the presence of feedback and type of strategic game). Thus, it is interesting to see if combining all three variables in a neural network algorithm will result in being able to better discriminate between all four factor combinations in terms of their similarity to the Stage One tasks. Specifically, we consider the proportion of Stage Two trials classified as instances of playing against a predictable opponent (“similarity to predictable task”). We report all pairwise comparisons between the conditions and the associated Mann-Whitney test results, separately for single- and multi-trial classification.
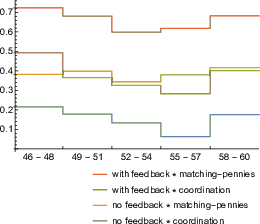
The four differences are jointly significant based on the step-wise Bonferroni-Holm correction. In addition, as seen in Figure 3, the above relationships between conditions are stable over time.
As in the case of the single-trial classifier, the four reported differences are jointly significant based on the Bonferroni-Holm correction. Thus, irrespective of whether we use single-trial or multi-trial classification, and other things being equal, similarity to predictable task is significantly larger under full feedback than under no feedback, and significantly larger in the matching-pennies game than in the coordination game.
We also report the results of two Mann-Whitney tests performed on behavioral data, which will be useful in the interpretation of the eye-tracking findings in the following section.
A crucial result for the purpose of evaluating the method proposed in this paper is that it is indeed possible to predict the Stage One task a person attempted in a given trial based on the associated values of the independent variables. Recall that the only difference between the two tasks is the information about the behavior of the computer player. Thus, eye-tracking data can potentially discriminate between two scenarios: 1) where the human player is unsure of the counterpart’s behavior, and therefore also of her own optimal strategy; 2) where the human player is able to work out the action that the counterpart is likely to take, and to choose her own strategy accordingly.
To justify the above statement, let us compare the obtained single- and multi-trial classification accuracy rates to those reported by related existing studies. In particular, Marshall (2007) considered a similar problem of neural network discrimination, based on eye-tracking data, between an arithmetic problem-solving task and a doing-nothing task. When using data from four-second time intervals (longer than the median duration of both of our tasks, equal to 1.72 and 2.86 sec. respectively), and combining data from different subjects to build a general model (as we do here), the obtained classification accuracy rate was 70%. For one-second time intervals (slightly shorter than the duration of our tasks) the figure was 65%. When comparing this with our (similar) figure of 67% in the single-trial model, one needs to note that the current classification problem was considerably harder, since both tasks entailed a visually identical problem of choosing between two numbers and differed only in terms of the information about the computer player behavior. In this sense, the current problem bears more resemblance to the more recent study by Borji and Itti (2014), who distinguished between different information extraction tasks performed while looking at the same picture, and obtained an accuracy rate approximately 10% above chance.
Similarly, the 90% accuracy of our multi-trial classifier is comparable to the top accuracy rates reported by existing papers dealing with analogous problems of classifying subjects’ overall performance in a study. For example, Richstone et al. (2010) use neural networks in a way similar to the present study to classify surgeons into expert and non-expert cohorts based on their eye-data gathered during simulated and live surgical environments. They too report classification accuracy rates of around 90%, albeit obtained in a small and highly unbalanced sample.
In summary, we consider the performance of both single- and multi-trial classification algorithms to be satisfactory.
The first part of our contribution is therefore to show that eye-tracking data can be used to discriminate between strategic decision tasks that differ only in terms of the information about the counterpart’s behavior that players are provided with. The second part of the contribution is to demonstrate, through results reported in Section 3.2, how the results of such analysis may in turn be used to investigate the effect of various external factors on players’ expectations and decision-making processes when playing against another human player. Specifically, in our example we focus on changes in the payoff structure of the game and the availability of feedback about the counterpart’s past actions. We establish how these factors affect the similarity of subjects’ stage-two play, in terms of the concurrent eye-tracking data, to their stage-one involvement against predictable vs. unpredictable computer players.
On the one hand, the proposed method may be related to the previously mentioned existing studies that classify subjects into groups (types) based on their recorded gaze or lookup patterns. The types can be either defined a priori, as in Costa-Gomes and Crawford (2006), or cluster analysis can be performed, as in Polonio, Di Guida and Coricelli (2015), and the obtained clusters can then be associated with different types (e.g., the level-2 type in the cognitive hierarchy typology of Camerer, Ho and Chong, 2004) based on their characteristics.
On the other hand, the difference from these studies is that here the types are not derived from existing models, but defined indirectly via similarity to the visual processing of other, related tasks by many different subjects, established by virtue of machine learning pattern recognition analysis of their eye-data. Thus, the present approach is more model-free in this sense, and of more practical use in some circumstances, specifically when it is difficult to specify the eye-movement patterns that would distinguish one mode of decision-making from others. In the context of the present example, we could characterize the underlying rationale as: “We do not know what patterns in the eye-tracking data would reflect predicting the strategic action of the other human player. However, we do expect that these patterns should be more similar to ones accompanying play against a predictable computer player, than to ones accompanying play against a computer player choosing its actions at random.”
At this point, it should be stressed that we do not see the proposed method as a replacement for scan-path analysis, but rather as an approach that might incorporate it (and many other techniques). For instance, suppose we used tasks with more than two AOIs, allowing for potentially meaningful complex scanpaths. One could then use a machine learning algorithm appropriate for sequential scan-path data (e.g., a hidden Markov model) to classify a scanpath recorded in a given Stage Two trial as similar to playing against a predictable or unpredictable computer player at Stage One. The reason why we used simple tasks, and only three predictor variables, was mainly to demonstrate the first use of the method in a relatively straightforward context.
We should also consider the potential susceptibility of the proposed approach to p-hacking, specifically, to manipulating the set of predictors and data analysis techniques until desired results are obtained. In particular, a useful feature of our method is that the accuracy of distinguishing between the different types of proxy choice trials (at Stage One) can serve as a relatively objective standard by which alternative ways of analyzing the data can be compared and the optimal one selected and motivated. In our relatively simple case of short tasks with two AOIs, the set of possible predictors is quite narrow and the differences between Stage Two tasks are clear-cut and intuitive (as further discussed below). Hence, we restricted to comparing the accuracy of a neural network and a canonical logistic regression. However, in more nuanced situations researchers can use the proxy tasks to compare a wider range of predictors and techniques before choosing the combination to use for analyzing the original tasks. While the specification of the proxy tasks themselves is still a relatively arbitrary aspect of the design, it has to be done prior to collecting the data, thereby leaving less room for manipulation. In contrast, the traditional approach of a priori specifying the eye patterns that should occur if a given model was accurate leaves plenty of space for hypothesizing after the results are known (“HARKing”).
At the same time, a caveat associated with the proposed method is that one should be careful when interpreting the results, and not forget that subjects’ thought processes are not elicited directly. To illustrate, in our example we found that similarity to predictable task is higher in the matching-pennies game than in the coordination game, even though the former is a classic example of a ‘competitive’ constant-sum game in the sense of Schelling (1960), in which it is essential to conceal one’s actions from the counterpart (consistent with this, its only Nash Equilibrium is in mixed-strategies). In contrast, in the coordination game it is essential to be as predictable as possible.
The observed tendency could therefore be seen as evidence against the classic interpretation of the mixed-strategy Nash Equilibrium (MSE) concept due to von Neumann and Morgenstern, according to which in competitive games with unique MSE players use randomization to prevent rivals from predicting their actions. Here, we see that subjects play the matching-pennies game as if they were up against a highly predictable computer player.
Nevertheless, to underline the point about the need for careful interpretation, one could counterargue that what is really captured by “similarity to predictable task” is the overall complexity of the task. Thus, matching-pennies resembles playing a predictable computer player merely because both involve a higher degree of working out the correct solution compared with the coordination game and playing an unpredictable computer player respectively. This illustrates the need for a careful design of the proxy (Stage One) tasks on which the machine-learning classifier is to train itself, so that, if possible, they do not differ in aspects other than the one subject to investigation.
In the present case, the interpretation of the results can be clarified by examining the impact of the other factor, namely the availability of feedback, which we find to increase similarity to predictable task. If the observed differences were merely due to changes in task complexity, then they should diminish over time, particularly when feedback is available, allowing subjects to better learn the task. However, we see from Figure 3 that the differences in similarity to predictable task across all four conditions remain stable over the course of Stage Two of the experiment.
What is more, the first of our behavioral results in Section 3.2.3 is robust to restricting to trials closer to the end of the study. Thus, it appears that in the matching-pennies game subjects persist in believing that they can use past feedback to predict the rival’s present choices. This happens even as they find themselves to be repeatedly unsuccessful in this endeavor (the margin between the winning and losing player is 5%, the same as in the absence of feedback). It appears that each subject thinks she can predict and outsmart the other by using the feedback information, but ultimately they cancel each other out and end up in the same situation as in the absence of feedback. This is particularly interesting, given that the two numbers subject to choice change randomly (and are re-positioned) in each round, whilst no number appears more than once. This suggests that people will attempt to make use of even very limited feedback information, and persist in doing so even as they repeatedly fail to make the right strategic choices as a result.
Similarity to predictable task also increases with feedback in the coordination game. In contrast with matching-pennies, in this case the apparent increase in predictability or confidence is justified by observable outcomes of the game. Specifically, the coordination rate is at randomness level (50%)) in the absence of feedback, but significantly higher (60%) when feedback becomes available.
These findings can also add to the debate on the discrepancy between the behavior of amateur subjects in the lab and that of professionals in the field. It appears that the former do not exhibit the serial independence of actions in repeated play, which is a prerequisite for MSE (James N. Brown and Rosenthal, 1990; Mookherjee and Sopher, 1994; Scroggin, 2007; Roth and Erev, 1998). In contrast, studies such as Walker and Wooders (2001), Hsu, Huang and Tang (2007), Chiappori, Levitt and Groseclose (2002) and Palacios-Huerta (2003) show that the behavior of professional players in the field, such as penalty-kick takers in soccer, can be consistent with the MSE, though the same players no longer exhibit serial independence when tested in a lab setting (Wooders, 2010; Levitt, List and Reiley, 2010).
Our results suggest that the specific aspect of laboratory testing which might be causing this change is the fact that feedback about the counterpart’s past actions is readily available to both parties (in contrast, a soccer player in the field may for instance find it hard to recall the specific part of her penalty-kick history which could have been observed by the rival keeper). Even though information about past actions that we provide is limited by between-trial variation in available choices, it still turns out to have a significant effect on the players’ processing of the task. In fact, from our comparison of the coordination and matching-pennies games, it seems that the fact that subjects do not share a common interest, and only a mixed-strategy equilibrium exists, makes them not less, but more likely to try to use any information they have to predict a rival’s likely strategy, and possibly play a best-response to it rather than randomize. In the words of Rubinstein (1991), “We prefer to be able to point to a reason for each action we take. Outside of Las Vegas we do not spin roulettes.”
This paper demonstrated a new way of using eye-tracking to study strategic decisions. The behavior observed in experiments can often be explained by different modes of decision making. Although eye-tracking often provides an answer to the problem, existing studies often rely on an a priori specification of the eye-movement patterns that should accompany a given decision-making strategy, in order to compare the observed and assumed patterns. Such an a priori specification is usually difficult and not based on objective criteria, while the assumed patterns do not allow for individual differences between decision-makers or for the often difficult to anticipate visual attention biases.
To address these problems, we propose to expose subjects to variants of the investigated strategic task that should induce a particular manner of processing, and then check if the original and modified tasks are similar in terms of the accompanying process-tracing data. To measure the similarity of tasks, we propose to analyze the eye-data using model-free machine-learning pattern recognition techniques like neural networks. This flexible approach can capture any unforeseen relationships in the data, while requiring less theorizing on behalf of the researcher.
We present an example application of the method. Subjects first interact with a predictable or unpredictable computer player, before playing a strategic game against another human. We manipulate the features of the latter task to see how they affect the similarity of the accompanying process-tracing data to that accompanying play against a predictable vs. unpredictable computer player. Our findings have implications for the interpretation of the mixed-strategy Nash Equilibrium concept, and indicate that the method may be applied to other similar problems.
This file was generated by bibtex2html 1.98.
This work was supported by the Polish Ministry of Science and Higher Education under grant BST/WROC/2016/A/6.
Copyright: © 2017. The authors license this article under the terms of the Creative Commons Attribution 3.0 License.
This document was translated from LATEX by HEVEA.