Judgment and Decision Making, Vol. 13, No. 1, January 2018, pp. 73-78
A new test of the risk-reward heuristicWilliam J. Skylark* Sidharth Prabhu-Naik* |
Risk and reward are negatively correlated in a wide variety of
environments, and in many cases this trade off approximates a fair
bet. Pleskac and Hertwig (2014) recently proposed that people have
internalized this relationship and use it as the basis for
probability estimation and subsequent choice under conditions of
uncertainty. Specifically, they showed that risky options with
high-value outcomes are inferred to have lower probability than
options offering a less valuable reward. We report two experiments
that test a simple corollary of this idea. In both studies,
participants estimated the magnitude of prizes offered by lotteries
with known win-probabilities. The relationship between estimates and
probabilities followed the power relationship predicted by the
risk-reward heuristic, albeit with a tendency to overestimate
outcome magnitude. In addition, people’s estimates predicted their
willingness to take the gamble. Our results provide further evidence
that people have internalized the ecological relationship between
risk and reward in financial lotteries, and we suggest that this
relationship exerts a wide-ranging influence on decision-making.
Keywords: risk, reward, judgment, choice.
1 Introduction
In a recent paper, Pleskac and Hertwig (2014) examined the
relationship between probability and payoff in a range of natural
environments, including roulette, horse-race betting, life insurance,
dairy farming, and academic publishing. In all cases, there was a
consistent negative association between probability and reward. For
example, journals with a higher impact factor have a lower acceptance
rate, and bull semen samples that are expected to produce
greater increases in farm profitability are less likely to successfully fertilize the
female.
Pleskac and Hertwig argued that this negative relationship arises
because real-world lotteries tend towards a fair bet, such that a
gamble which costs L to play and offers a prize of G will have
win-probability P = L/G.1 This
can happen for a number of reasons. For example, in a market for
gambles, sellers wish to offer low rewards with low probabilities,
whereas buyers seek high rewards with high probabilities, driving the
offered gambles towards an equilibrium in which the expected returns
are equal to the stake. This is exemplified by roulette, where the
payouts perfectly track the probabilities such that the expected net
return (in the European version) is always a loss of 2.7% of the
stake – a value very close to the fair-bet payout, with just a small
shift in the house’s favour to keep the casino in business.
Pleskac and Hertwig (2014) further argued that people have extracted
this environmental contingency and use it as the basis for judgment
and choice. Specifically, they posited the risk-reward heuristic: when
the probability of winning is unknown, infer that it is equal to
L/G. They tested this in two studies. First, they offered lab
participants the opportunity to play a lottery for real money;
participants were told that the lottery cost $2 to play and that the
prize was $2.50, $4, $10, or $20 (varied
between-participants). Participants were confronted with an envelope
and a bingo basket containing 100 balls and told that the envelope
contained a number from 1–100 that determined their probability of
winning. After finding out the number in the envelope, they would draw
a ball and, if its number was equal to or less than the number in the
envelope, they would win. Prior to opening the
envelope, participants had to estimate the number of
winning balls and decide whether to play. Study 2 was similar but conducted on-line using a
hypothetical gamble and a wider range of prizes.
The results of both studies are replotted in Figure 1. In both cases,
the estimated probability of winning clearly decreases as the size of
the prize increases. The bottom panels show the results on a
log-log plot and demonstrate that the judgments follow the functional
form predicted by the risk-reward heuristic, but that there is a
regressive effect: people overestimated small probabilities and underestimated large probabilities (e.g., Erev, Wallsten
& Budescu, 1994). In other words, the data potentially support an
error-prone application of the heuristic, which nonetheless strongly
anchors participants’ probability estimates.
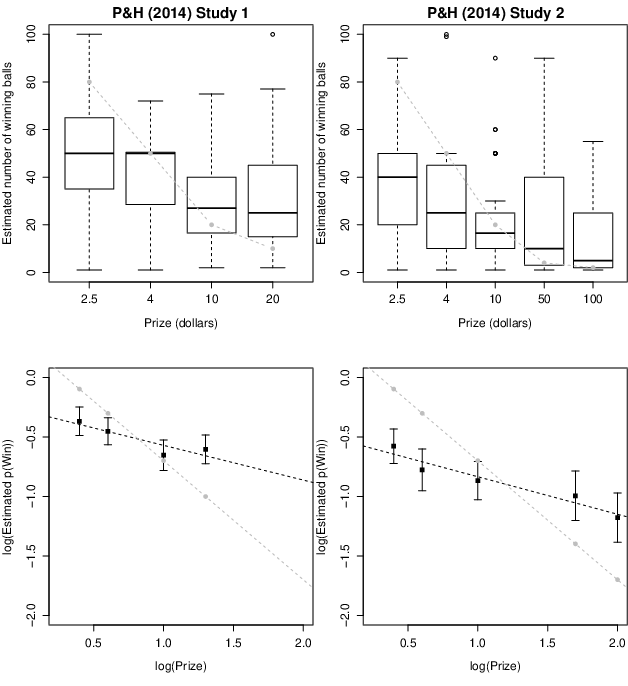
| Figure 1: Results of Studies 1 and 2 from Pleskac & Hertwig
(2014). The top panels show the distribution of estimated
probability values for each prize condition. The grey dashed line
indicates the predictions of the risk-reward heuristic. The bottom
panels show the mean of the log-transformed estimates against the
log-transformed prize values; the black dashed line shows the
best-fitting linear function and the grey dashed line shows the
predictions of the risk-reward heuristic. Error bars indicate 95%
confidence intervals. |
These estimates also predicted choice behaviour. At the aggregate
level, participants in the high-outcome conditions (where the mean
probability estimates were above what would be expected for a fair
bet) were more willing to play the lottery than were those in the
low-outcome conditions (where estimated probabilities were smaller
than expected from a fair bet). At the individual level, regression
analysis showed that both outcome value and estimated probability
predicted the decision to play. However, the risk-reward heuristic is
agnostic about the decision rule or process by which probability
estimates shape choice. For example, the estimates may provide the
basis for the calculation (and maximization) of expected value or
expected utility (Savage, 1954), the computations of Prospect Theory
(Kahneman & Tversky, 1979), or a process heuristic like elimination by
aspects (Tversky, 1969).
We report two experiments that test a simple extension of the
risk-reward heuristic: namely, that people use probabilities to infer
rewards. Specifically, we test whether a person offered the chance to
pay L to play a lottery that offers P chance of winning G will
infer that G = L/P, and whether this inference predicts their
decision about whether or not to play. This would be a logical
consequence of the relation proposed by Pleskac and Hertwig (2014),
but human estimates and choices routinely show asymmetries and task
dependencies which mean this may not be observed in practice (e.g.,
Holyoak & Mah, 1982; Lichentstein & Slovic, 1971). The numerous
differences in the ways that probabilities and monetary values are
experienced, represented, and processed means that the principles by
which people estimate rewards from probabilities need not be the same
as those by which they estimate probabilities from rewards. Correspondingly,
our experiments provide a straightforward but important test of the
idea that people are sensitive to the ecological risk-reward
trade-off. We note from the outset that gambles with explicit
probabilities but uncertain outcomes are less common than those for
which outcomes are explicit but probabilities are unknown (decisions
under ambiguity). However, we believe that the impact of probability
values on inferences about outcome magnitude nonetheless have
implications for many risky choices, as we discuss below.
2 Method
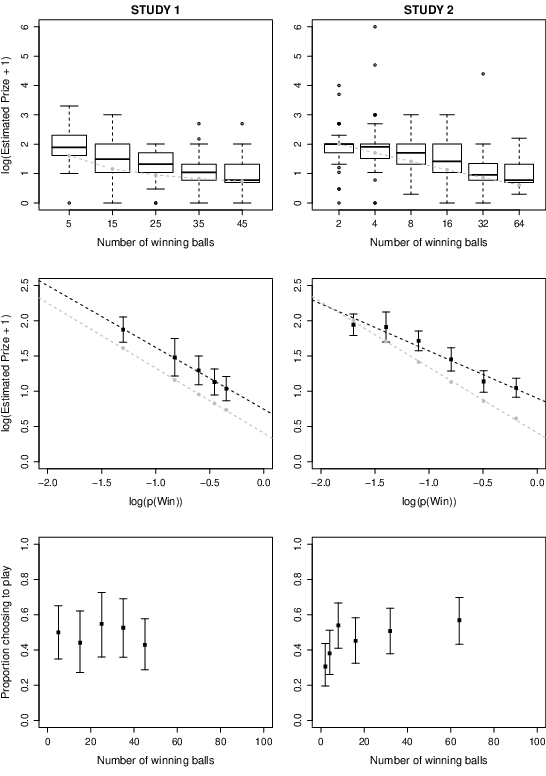
| Figure 2: Results of Studies 1 and 2. The top panels show the distribution of estimated prize values for each probability condition. The grey dashed line indicates the predictions of the risk-reward heuristic. The middle panels show the mean of the log-transformed estimates against the log-transformed probabilities; the black dashed line shows the best-fitting linear function and the grey dashed line shows the predictions of the risk-reward heuristic. The bottom panels show the proportion of participants in each condition who chose to play the gamble. Error bars indicate 95% confidence intervals. |
Both experiments were modelled closely on Pleskac and Hertwig’s (2014)
Study 2. Participants were told about a hypothetical lottery which
costs $2 to play and which offers a prize with a probability that was
varied between participants. Participants had to estimate the prize
and then state whether they would choose to play. Our Study 2 was a
replication and extension of Study 1, using a larger sample, a wider
range of probabilities, more stringent checks for attentiveness, and a
clearer statement of the choice that participants were asked to
consider. Given the similarity between the two experiments, we report
them together.
2.1 Participants
Like Pleskac and Hertwig’s (2014) Study 2, both experiments were
conducted on-line using participants from Amazon’s Mechanical
Turk. Eligible participants were those aged 18 or over who completed
the task and whose ip address had not previously occurred earlier in
the data file, and who indicated that they had not previously
attempted the task (see e.g., Matthews & Dylman, 2014). Study 1 recruited
205 eligible participants, of whom 7 failed an attention check leaving
a final sample of 198 (114 male) aged 20–61 (M=35.9,
SD=10.7). Study 2 recruited 411 eligible participants of whom 40
failed one or both attention checks, leaving a final sample of 371
(226 male) aged 18–79 (M=34.0, SD=10.3).
2.2 Design and Procedure
In Study 1, participants provided informed consent and were told that
they would be asked to consider a simple financial decision which,
although hypothetical, they should consider carefully and answer as
honestly and accurately as they can. They then read the following
instructions, which are closely modelled on those used by Pleskac and
Hertwig (2014):
Imagine you have been asked to play the following lottery. The lottery
offers the opportunity to win a monetary prize but it costs you $2 to
play. If you choose to play you would pay the $2 and, without
looking, draw a ball from a basket. In the basket there are 100
balls. The balls are either black or red. If the ball is red you will
win the prize; otherwise, if the ball is black you will receive
nothing. Thus, the number of red balls in the basket determines the
probability that you will win. Given that the number of red balls in
the basket is [5, 15, 25, 35, 45], how much do you estimate the prize
to be?"
After entering their judgment, participants progressed to a page which
asked: “Given the opportunity, would you pay $2 to play the gamble
for your estimated prize money?” and selected "yes" or "no".
There followed an attention check question, which asked the colour of
the winning balls (Red, Blue, Green, Yellow, or "I don’t know"),
followed by a question probing past-participation and demographic
information.
Study 2 was very similar, except for 3 changes. First, a wider range
of probabilities was used (2, 4, 8, 16, 32, and 64 winning
balls). Second, the choice task was modified so as to remind
participants of the probability of winning and of their estimate of
the prize, as follows: “Suppose that your estimate of the prize money
is correct. That is, there are 100 balls in the basket, of which [2,
4, 8, 16, 32, 64] are red. If you draw a red ball, you win
$[participant’s estimate of prize]. Would you pay $2 to play this
lottery?” Third, an additional attention-check was added, which asked
how many winning balls are in the basket.
3 Results
3.1 Prize estimates
As one would expect for judgments of financial value, participants’
estimates were positively skewed; we therefore applied a logarithmic
transformation (log10(x + 1)), after which the data were
approximately normal within each condition. The top panels of Figure 2
show the data for each condition. As can be seen in the figure,
participants’ estimates of the prize decreased as the probability of
winning increased. The sensitivity of prize estimates to probability
was confirmed by a one-way ANOVA for both Experiment 1,
F(4, 193) = 13.00, p <.001, η2 = .212, and for Experiment 2,
F(5, 365) = 22.22, p < .001, η2 = .233. The pattern is
clearer in the middle panels of Figure 2, which show the data on a
log-log plot along with the best fitting line and the linear function
predicted by the risk-reward heuristic. The data match the functional
form of the risk-reward heuristic, although in both studies
participants consistently overestimated the size of the reward
relative to that expected from a fair bet; in Study 2, this tendency
becomes more pronounced as the probability of winning increases,
echoing the regressive effect reported by Pleskac and Hertwig (2014)
(see also Matthews & Stewart, 2009). The complementary regressive
effects found here (where participants estimated rewards from stated
probabilities) and in Pleskac and Hertwig (where people estimated
probabilities from stated rewards) is reminiscent of work by Erev et
al (1994), who showed that noise in the construction of subjective
confidence leads to two complementary regressive tendencies: apparent
overconfidence when one plots percentage-correct against subjective
confidence categories but apparent underconfidence when one plots mean
subjective probabilities against objective probability
categories.2
3.2 Choice task
The proportion of participants who chose to play the lottery is
plotted in the bottom panels of Figure 2. To test
the effects of probability and estimated prize money on the
willingness to play, we fit a series of logistic regression models and
used likelihood ratio tests to compare them. The Null model included
only an intercept; the Probability model included an intercept and the
number of winning balls, coded as a categorical predictor (rather than
positing a particular functional form for the effect); the Prize model
included the intercept and the log-transformed estimates of the prize
money; and the Full model included an intercept and both predictors.
For Study 1, the willingness to gamble was positively related to
participants’ estimates of the prize money: the Prize model was
superior to the Null model, χ2(1) = 14.98, p<.001,
Bprize = 0.843, CI95% = [0.407, 1.310], and the Full model
was better than the Probability model, χ2(1) = 18.23, p <.001,
Bprize = 1.076, CI95% = [0.565, 1.633]. In contrast, the
Probability model was no improvement over the Null model,
χ2(4) = 1.69, p = .793, and the Full model was no better than
the Prize model, χ2(4) = 4.93, p = .294. In short, choices
were predicted by participants’ estimates of the prize money but not
by the probability of winning. As an additional exploration, we re-ran
the analyses using the logarithm of the number of winning balls,
log10(n), as a continuous predictor, in place of the categorical
condition predictor. The pattern of the results was unchanged: there
was a strong effect of the estimated prize, Bprize = 1.071,
CI95% = [0.562, 1.626], p <.001, but little effect of the
number of winning balls, Bnwin =
0.846,CI95% = [−0.074, 1.804], p = .076.
For Study 2, the willingness to gamble was again positively related to
the estimated prize money: the Prize model was superior to the Null
model χ2(1) = 15.59, p <.001, Bprize = 0.603,
CI95% = [0.296, 0.928], and the Full model was better than the
Probability model χ2(1) = 41.11, p <.001, Bprize = 1.295,
CI95% = [0.859, 1.769]. However, unlike Study 1 there was also
an effect of the win-probability: the Probability model was superior
to the Null model, χ2(5) = 12.65, p <.027, and the Full model
was better than the Prize model, χ2(5) = 38.17, p
<.001. Again, using the log-transformed number of winning balls as a
continuous predictor revealed the same pattern: Bprize = 1.299,
CI95% = [0.868, 1.768], p <.001, Bnwin = 1.568,
CI95% = [1.030, 2.138], p < .001.
3.3 Potentially spurious responses
A total of 15 participants (10 in Study 1, 5 in Study 2) estimated the
prize as $0; a further 6 (1 in Study 1, 5 in Study 2) gave very large
estimates (> $1000). Our preference is to take all responses at
face value (it is not unusual for lotteries to offer very large
prizes, or for them to be rigged such that the player cannot win
anything), but such responses might arguably be typos or indicate
failure to understand the task. Re-running all analyses without these
responses made very little difference to the plots or to the
inferential tests, except that for Study 2 the improvement of the
Probability model over the Null model was no longer significant,
χ2(5) = 10.44, p = .064; however, the Full model was still
superior to the Prize model, χ2(5) = 41.90, p <.001,
indicating that the probability of winning predicted the decision to
play, over and above the person’s estimate of the potential
reward. When the log-transformed number of winning balls was used as a
continuous predictor, the conclusions were the same: for Study 1,
Bprize = 1.031, CI95% = [0.454, 1.647], p <.001,
Bnwin = 0.755, CI95% = [−0.190, 1.736], p = .123; for
Study 2, Bprize = 1.696, CI95% = [1.194, 2.237], p <.001,
Bnwin = 1.761, CI95% = [1.185, 2.373], p < .001.
4 Discussion
Just as people judge that higher rewards will be associated with lower
probability of success (Pleskac & Hertwig, 2014), so they judge that
higher probabilities will be associated with lower rewards (our
Studies 1 and 2). In both cases, the relationship is approximately
linear on a log-log plot, consistent with the functional form
predicted by the risk-reward heuristic. To this extent, both sets of
studies support that heuristic as an account of inference about the
components of a risky prospect.
However, like Pleskac and Hertwig’s data, our results are inconsistent
with a strong (error-free) application of the heuristic. In
particular, our participants tended to overestimate the probability of
winning relative to what would be expected from a fair bet. This is
surprising when one considers that many financial lotteries are
actually designed to favour the house (for example, had our participants
internalized the risk-reward structure of casino bets, state
lotteries, or bookmakers’ odds, they would have estimated
prizes that were smaller than the risk-reward heuristic would
predict). This could be taken as an example of an optimism bias (see,
e.g., Krizan & Windschitl, 2007). However, like the regressive effect
in Pleskac & Hertwig’s data (and apparent in our Study 2), the
optimism shown by our participants may be due to noisy responding:
estimates of monetary reward are bounded at zero, so positive errors
will tend to be larger than negative ones. More generally, the fact
that probabilities are doubly-bounded (at zero and one) whereas
rewards are only lower-bounded may mean that the precise consequences
of applying the risk-reward heuristic will be different for the two
types of estimation task. In any case, our data support the idea that
the risk-reward heuristic anchors, but does not completely determine,
people’s estimates of probabilities and outcomes.
These estimates influenced choice: in both studies, participants who
expected larger rewards were more likely to take the gamble. Notably,
our studies, like those of Pleskac and Hertwig (2014), always required
participants to make their estimates prior to making their choices
(because the primary interest is in whether people apply the
risk-reward heuristic when estimating probabilities and outcomes); it
remains to be seen whether the same relationship holds when choices
precede estimation.
Researchers often focus on decisions under ambiguity, where the
probability of an outcome is not precisely known. Indeed, Pleskac and
Hertwig (2014) suggested that the risk-reward heuristic may contribute
to the widespread aversion to ambiguous options, and provided some
evidence for this possibility. Prima facie, there are fewer situations
in which precise probabilities are given for uncertain
outcomes. Although there are such scenarios (e.g., when a doctor
states that a treatment has a 50% chance of being successful without
defining "success"), a more important observation is that most real
decisions take place in complex, information-rich environments that
add considerable noise to the representation of outcomes and
probabilities. It is easy to mis-read, mis-hear, or imperfectly
process one or more components of an option, and in many situations
the elements of competing options are not simultaneously presented but
require retrieval from memory. In such situations, people use prior
knowledge and schemas to inform their perceptions and memories (e.g.,
Ghosh & Gilboa, 2014; Vincent, 2015), such that inferences about
outcomes from probabilities, just like inferences about probabilities
from outcomes, will shape the mental representation of the decision.
Thus, even when precise information about probabilities and outcomes
is ostensibly available, in practice people are likely to rely on
prior beliefs and schemas to infer elements of the decision problem,
and these inferences will shape the choice that is made. In other
words, we contend that the risk-reward heuristic is likely to be an
important, computationally-rational strategy in a wide variety of
settings.
References
Erev, I., Wallsten, T. S., & Budescu, D. V. (1994). Simultaneous over- and underconfidence: The role of error in judgment processes. Psychological Review, 101, 519–527.
Ghosh, V. E., & Gilboa, A. (2014). What is a memory schema? A historial perspective on current neuroscience literature. Neuropsychologia, 53, 104–114.
Holyoak, K. J., & Mah, W. A. (1982). Cognitive reference points in judgments of symbolic magnitude. Cognitive Psychology, 14, 328–352.
Kahneman, D. & Tversky, A. (1979). Prospect theory: An analysis of decision under risk. Econometrica, 47, 263–291.
Lichtenstein, S. & Slovic, P. (1971). Reversals of preference between bids and choices in gambling decisions. Journal of Experimental Psychology, 89, 46–55.
Matthews, W. J., & Dylman, A. S. (2014). The language of magnitude comparison. Journal of Experimental Psychology: General, 143, 510–520.
Matthews, W.J., & Stewart, N. (2009). Psychophysics and the judgment of price: Judging complex objects on a non-physical dimension elicits sequential effects like those in perceptual tasks. Judgment and Decision Making, 4, 64–81.
Pleskac, T. J., & Hertwig, R. (2014). Ecologically rational choice and the structure of the environment. Journal of Experimental Psychology: General, 143(5), 2000–2019.
Savage, L. J. (1954). The foundations of statistics. New York: Wiley.
Tversky, A. (1969). Intransitivity of preferences. Psychological Review, 76, 31–48.
Vincent, B. T. (2015). A tutorial on Bayesian models of perception. Journal of Mathematical Psychology, 66, 103–114.
This document was translated from LATEX by
HEVEA.