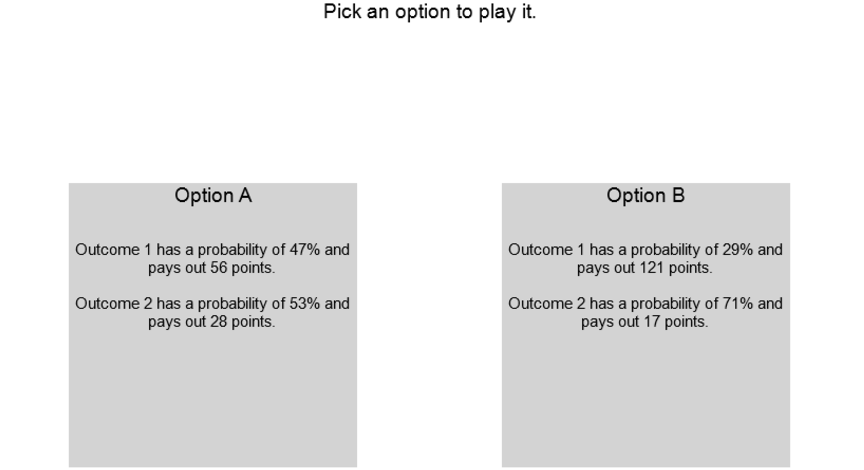
 Figure 1. Screenshot of a decisions-from-description trial. Participants
clicked on the option they wanted to play and the resulting outcome
(not shown to participants) was added to their bonus earnings.
Figure 1. Screenshot of a decisions-from-description trial. Participants
clicked on the option they wanted to play and the resulting outcome
(not shown to participants) was added to their bonus earnings.
Judgment and Decision Making, Vol. 12, No. 2, March 2017, pp. 128-139
Numeracy predicts preference consistency: Deliberative search heuristics increase choice consistency for choices from description and experienceNathaniel J. S. Ashby* |
Many people exhibit inconsistent preferences when they make choices based on descriptive summaries as compared to choices based on prior experiences. Theoretically, factors that promote more deliberative and skilled decision making (e.g., statistical numeracy) should also tend to promote more consistent choices and preferences regardless of information presentation formats. To test this hypothesis, in two studies I investigated individual differences in information search strategies (e.g., the amount and direction of information search) while estimating the degree to which numeracy predicted risky choice consistency across (a) decisions-from-description and (b) the decisions-from-samples. Results from Study 1 revealed that numeracy was generally associated with more extensive sampling and greater choice consistency across paradigms. Instead of reflecting differences in logical maximizing strategies (e.g., calculating expected values), analyses indicated that highly-numerate participants largely generated consistent choices by relying on heuristic-type processes (e.g., alternated between options less and exploring options with higher outcome variability more). In Study 2, the relationship between numeracy and choice consistency was eliminated when all participants were forced to make choices after experiencing the same fixed amount of sampling (i.e., provided the same amount of information). Taken together, the results of both studies converge with and extend previous findings (e.g., Skilled Decision Theory), indicating that numerate participants may generally exhibit more consistent preferences and choices via deliberatative heuristic search during decision making.
Keywords: numeracy, decisions-from-experience, decisions-from-description, preference consistency, risky choice
Decisions are frequently influenced by numerical information. Sometimes this information is provided as a descriptive summary (e.g., the stated return from an investment or the risk of side effects from a medication), while in other situations it is gleaned from prior experience (e.g., memory of previous returns from stock or the amount of time a particular route home took). Interestingly, risky decisions based on experience or descriptive summaries do not always align (Barron & Erev, 2003; see for review, Rakow & Newell, 2010). As a means of understanding this divergence, there has been particular interest in the way information is sought out (see for review, Erev et al., 2010; Mehlhorn et al., 2015). Research suggests that the amount of information collected, and to some extent the way it is used, is influenced by cognitive and numeric abilities (Ashby & Rakow, 2014; Lejarraga, 2010; Rakow, Newell & Zougkou, 2010), emotional states (Frey, Hertwig & Reiskamp, 2014), age (Frey, Mata & Hertwig, 2015), search strategy (Hills & Hertwig, 2010), and perspective (Pachur & Scheibehenne, 2012). The current work extends these findings by providing an analysis of the role numeric ability (numeracy) plays in search (exploration), and its influence on preference stability (i.e., the extent to which the same choices are made) across descriptive and experiential formats. Specifically, I test whether individuals with greater numeric ability seek out more experience before making a decision and show greater choice consistency across decisions made based on descriptive information or experience.
Numeracy tends to be the single strongest predictor of general decision making skill, including the ability to understand and evaluate risk (i.e., risk literacy; Cokely et al, in press, 2012). Statistical numeracy in particular (i.e., the ability to solve problems involving probabilistic information), has been shown to be predictive of performance in decisions based on descriptive information (decisions-from-description; Peters et al., 2006, 2012). For example, individuals with higher numeric ability are less influenced by frame (e.g., when outcomes are framed as gains or losses; Peters & Levin, 2008), make more normatively consistent decisions (Cokely & Kelley, 2009), perform better on the job (Burks, Carpenter, Goette & Rustichini, 2009), and are generally more adept at using numerical information when making decisions (Cokely et al., 2012; Garcia-Retamero & Cokely, 2017; Pachur & Galesic, 2013; Peters et al., 2012; Petrova et al., in press; Reyna, Nelson, Han & Dieckmann, 2009). In addition, there is evidence that numeracy influences how probabilities (Patalano et al., 2015; Traczyk & Fulawka, 2016) and outcomes (Schley & Peters, 2014) are treated, with numerate individuals appearing to treat them more objectively (i.e., treating 90% more like 90% rather than 90% ± some bias). Numeracy has also been found to be related to increases in the amount of information sought out in decisions-from-samples paradigms (where decision makers simulate playing available options before making a consequential choice; Lejarraga, 2010) and choosing options with higher expected value (EV; Jasper, Bhattacharya, Levin, Jones & Bossard, 2013). Given that individuals with greater statistical numeracy make more normatively consistent decisions when options are described and experienced, one might suspect that they would also show greater preference consistency across descriptive and experiential formats.
This paper tests the hypothesis that individuals with higher statistical numeracy (referred to as numeracy from here on) generally support skilled decision making by searching for more information (Cokely & Kelley, 2009; Jasper, Bhattacharya & Corser, 2017; Lejarraga, 2010), and as a result will tend to express greater consistency in choices (e.g., revealed preferences) across decisions made from description and experience. In addition, I test whether numeracy influences the rate of alternation (i.e., switching from one option to another on consecutive samples) during information search, influencing choice. Specifically, Hills and Hertwig (2010) reported that individuals who alternated less made more EV maximizing choices (i.e., choosing the option with the highest EV). Given that numerate individuals have been found to make choices that align with an EV maximization strategy, one might predict that they also alternate between options less during search.
Second, I examine whether numeracy increases sampling from riskier options (i.e., options containing outcomes that occur with smaller probabilities). Such a bias in sampling is of interest because greater sampling from riskier options is required if one wishes to see all possible outcomes they may contain.1 Furthermore, previous research indicates that one of the largest contributors to the divergence between risky choices made from experience and description (when rare events are involved) is the result of limited sampling from riskier options (Glöckner, Hilbig, Henninger & Fiedler., 2016; Hadar & Fox, 2009; Hau, Pleskac, Kiefer & Hertwig, 2008; Rakow, Demes & Newell, 2008). Therefore, in order for more numerate individuals’ choices to align across decision formats as I predict, they should draw more representative samples from the riskier option.
Lastly, given that previous studies have reported that numerate individuals are more likely to choose higher EV options in both descriptive and experiential formats in higher stakes gambles with larger EV ratios (e.g., where one option returns twice the amount of another on average; Cokely & Kelly, 2009; Jasper et al., 2013; Peters et al., 2006), I examine whether such effects are found when stakes and EV ratios are smaller. To test these predictions, I present participants with the same choices in decisions-from-description and decisions-from-samples (Hertwig, Barron, Weber & Erev, 2005) and assess their numeracy (Cokely et al., 2012).
One-hundred and eighty participants (Mage = 34.37; 41% male) were recruited from Amazon Mechanical Turk and completed the study in full: The study was run in a session along with several unrelated studies. Participants reported relatively diverse educational backgrounds: Approximately 12% of participants reported having a high-school education or GED, 28% some college, 12% a 2-year degree, 35% a 4-year degree, 9% a masters, 2% a professional degree, and 1% a doctoral degree. As an attention check participants had to click an invisible box instead of “continue” on an instruction page. Participants who failed this attention check were not allowed to take part in the study. Participants received $0.80 as well as a bonuses contingent on their choices during the task (see below). The experimental session lasted approximately 30 minutes and participants earned $3.00 on average.
Table 1: Table 1. Outcomes (O1-O2) in points and their respective probabilities (P1–P2) for the riskier (R) and safer options (S) and their expected values (EV) in Study 1. Also the difference between EVs (DEV = EVR – EVS) and the proportion of participants selecting the riskier option in the described (RD) and experiential (RE) formats in Study 1. Pluses (+) in the S2 column indicate option pairs that were included in Study 2.
Option Risky Option Safer P1R O1R P2R O2R EVR P1S O1S P2S O2S EVS DEV RD RE S2 0.25 126 0.75 8 37.5 0.54 59 0.46 34 47.5 -10 0.19 0.26 + 0.18 153 0.82 15 39.84 0.52 57 0.48 40 48.84 -9 0.16 0.20 0.25 108 0.75 2 28.5 0.55 41 0.45 31 36.5 -8 0.11 0.21 0.18 122 0.82 10 30.16 0.47 52 0.53 24 37.16 -7 0.17 0.23 0.24 115 0.76 14 38.24 0.52 50 0.48 38 44.24 -6 0.23 0.25 0.25 102 0.75 12 34.5 0.45 45 0.55 35 39.5 -5 0.19 0.25 + 0.25 104 0.75 6 30.5 0.5 44 0.5 25 34.5 -4 0.18 0.26 0.25 100 0.75 16 37 0.5 43 0.5 37 40 -3 0.18 0.36 0.2 132 0.8 8 32.8 0.55 42 0.45 26 34.8 -2 0.16 0.28 0.25 107 0.75 15 38 0.5 42 0.5 36 39 -1 0.22 0.32 0.25 124 0.75 12 40 0.5 55 0.5 25 40 0 0.30 0.32 + 0.19 119 0.81 19 38 0.5 51 0.5 23 37 1 0.29 0.40 0.27 142 0.73 5 41.99 0.47 58 0.53 24 39.98 2.01 0.27 0.35 0.29 109 0.71 9 38 0.5 42 0.5 28 35 3 0.21 0.38 0.27 133 0.73 13 45.4 0.51 61 0.49 21 41.4 4 0.31 0.42 0.25 128 0.75 11 40.25 0.49 48 0.51 23 35.25 5 0.34 0.37 + 0.29 121 0.71 17 47.16 0.47 56 0.53 28 41.16 6 0.35 0.38 0.3 117 0.7 14 44.9 0.55 46 0.45 28 37.9 7 0.36 0.47 0.26 156 0.74 10 47.96 0.46 54 0.54 28 39.96 8 0.32 0.32 0.22 157 0.78 16 47.02 0.48 51 0.52 26 38 9.02 0.37 0.42 0.3 137 0.7 17 53 0.47 61 0.53 27 42.98 10.02 0.40 0.49 +
After providing informed consent and answering demographic questions (e.g., age, gender, education, etc.) participants were presented with the adaptive version of the Berlin Numeracy Test (Cokely et al., 2012)2: This test has undergone extensive validation in large diverse and representative samples, and correlates robustly with other (longer) numerical ability, reasoning, and decision making skill inventories (e.g., Cokely et al., in press). The Berlin Numeracy Test provides an efficient means of sorting people into quartiles (normed against college educated adults from industrialized countries). In the task, participants are presented with narrative math problems that become harder (require greater numerical ability/reasoning) to solve as they are answered correctly (two to three questions are asked). Scores range from one to four with higher scores indicating greater statistical numeracy.
After taking part in unrelated tasks, participants were told that they would be making choices across several different pairs of options, and that the points (pts) they earned from these choices would be converted to a bonus payment (40 pts = $0.01). Participants were not shown the outcomes of their choices but they were added to their bonus earnings. They then made consequential choices between the fully described (see Figure 1 for a screenshot of a trial) pairs of options in Table 1 (presented in random order for each participant). Pairs consisted of a safer (less outcome variability) option paying out two modest amounts with nearly equivalent probabilities and a riskier (more outcome variability) option paying out a larger amount about a quarter of the time and a smaller amount more frequently: In half of the pairs the riskier option provided a higher EV than the safer option.
Intermixed with the target pairs were 11 pairs of options drawn from Holt and Laury (2002). These pairs were constructed to assess individual differences in risk aversion, but were employed in the current study to serve as distractors and to screen out inattentive participants (see Table A1 in the Appendix). Specifically, in one pair the safer option paid out 200 pts with certainty while the riskier option paid out 385 pts with certainty, while in another pair the safer option paid out 160 pts with certainty while the riskier option paid out 10 pts with certainty. Participants who chose the option of lower value (e.g., choosing the 10 pts over the 160 pts) in these pairs are excluded from all analyses since they were either not paying attention to the task or had not understood the task.
Following a brief personality questionnaire used as a filler task3 (Gosling, Rentfrow & Swan, 2003), participants selected between the same pairs of options in a decisions-from-samples paradigm (Hertwig et al., 2005); pairs were presented in random order for each participant. In this task participants were told that they would be presented with two options and that they would need to sample from the options (i.e., simulate playing them) in order to see what outcomes they provided before making one consequential choice (see Figure 2). Participants were free to sample from each option zero to 100 times: The upper bound of a 100 was known to participants and rarely reached. As with the choices in the decisions-from-description task the outcomes of the consequential choices in the decisions-from-samples task were not told to participants but were added to their earnings. After making their last consequential choice participants were told of their total earnings across the two tasks and thanked for their time.
Figure 2. Example of the course of a decisions-from-samples trial. Participants first explored (sampled from) the options by clicking on them to simulate plays (Panel 1), seeing the outcome of each sample for half a second (Panel 2). When ready participants indicated they wished to make their one consequential choice (Panel 3) and then selected the option they wanted to play once with consequence (Panel 4). This sequence was repeated until all option pairs were encountered.
Observations were excluded for two reasons that were established before the study was conducted. First, trials where a participant did not sample from each option at least once (658 observations across 76 participants – four participants never sampled) were removed, as were their corresponding choices in the decisions-from-description format. These exclusions are made since samples of size zero indicate a complete lack of engagement in the task. Sample sizes of zero are included in the analyses examining the number of samples drawn.4 Next, 26 participants who chose either (or both) of the dominated options (e.g., choosing 200 pts over 385 pts) in the Holt-Laury pairs were excluded (one participant chose an inferior option and never sampled). Thus, the final analysis includes 2,775 observations from 151 participants.
Participants were fairly distributed across possible numeracy scores: Numeracy scores of one (low numeracy: 36 participants, 39 including three who never sampled in any trial), two (49 participants), three (24 participants), and four (high numeracy; 42 participants) were observed.
Overall, individuals sampled a relatively small proportion of the available information (M = 12.49; CI95% [11.87, 13.12]) as is common in the decisions-from-samples paradigm (see for example studies conducted in the lab with higher pay and larger outcomes, Ashby & Rakow, 2014; Hertwig & Pleskac, 2010). The number of samples drawn across the two options ranged from zero to 200 (95% range [0, 31]; see the left panel of Figure 3). To test whether numeracy was related to the amount of information sought out the average number of samples drawn5 was regressed on numeracy. Replicating previous findings (Lejarraga, 2010), numeracy was positively related to the number of samples drawn, b = 2.09, t(152) = 1.99, p = .048, R2 = .03 (see the right panel of Figure 3 and Table A2 in the Appendix). Removing observations where each option was not sampled from at least once reduced this relationship to non-significance, p = .17. Thus, it appears that the increase in sampling that is related to numeracy in the current study is primarily driven by less numerate individuals who did not sample from each option at least once before making a decision.
Figure 3. The histogram in the left panel displays the distribution of samples drawn across both options in each trial. The scatterplot in the right panel displays the relationship between participants’ average number of samples and their numeracy score; dashed line represents the identity line.
To test whether numeracy influenced the rate of alternation (selecting different options on consecutive samples) I regressed the average rate of alternation on numeracy. As predicted, the rate of alternation was negatively related to numeracy, b = –.07, t(149) = –3.05, p = .003, R2 = .06 (Figure 4 and Table A2 in the Appendix).
Figure 4. Scatterplot showing the relationship between participants’ average alternation rate and their numeracy score. Dashed line represents the identity line.
To test whether numeracy increased the proportion of samples drawn from riskier options I created a variable indexing the proportion of total samples drawn from the riskier option for each individual and pair of options:
I then regressed the average proportion on numeracy and found a significant positive relationship, b = .02, t(149) = 3.49, p = .001, R2 = .08 (Figure 5 and Table A2 in the Appendix). As predicted, more numerate individuals explored riskier options to a greater extent than less variable options.6
Figure 5. Scatter plot displaying the relationship between the average proportion of samples a participant drew from the riskier option and their numeracy score. Dashed line represents the identity line.
To test the prediction that the choices of those with greater numeric ability would align across decision formats to a greater extent I generated a variable indicating the average rate of choice alignment across the described and experiential formats (i.e., picking the riskier option in a pair in both the decisions-from-description and decisions-from-samples tasks). I then regressed this variable on numeracy.7 As predicted, the relationship between numeric ability and the rate of choice consistency was significant, with more numerate individuals showing greater consistency across formats, b = .03, t(149) = 1.99, p = .048, R2 = .03 (see the left panel of Figure 6 and Table A2 in the Appendix).
Figure 6. Scatter plots showing participants’ average rate of choice alignment across the decisions-from-description and decisions-from-samples formats and their numeracy score in Study 1 (free sampling, left panel) and Study 2 (fixed sampling, right panel). Dashed lines represent identity lines.
In order to test whether individuals with greater numeracy selected higher EV options to a greater extent, two variables were constructed: The average rate at which a participant selected the option with a higher objective EV in the decisions-from-description format, and the average rate at which they selected the option with a higher experienced EV (i.e., the mean of the outcomes sampled from) in the decisions-from-samples format. Neither the relationship between numeracy and the rate of selecting the higher EV option in decisions-from-description (upper left panel Figure 7 and Table A2 in the Appendix), p = .85, nor in decisions-from-samples (upper right panel Figure 7 and Table A2 in the Appendix), p = .76, were significant.8
Figure 7. Scatter plots showing the relationship between participants’ average rate of selecting options with higher expected value (EV) and their numeric ability in Study 1 (Free Sampling — upper panels) and Study 2 (Fixed Sampling — lower panels). Plotted separately for choices in the decisions-from-description (left panels) and decisions-from-samples (right panels) paradigms. Dashed lines represent the identity line.
One reason numerate individuals’ preferences were more consistent across formats may be that their exploration strategies differed (i.e., increased sampling, alternating less, and drawing a larger proportion of samples from more variable options).9 For example, sampling more and drawing a greater proportion of samples from variable options should lead to objective and experienced option EVs aligning to a great extent, increasing the likelihood that the same option would be preferred across the two formats. In order to test whether the mechanism behind this increased choice consistency for numerate individuals stems from a more skillful exploration strategy I conducted a follow up study where sampling was the same for all participants. To the extent increased preference consistency in the previous study directly resulted from numeracy’s impact on exploration, the relationship between consistency and numeracy may be reduced or eliminated when sampling is equated.
One-hundred and forty-four new participants (Mage = 37.78; 50% male) were recruited from Amazon Mechanical Turk and completed the study in full. Approximately 8% of participants reported having a high-school education or GED, 33% some college, 8% a 2-year degree, 33% a 4-year degree, 14% a masters, 2% a professional degree, and 1% a doctoral degree. As in the previous study an attention check was included and those who failed were not allowed to take part in the study. Participants received $0.75 as well as a bonuses contingent on their decisions as in the previous study. The experimental session, which contained other unrelated studies, lasted approximately 30 minutes and participants earned roughly $3.00.
Three changes were made: First, participants encountered only five pairs of options, to reduce repetition (see column S2 in Table 1). Second, instead of sampling freely from the available options, participants were shown 100 samples from each option. Specifically, either the safer or riskier option (counter balanced across participants) was drawn with the outcome of each draw being shown for 300 milliseconds. Importantly, the outcomes drawn from each option aligned perfectly with the outcomes’ objective probabilities, eliminating any potential sampling error. For instance, for the first riskier option in Table 1 25 draws returned an outcome of 126 pts while 75 draws returned an outcome of 8 pts. Outcomes were dispersed randomly across draws. Lastly, the Holt-Laury pairs from Study 1 were not included.
As in the previous study the average rate of choice alignment was regressed on numeracy. Counter to the previous study there was no robust relationship between the rate of choice alignment and numeracy (right panel Figure 6 and Table A2 in the Appendix), b = .03, t(142) = 1.29, p = .19, R2 = .01.10
As in the previous study the relationship between the rate of selecting the higher EV option and numeracy was examined. As before the relationship was not significant for decisions-from-description (bottom left panel Figure 7 and Table A2 in the Appendix), b = –.01, t(142) = –.41, p = .68, R2 < .01, nor for decisions-from-samples (bottom right panel Figure 7 and Table A2 in the Appendix), b = .01, t(142) = .47, p = .64, R2 < .01.
The current studies examined whether statistical numeric ability (numeracy) influenced pre-decision search and preference consistency across described (decisions-from-description) and experiential formats (decisions-from-samples). As predicted, numerate individuals drew larger samples before making their final consequential choices. In addition, they sampled from options with higher variability more (i.e., riskier options) and alternated between options less during search. More numerate individuals also made choices that were more consistent across formats. Study 2 employed fixed sampling and failed to find greater choice consistency among participants with higher numeracy scores. Thus, the current studies provide novel evidence indicating that numeric ability influences exploration strategies, which in turn leads to greater preference consistency across decision formats. Nevertheless, decision strategies do not appear to be based on EV maximization strategies (see below). These findings further demonstrate that numeracy is an important individual difference underpinning decisions under conditions of risk and uncertainty, and provide additional insight into decision strategies that skilled decision makers employ (see discussion of Skilled Decision Theory; Cokely et al., in press; Garcia-Retamero & Cokely, in press).
One area where individual differences in numeracy could prove particularly informative is in the description-experience gap (i.e., the propensity to overweight rare events in descriptive formats while underweighting them in experiential formats; Barron & Erev, 2003; Hertwig et al., 2014). Given that numerate individuals’ choices aligned across formats in the current studies it would be interesting to see if this alignment is also found when choices are between safer (certain) and very risky options (i.e., options with extremely rare outcomes). Given that numerate individuals sampled more in general, and drew a greater proportion of their samples from riskier options, one might expect them to be more consistent between the two formats. This should be the case if limited sampling is indeed the primary driver behind the description-experience gap (Hadar & Fox, 2009; Glöckner et al., 2016; Rakow et al., 2008).
More numerate participants did not show a greater propensity to select options with higher expected value (EV). In addition, there was no evidence that more numerate individuals “played the odds” more through increased risk seeking — which may be a defensible strategy when stakes are low and differences between accepting risk or playing it safe are minimal. This indicates that the benefits of numeracy in terms of making “better” choices is not apparent in all circumstances (Peters et al., 2006). Moreover, the current results suggest that more numerate individuals might actually fare worse than their less numerate cohorts if one assumes there are “costs” of investing more time and effort while obtaining little monetary benefit in return (Lejarraga, 2010). However, to the extent that preference consistency is valuable, then these additional search costs might be viewed as reasonable (e.g., necessary in order to achieve well-considered preferences). As such, the current studies suggest there may be many opportunities for future research to map the boundary conditions that determine when and why numeric ability benefits or harms decision making under risk, broadly defined.
From a pragmatic standpoint, the current studies suggest potential ways in which choices made by those of lower numeracy might be made more consistent with their higher numeracy peers. Specifically, a growing body of work, including the results of present study, suggests that less numerate individuals explore their options less in general (Garcia-Retamero & Cokely, 2017; Hess, Visschers, Siegrist & Keller, 2011; Okan, Galesic & Garcia-Retamero, 2015). In addition, the current study highlights a novel effect whereby numerate individuals allot a greater proportion of their samples to riskier (more variable) options. As noted previously, increased sampling from options, particularly those with greater outcome variability, leads to estimates of worth that are more likely to align with their EVs. Importantly, Study 2 found that insuring all participants encountered the same amount of information diminished the effect of numeracy on choice alignment. Thus, one way to reduce differences between the decisions made by those with lower and higher numeracy is to ensure equivalency in the information encountered and encoded into memory (e.g., through transparent visual aids; Garica-Retamero & Cokely, 2013, 2017). As such, future research should continue to investigate ways that less numerate individuals can be nudged toward more efficient and deliberative information search, so that they too might become more independent and skilled decision makers (Cokely et al., 2012; in press; Baron, 1985, 2000).
Ashby, N. J., & Rakow, T. (2014). Forgetting the past: Individual differences in recency in subjective valuations from experience. Journal of Experimental Psychology: Learning, Memory, and Cognition, 40(4), 1153–1162.
Baron, J. (1985). Rationality and intelligence. Cambridge University Press.
Baron, J. (2000). Thinking and deciding. Cambridge University Press.
Barron, G., & Erev, I. (2003). Small feedback-based decisions and their limited correspondence to description-based decisions. Journal of Behavioral Decision Making, 16(3), 215–233.
Burks, S. V., Carpenter, J. P., Goette, L., & Rustichini, A. (2009). Cognitive skills affect economic preferences, strategic behavior, and job attachment. Proceedings of the National Academy of Sciences, 106(19), 7745–7750.
Cokely, E. T., Galesic, M., Schulz, E., Ghazal, S., & Garcia-Retamero, R. (2012). Measuring risk literacy: The Berlin numeracy test. Judgment and Decision Making, 7(1), 25–47.
Cokely, E. T., & Kelley, C. M. (2009). Cognitive abilities and superior decision making under risk: A protocol analysis and process model evaluation. Judgment and Decision Making, 4(1), 20-33.
Cokely, E.T., Feltz, A., Ghazal, S., Allan, J., Petrova, P., & Garcia-Retamero (in press). Decision making skill: From intelligence to numeracy and expertise. The Cambridge Handbook of Expertise and Expert Performance, 2nd Edition.
Erev, I., Ert, E., Roth, A. E., Haruvy, E., Herzog, S. M., Hau, R., ... & Lebiere, C. (2010). A choice prediction competition: Choices from experience and from description. Journal of Behavioral Decision Making, 23(1), 15–47.
Faul, F., Erdfelder, E., Lang, A. G., & Buchner, A. (2007). G* Power 3: A flexible statistical power analysis program for the social, behavioral, and biomedical sciences. Behavior research methods, 39(2), 175–191.
Frey, R., Hertwig, R., & Rieskamp, J. (2014). Fear shapes information acquisition in decisions from experience. Cognition, 132(1), 90–99.
Frey, R., Mata, R., & Hertwig, R. (2015). The role of cognitive abilities in decisions from experience: Age differences emerge as a function of choice set size. Cognition, 142, 60–80.
Garcia-Retamero, R., & Cokely, E. T. (2013). Communicating health risks with visual aids. Current Directions in Psychological Science, 22(5), 392–399.
Garcia-Retamero, R., & Cokely, E. T. (2017). Designing visual aids that promote risk literacy: A systematic review of health research and evidence-based design heuristics. Human Factors, 0018720817690634.
Gosling, S. D., Rentfrow, P. J., & Swann, W. B. (2003). A very brief measure of the Big-Five personality domains. Journal of Research in personality, 37(6), 504–528.
Glöckner, A., Hilbig, B. E., Henninger, F., & Fiedler, S. (2016). The reversed description-experience gap: Disentangling sources of presentation format effects in risky choice. Journal of Experimental Psychology: General, 145(4), 486.
Hadar, L., & Fox, C. R. (2009). Information asymmetry in decision from description versus decision from experience. Judgment and Decision Making, 4(4), 317–325.
Hau, R., Pleskac, T. J., Kiefer, J., & Hertwig, R. (2008). The description–experience gap in risky choice: The role of sample size and experienced probabilities. Journal of Behavioral Decision Making, 21(5), 493–518.
Hertwig, R., Barron, G., Weber, E. U., & Erev, I. (2004). Decisions from experience and the effect of rare events in risky choice. Psychological Science, 15(8), 534–539.
Hertwig, R., & Pleskac, T. J. (2010). Decisions from experience: Why small samples?. Cognition, 115(2), 225–237.
Hess, R., Visschers, V. H., Siegrist, M., & Keller, C. (2011). How do people perceive graphical risk communication? The role of subjective numeracy. Journal of Risk Research, 14(1), 47–61.
Hills, T. T., & Hertwig, R. (2010). Information search in decisions from experience do our patterns of sampling foreshadow our decisions?. Psychological Science, 21(12), 1787–1792.
Holt, C. A., & Laury, S. K. (2002). Risk aversion and incentive effects. American Economic Review, 92(5), 1644–1655.
Jasper, J. D., Bhattacharya, C., & Corser, R. (2017). Numeracy predicts more effortful and elaborative search strategies in a complex risky choice context: A process-tracing approach. Journal of Behavioral Decision Making, 30(2), 224–235.
Jasper, J. D., Bhattacharya, C., Levin, I. P., Jones, L., & Bossard, E. (2013). Numeracy as a predictor of adaptive risky decision making. Journal of Behavioral Decision Making, 26(2), 164–173.
Koritzky, G., & Yechiam, E. (2010). On the robustness of description and experience based decision tasks to social desirability. Journal of Behavioral Decision Making, 23(1), 83–99.
Lejarraga, T. (2010). When experience is better than description: Time delays and complexity. Journal of Behavioral Decision Making, 23(1), 100–116.
Mehlhorn, K., Newell, B. R., Todd, P. M., Lee, M. D., Morgan, K., Braithwaite, V. A., ... & Gonzalez, C. (2015). Unpacking the exploration–exploitation tradeoff: A synthesis of human and animal literatures. Decision, 2(3), 191–215.
Okan, Y., Galesic, M., & Garcia-Retamero, R. (2015). How people with low and high graph literacy process health graphs: Evidence from eye-tracking. Journal of Behavioral Decision Making, 29(2-3), 271–294.
Pachur, T., & Galesic, M. (2013). Strategy selection in risky choice: The impact of numeracy, affect, and cross-cultural differences. Journal of Behavioral Decision Making, 26(3), 260–271.
Pachur, T., & Scheibehenne, B. (2012). Constructing preference from experience: the endowment effect reflected in external information search. Journal of Experimental Psychology: Learning, Memory, and Cognition, 38(4), 1108–1116.
Patalano, A. L., Saltiel, J. R., Machlin, L., & Barth, H. (2015). The role of numeracy and approximate number system acuity in predicting value and probability distortion. Psychonomic Bulletin & Review, 22(6), 1820–1829.
Peters, E. (2012). Beyond comprehension the role of numeracy in judgments and decisions. Current Directions in Psychological Science, 21(1), 31–35.
Peters, E., & Levin, I. P. (2008). Dissecting the risky-choice framing effect: Numeracy as an individual-difference factor in weighting risky and riskless options. Judgment and Decision Making, 3(6), 435–448.
Peters, E., Västfjäll, D., Slovic, P., Mertz, C. K., Mazzocco, K., & Dickert, S. (2006). Numeracy and decision making. Psychological Science, 17(5), 407–413.
Petrova, D., Garcia-Retamero, R., Catena, A., Cokely, E., Carrasco, A. H., Moreno, A. A., & Hernández, J. A. R. (2016). Numeracy Predicts Risk of Pre-Hospital Decision Delay: a Retrospective Study of Acute Coronary Syndrome Survival. Annals of Behavioral Medicine, 1-15.
Rakow, T., Demes, K. A., & Newell, B. R. (2008). Biased samples not mode of presentation: Re-examining the apparent underweighting of rare events in experience-based choice. Organizational Behavior and Human Decision Processes, 106(2), 168–179.
Rakow, T., & Newell, B. R. (2010). Degrees of uncertainty: An overview and framework for future research on experience-based choice. Journal of Behavioral Decision Making, 23(1), 1–14.
Rakow, T., Newell, B. R., & Zougkou, K. (2010). The role of working memory in information acquisition and decision making: Lessons from the binary prediction task. The Quarterly Journal of Experimental Psychology, 63(7), 1335–1360.
Reyna, V. F., Nelson, W. L., Han, P. K., & Dieckmann, N. F. (2009). How numeracy influences risk comprehension and medical decision making. Psychological Bulletin, 135(6), 943–973.
Schley, D. R., & Peters, E. (2014). Assessing “economic value” symbolic-number mappings predict risky and riskless valuations. Psychological Science, 25(3), 753–761.
Traczyk, J., & Fulawka, K. (2016). Numeracy moderates the influence of task-irrelevant affect on probability weighting. Cognition, 151, 37–41.
Table Al. Outcomes (O1 – O2) and probabilities (P1 – P2) for the riskier and safer options drawn from Holt and Laury (2002) and used as fillers in the decisions-from-description task in Study 1. X’s in the last column indicate whether the riskier option had a higher expected value (EV). The first pair and the last pair (italicized) were used as attention checks: Data from participants who choose the dominated option were excluded from all analyses.
Riskier Safer
Table A2. Means and 95% confidence intervals in brackets for each dependent variable analyzed by numeracy score and study.
Numeracy Score Dependent Variable: 1 2 3 4 Study 1 Number of Samples 13.74 [10, 17.48] 12.39 [10.41, 14.38] 13.57 [8.13, 19] 17.92 [10.43, 25.42] Alternation Rate .51 [.39, .63] .43 [.33, .53] .32 [.21, .43] .30 [21, .39] Proportion of Samples from Riskier Option .50 [.47, .53] .55 [.53, .56] .54 [.52, .56] .56 [.54, .59] Choice Alignment .59 [.49, .68] .69 [.65, .74] .74 [.66, .82] .69 [.63, .75] Maximization Rate Decisions-from-Description .58 [.51, .64] .57 [.54, .59] .55 [.49, .61] .57 [.52, .62] Maximization Rate Decisions-from-Samples .75 [.68, .81] .73 [.69, .77] .69 [.61, .78] .74 [.69, .79] Risky Choice Rate Decisions-from-Description .26 [.16, .36] .22 [.15, .30] .21 [.10, .32] .28 [.19, .38] Risky Choice Rate Decisions-from-Samples .34 [.25, .42] .31 [.26, .37] .27 [.17, .36] .32 [.25, .39] Study 2 Choice Alignment .61 [.53, .68] .57 [.49 .64] .58 [.49, .67] .69 [.61, .77] Maximization Rate Decisions-from-Description .57 [.52, 63] .58 [.52, .65] .54 [.46, .62] .57 [.49, .65] Maximization Rate Decisions-from-Samples .55 [.48, .62] .60 [.53, .67] .57 [.48, .66] .58 [.52, .65] Risky Choice Rate Decisions-from-Description .45 [.35, .56] .36 [.27, .44] .42 [.29, .56] .34 [.21, .47] Risky Choice Rate Decisions-from-Samples .38 [.29, .47] .42 [.34, .51] .46 [.35, .56] .31 [.21, .41]
Table A3. Correlation matrix showing the relationships between each personality factor assessed and each dependent variable analyzed in Study 1.
AR S NS CC PR EVD EVE RD RE E A C N O 1.00 –0.23 1.00 –0.24 0.11 1.00 –0.21 0.11 0.16 1.00 –0.45 –0.05 0.27 –0.07 1.00 0.01 0.08 –0.02 –0.19 0.10 1.00 0.05 –0.11 –0.03 –0.11 0.08 0.21 1.00 0.00 0.04 –0.04 –0.49 0.30 0.20 0.23 1.00 0.06 0.07 0.03 –0.45 0.09 0.14 0.03 0.44 1.00 –0.05 –0.01 0.01 –0.01 0.10 –0.07 –0.02 0.06 –0.02 1.00 0.13 –0.01 –0.14 0.04 –0.18 –0.07 –0.01 –0.15 –0.13 0.10 1.00 0.18 –0.08 –0.09 –0.02 –0.10 –0.15 0.03 –0.16 –0.01 0.04 0.14 1.00 0.04 0.09 0.17 0.08 –0.03 –0.01 0.03 –0.11 –0.03 0.14 0.17 0.30 1.00 –0.03 0.05 0.00 –0.01 0.07 0.05 0.02 –0.07 –0.02 0.36 0.12 –0.05 –0.02 1.00 Note: |r| ≥ .18 for p<.05; |r| ≥ .14 for p<.10.
Table A4. The objective expected values (EV) for the riskier and safer options and the corresponding average experienced EVs (i.e., the average of all outcomes sampled from each option) separately for each numeracy score in Study 1.
Objective EV Riskier Experienced EV Riskier Objective EV Safer Experienced EV Safer 1 2 3 4 1 2 3 4 37.50 34.89 35.93 35.20 39.91 47.50 46.77 47.89 49.48 44.73 39.84 35.96 38.13 33.43 42.17 48.84 49.17 48.51 47.90 48.25 28.50 24.67 30.69 17.28 31.50 36.50 36.22 36.00 36.30 36.42 30.16 26.76 31.28 23.86 34.77 37.16 38.78 38.91 38.74 36.46 38.24 37.55 37.20 38.20 39.35 44.24 43.65 43.61 44.73 44.86 34.50 36.72 31.31 39.51 35.96 39.50 39.25 39.24 38.92 39.45 30.50 31.84 33.40 29.09 27.38 34.50 33.71 34.67 35.62 35.14 37.00 36.75 37.01 40.36 40.80 40.00 40.20 39.97 39.77 40.03 32.80 31.78 28.46 32.88 26.45 34.80 34.94 34.49 34.13 33.45 38.00 39.76 45.01 38.48 40.76 39.00 39.02 38.97 38.82 38.85 40.00 44.64 39.03 45.92 40.60 40.00 38.01 40.85 39.52 39.87 38.00 34.92 44.21 27.85 42.69 37.00 35.77 37.93 38.71 36.38 41.99 43.27 44.64 34.96 43.06 39.98 40.91 40.11 42.02 40.19 38.00 49.03 35.96 37.04 44.52 35.00 35.88 36.10 35.21 35.76 45.40 44.02 40.53 43.77 42.99 41.40 41.83 41.89 42.49 41.26 40.25 38.69 36.33 36.73 38.96 35.25 34.37 34.11 33.77 34.70 47.16 49.64 45.99 48.57 47.75 41.16 43.13 41.99 43.66 40.45 44.90 52.13 46.03 54.65 45.36 37.90 36.24 38.96 38.28 37.68 47.96 52.12 46.39 52.75 43.21 39.96 41.18 41.45 39.46 38.59 47.02 44.50 44.18 51.55 43.01 38.00 38.90 40.44 37.87 38.37 53.00 61.58 51.91 57.10 56.99 42.98 40.47 43.86 40.25 43.65
I would like to thank Daniel Ben-Eliezer, Tim Rakow, Chaim Salzer, Lukasz Walasek, and Eldad Yechiam for their insightful comments on earlier versions of this manuscript. Support was provided by a Technion Fellowship.
Copyright: © 2017. The authors license this article under the terms of the Creative Commons Attribution 3.0 License.
This document was translated from LATEX by HEVEA.