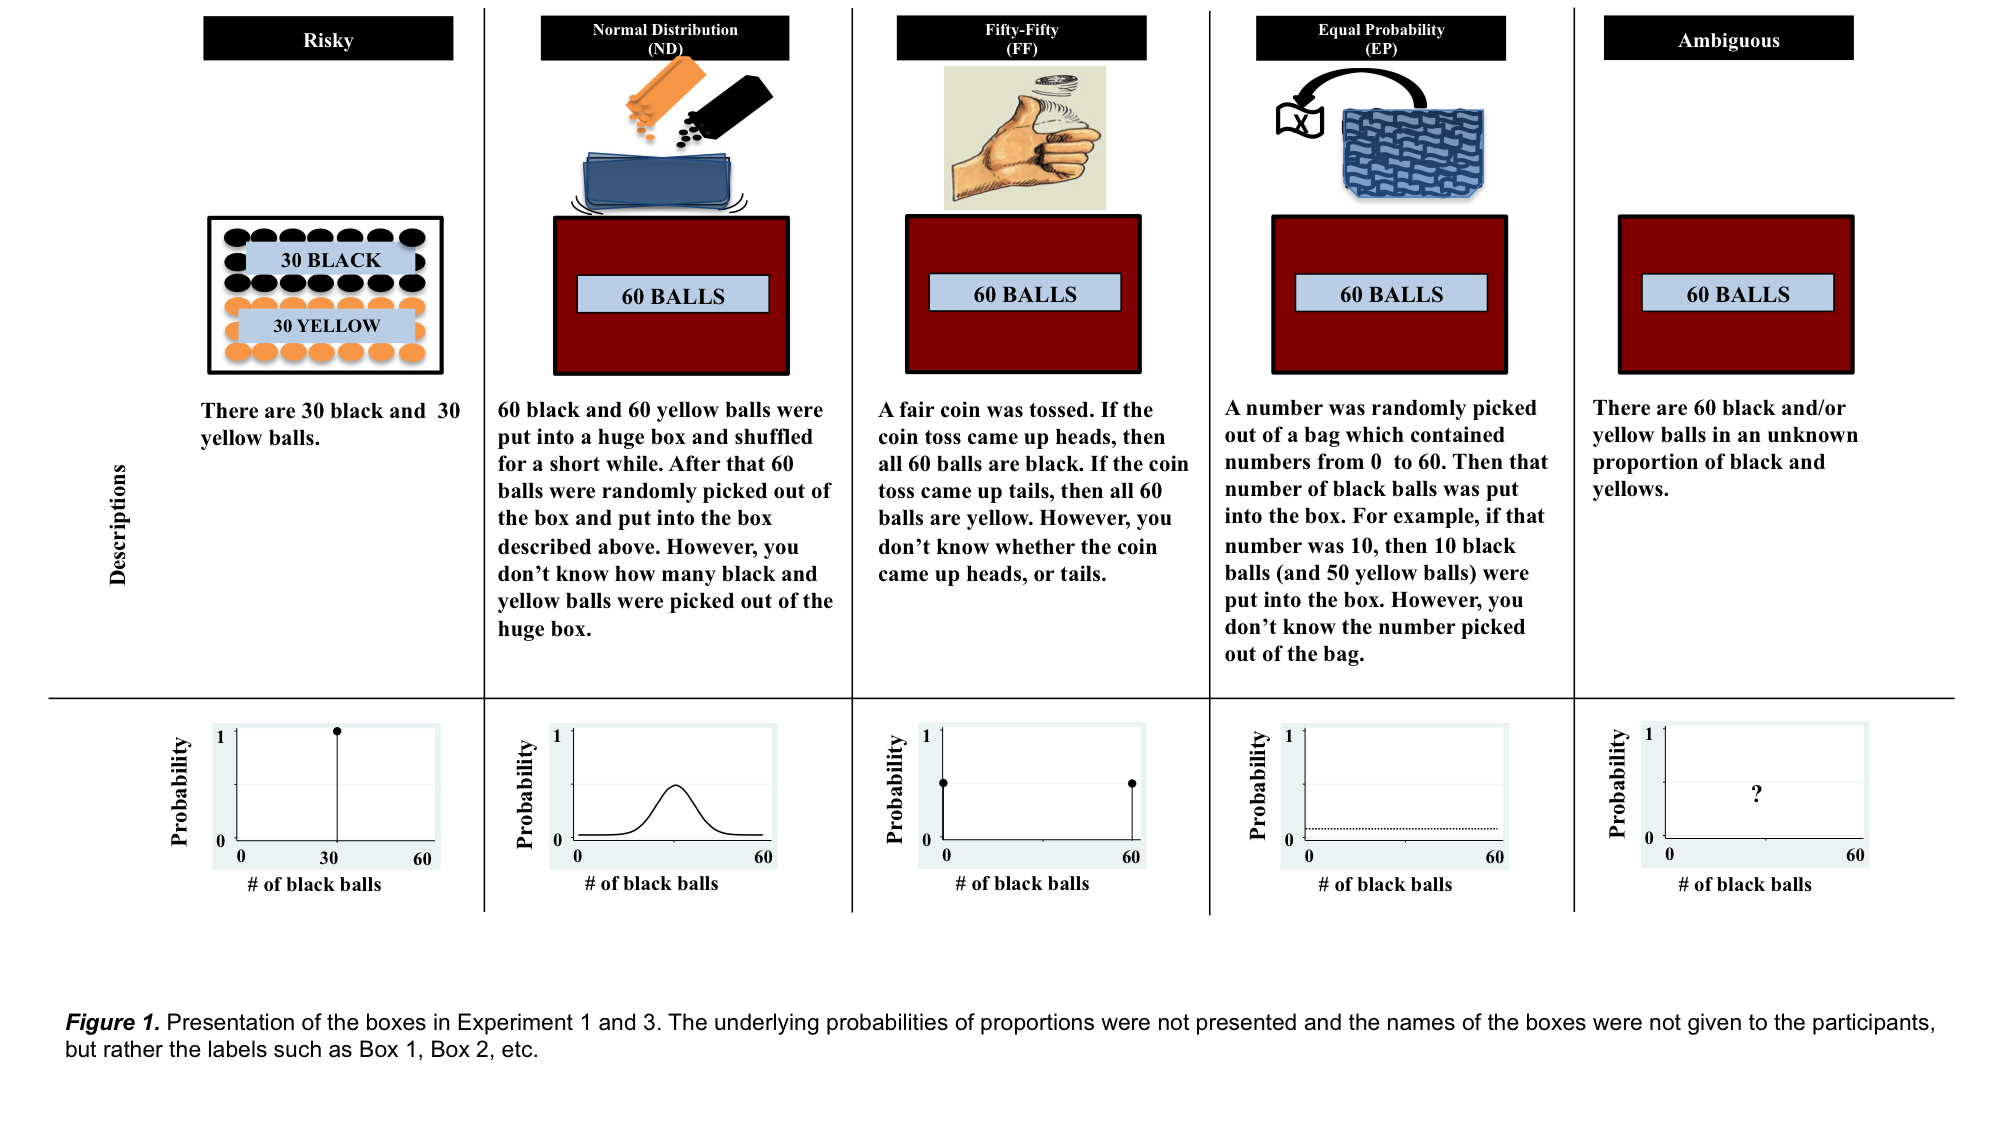
| Figure 1: Presentation of the boxes in Experiment 1 and 3. The underlying probabilities of proportions were not presented and the names of the boxes were not given to the subjects, but rather the labels such as Box 1, Box 2, etc. |
Judgment and Decision Making, Vol. 14, No. 3, May 2019, pp. 335-348
An exploratory investigation of the impact of evaluation context on ambiguity aversionŞule Güney* Ben R. Newell# |
This paper explores how context influences the evaluation of risky and ambiguous bets in the classic two-colour Ellsberg task. In three experiments context was manipulated via the presence/absence of additional bets against which the risky and ambiguous bets could be compared. In Experiment 1, three bets were added that were ‘intermediate’ in the sense that the information they yielded regarding the proportion of coloured balls lay between that provided by the risky and ambiguous bets. The presence of these intermediate bets reduced the price gap between the risky and ambiguous bets – and hence ambiguity aversion – by reducing the pricing of the risky bet relative to a condition in which only the risky and ambiguous bets were presented. In Experiment 2, we examined the individual effect of each of those intermediate bets on the valuations and found that the specific type of additional bet did not significantly affect the extent of the respective price gap. Finally, in Experiment 3, we explored the impact of the presence of ‘filler’ bets that were not necessarily in between the risky and ambiguous bets in terms of the information they yield. We found that having these filler bets also reduced ambiguity aversion. Overall, the findings suggest that the presence of additional bet(s) changes people’s valuations, and narrows the well-documented gap between the risky and ambiguous bets of the Ellsberg task, regardless of whether these additional bet(s) yield relatively more or less information.
Keywords: ambiguity, risk, context
The risky decision making literature demonstrates many examples of how evaluations of gambles are relative to the specific context in which they are presented (Bazerman, Loewenstein & White, 1992; Bazerman, Moore, Tenbrunsel, Wade-Benzoni & Blount, 1999; Birnbaum; 1992; Gneezy, List & Wu, 2006; Hsee, 1996, 1998; Hsee & Zhang, 2004; Janiszewsky & Lichthenstein, 1999; List, 2002; MacCrimmon, Stanbury, & Wehrung, 1980; Mellers, Ordonez & Birnbaum, 1992; Schmeltzer, Caverni & Warglien, 2004; Stewart et al., 2003; Simonson, 2009; for a review, see Hsee, Loewenstein, Blount & Bazerman, 1999). For instance, the price of a particular bet is shown to be susceptible to changes depending on the value of other bets presented alongside (Birnbaum, 1992; Stewart et al., 2003). It has also been shown that even though a prospect is strictly preferred to another when they are evaluated in dyads, the addition of a new prospect that is highly similar to the initially preferred bet can reverse preferences when they are evaluated in triads (Tversky, 1972). Unlike risky decision making, however, the literature on decisions involving ambiguity is short on studies investigating such context effects on evaluations. Thus, the main aim of the set of studies reported here is to investigate how context impacts evaluations when ambiguity is involved.
Ambiguity is broadly defined as uncertainty about missing information that, if available, could affect the probability of outcomes (Frisch & Baron, 1988; Ritov & Baron, 1990).
Ambiguity aversion refers to a pattern of preferences favoring the options with known probabilities (for potential outcomes) over those with probabilities that are unknown because they could depend on missing information. Ambiguity aversion has been demonstrated in the classic two-color Ellsberg task (Ellsberg, 1961), which involves two boxes, each containing 60 yellow and/or black balls. The proportion of these yellow and black balls is known for one box – 30 yellow and 30 black balls – (henceforth, the “risky box/bet”) while it is unknown in the other (henceforth, the “ambiguous box/bet”). When people are asked to bet on a colour to be drawn from one of these boxes, they do not demonstrate any particular colour preference, but they typically prefer the risky box over the ambiguous, even though normative theory implies indifference (Savage, 1954). The existence of ambiguity aversion has been supported by numerous studies and shown to be robust across many different settings (Bossaerts, Ghirardo, Guarnaschelli & Zame, 2010; Frisch & Baron, 1988; Güney & Newell, 2015, 2011; Halevy, 2007; Liu & Colman, 2009; see Camerer & Weber, 1992 for an early review). Various factors have been proposed to explain why ambiguity aversion occurs, including unknown second-order probabilities (Yates & Zukowski, 1976), fear of negative evaluation (Ellsberg, 1963; Curley et al., 1986; Fellner, 1961; Gardenfors, 1979; Knight, 1921; Roberts, 1963; Tratumann et al., 2008), anticipation of potential regret (Curley et al., 1986; Ellsberg, 1963; Heath & Tversky, 1991; Roberts, 1963; Trautmann et al., 2008) or (mis)perceived competitiveness (‘hostile nature hypothesis’, see Curley et al., 1986; Frisch & Baron, 1988; Keren & Gerritsen, 1999; Kühberger & Perner, 2003; Yates & Zukowski, 1976). However, as mentioned earlier, the evaluation context in which the bets are presented has not been thoroughly explored as a potential factor contributing to the emergence of ambiguity aversion.
In this paper, we aimed to investigate how the presence of additional bets in the evaluation context would influence valuations of the risky and ambiguous bets in the classic two-color Ellsberg task. In Experiment 1, the additional bets were ‘intermediate’ in the sense that they were somewhere in between the risky and ambiguous bets in terms of the relative information they yielded (Güney & Newell, 2015): Compared to the ambiguous bet, they yielded more information, but compared to the risky bet they still yielded less information (see the next section regarding how we defined “more” or “less” information). We wanted to explore the impact of such intermediate bets on evaluations of the risky and ambiguous bets since the existing literature suggests that relative knowledge within the evaluation context (and/or feelings of being more/less knowledgeable about the bets) might matter in determining choices among options or valuations of the bets in tasks involving ambiguity (Fox & Tversky, 1995; Fox & Weber, 2002; Baron & Frisch, 1994; Heath & Tversky, 1995; Rubaltelli, Rumiati & Slovic, 2010). In Experiment 2, we presented only one of these intermediate bets along with the risky and ambiguous bets to test their individual impact on evaluations. In Experiment 3, we further explored whether the mere presence of additional bets had an influence on evaluations by using some ‘filler’ bets. Unlike the intermediate bets, these filler bets were not necessarily in between the risky and ambiguous bets in terms of the information they yield.
Figure 1: Presentation of the boxes in Experiment 1 and 3. The underlying probabilities of proportions were not presented and the names of the boxes were not given to the subjects, but rather the labels such as Box 1, Box 2, etc.
In Experiment 1, our main manipulation was to add three new bets to the classic Ellsberg two-colour task. These additional bets were generated by modifying the classic Ellsberg two-colour boxes; the risky box, and the ambiguous box. In the task, the risky box is the one in which the exact proportion of the coloured balls (i.e., 30 blacks and 30 yellows) as well as the probability of that proportion (i.e., 1) are known while the ambiguous bet is the one where neither piece of information is specified (Camerer & Weber, 1992; Halevy, 2007; Yates & Zukowski, 1976). For our additional bets, we simply kept the information about the exact proportion unknown but specified the probabilities of the possible proportions. The main reason why we referred to these additional bets as ‘intermediate’ was that they were in between the risky and ambiguous bet in a sense that they yielded more information than the ambiguous bet (i.e., the probability of proportion is now specified) but less information than the risky bet (i.e., the exact proportion is still unknown). Figure 1 below shows all the bets we used in Experiment 1.
In all intermediate bets, there is a box containing 60 black and/or yellow balls, and the exact proportion of the coloured balls is unknown. However, the probability of possible proportions is specified in each. In the ‘Fifty-fifty’ bet (henceforth, “FF”), the proportion could either be 60 black-0 yellow balls or 0 black-60 yellow balls, and each proportion is equally likely. In the ‘Equal Probability’ bet (henceforth, “EP”), the proportion could be anything (i.e., 60 black-0 yellow balls or 59 black-1 yellow ball or 58 black-2 yellow balls and so on) and each proportion is equally likely (i.e., a uniform distribution, see Chow & Sarin, 2002; Yates & Zukowski, 1976). In the ‘Normal Distribution’ bet (henceforth, “ND”), the proportion is most likely to be 30 black and 30 yellow balls; and least likely to be 60 black-0 yellow balls or 0 black-60 yellow balls.
Bets that are similar to EP and FF have been used previously in the literature (Chow & Sarin, 2002; Halevy, 2007; Yates & Zukowski, 1976). For instance, in a study by Halevy (2007) two EP and FF type bets were presented along with the risky and ambiguous bets. He showed that these two bets with specified probability of proportions were priced lower than the risky bet, and higher than the ambiguous bet. Nevertheless, the results of that study did not reveal whether the presence of these two additional bets changed the evaluations of the risky and ambiguous bets, as there was no relevant control conditions. Therefore, we also included a standard comparative condition in which only the risky and ambiguous bets were evaluated jointly as well as a non-comparative condition in which all bets were evaluated in isolation. We expected to replicate the major finding of Fox and Tversky (1995) where they found a significantly higher price for the risky bet in the standard comparative condition but no, or a smaller (Arlo-Costa & Helzner, 2010; Chow & Sarin, 2002; 2001; Dolan & Jones, 2004) price difference among the two bets in the non-comparative condition.
Finally, to assess the valuation of the bets, we used both willingness-to-pay (henceforth, WTP) and willingness-to-accept (henceforth, WTA) price elicitation tasks to assess the valuation of bets. The main reason for using both elicitation tasks was to see how robust the valuations were to different pricing elicitation methods, since evaluations of the risky and ambiguous bets have been shown to differ depending on the type of elicitation task (Chow & Sarin, 2001; Du & Budescu, 2005; Horowitz & McConnell, 2002; Okada, 2010; Smithson & Campbell, 2009; Trautmann & Schmidt, 2012). The standard interpretation of a valuation is that the higher the WTP/WTA is, the more attractive that bet is perceived.1
We collected the data for the two elicitation tasks in two separate sessions, with 354 subjects (M age = 26.87, 110 female) for the WTP task, and 363 subjects (M age = 29.17, 110 female) for the WTA task.2 The subjects were recruited through Amazon Mechanical Turk and paid a flat participation fee ($.50). All subjects were located in the U.S.A., and they were either native or advanced-level English speakers.
In the experiment, there were three between-subject conditions: Non-comparative, Standard Comparative, and Comparative + Additional bets (hereafter Comparative+). In the Non-comparative condition subjects were presented only one of the five boxes described in Figure 1 (risky, ambiguous, ND, EP, or FF boxes). Those in the Comparative+ condition were presented with all five of the boxes. For the Standard Comparative condition, subjects were presented with only the risky and ambiguous boxes. For the comparative conditions, all boxes were presented simultaneously, but the order of the boxes across the screen was counterbalanced.
The experiment was conducted using Qualtrics online survey software. For each price elicitation task, there were seven experimental groups: Five different groups of subjects in the Non-comparative condition (i.e., each group was presented with only one of the five boxes), one group in the Comparative+ condition (i.e., the group was presented with all of the five boxes simultaneously) and one group in the Standard Comparative condition (the group was presented with the risky and ambiguous boxes simultaneously). Each group contained approximately equal numbers of randomly allocated subjects.
The subjects were first presented with the description of the box[es]. For the presentation of the ND, EP and FF boxes, the procedure of the arrangement of black and yellow balls were clearly described as well as shown to subjects graphically (see Figure 1). The information regarding the box[es] was followed3 by the WTP or WTA task in which the subjects were asked to suppose that they were offered a ticket to play a hypothetical game as follows [the information in brackets was provided only in the Standard Comparative and Comparative+ conditions]:
First you will guess a colour (black or yellow). Next, one ball will be randomly drawn from [one of] the box[es] provided to you. If the colour of the ball drawn matches the colour you have guessed, then you will win $100; otherwise you win nothing.(For the WTP task) What is the highest amount that you would be willing to pay for a ticket to play this game for [each of] the box[es]? Note that the highest amount that you will state implies that you would be willing to pay for any lower amount, and that you would not be willing to pay for any higher amount!
(For the WTA task) What is the smallest amount that you would be willing to accept rather than play this game with [each of] the box[es] described above? Note that the smallest amount that you will state implies that you would be willing to accept for any higher amount, and that you would not be willing to accept for any lower amount!
Please give a value between $0 and $100 [for each box].
For all conditions, both the description and the graphic of the box[es] remained on the screen while the subjects were indicating their WTPs/WTAs.
Those who did not respond (i.e., reported 0 dollars) or those who violated dominance (i.e., reported 100 dollars), or those who could not pass the attention check question (i.e., failed to report the correct number of black balls) were excluded from the analysis.4 5 Note that we conducted separate statistical analyses for the WTA and WTP tasks because these two tasks are considered to be distinct in terms of the underlying psychological mechanisms generating the well-known price disparity (Georgantzis & Navarro-Martinez, 2010).
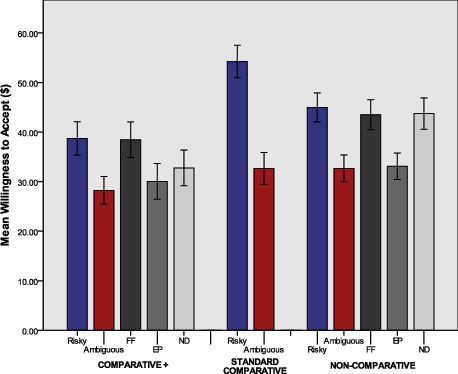
Figure 2: Panel (a): Mean willingness to pay (WTP) and Panel (b) mean willingness to accept (WTA) for all bets across Non-comparative, Standard Comparative and Comparative+ Additional bets conditions in Experiment 1. Error bars represent SEM.
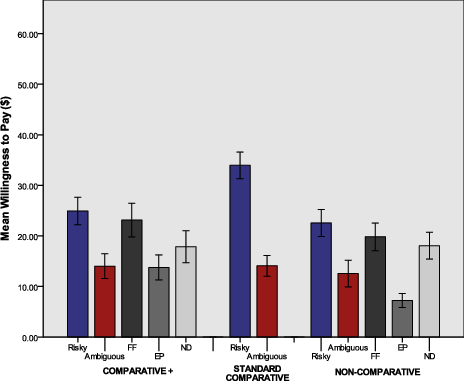
Figure 2 shows mean WTPs [Panel (a)] and WTAs [Panel (b)] for all bets across three conditions. Visual inspection of the figures reveals that in all conditions and under both methods of elicitation subjects value the risky bet highest. The ambiguous bet is typically valued lowest (with the exception of the WTP in the non-comparative condition), with valuations of the intermediate bets lying in between those of the risky and ambiguous. The difference in pricing between the risky and ambiguous bets appears to be largest for the standard comparative conditions. To examine these patterns statistically, and, in accordance with our main interest, we first analysed the changes in the price of the risky and the ambiguous bets across three conditions (i.e., Non-comparative, Standard Comparative, and Comparative+).
Two separate one way between-subjects ANOVAs were conducted; one for testing the overall effect of conditions on the mean price of the risky bet and the other one for that of the ambiguous bet. For the risky bet, the mean prices significantly differed across conditions [for WTP task, F(2, 135) = 5.21, p = .007, η2 = .07; for WTA task, F(2, 136) = 5.72, p = .0004, η2 = .077]. We also ran an independent samples t-test to see if the risky bet was priced significantly higher/lower especially when it was presented along with our three additional bets than when it was presented only with the ambiguous bet. The analysis confirmed that the mean price for the risky bet in the Comparative+ condition was significantly lower than that in Standard Comparative [for WTP task, t(87) = −2.392, p = .019; for WTA task, t(85) = −3.30, p = .001;]. For the ambiguous bet, however, the mean prices were not significantly different across the three conditions [for WTP task, F(2, 135) = 0.14 , p = .87, η2 = .002; for WTA task, F(2, 133) = 0.74, p = .48, η2 = .01].
In order to assess the change in the price difference between the risky and the ambiguous bets across the Comparative+ and Standard Comparative conditions, we conducted a 2x2 mixed design factorial ANOVA, where the between-subjects factor was the condition (i.e., Standard Comparative vs. Comparative+), the within-subjects factor was the bet type (i.e., risky vs. ambiguous) and the mean price was the dependent variable. The interaction was significant for WTP and WTA tasks; meaning that the mean price difference between the risky versus the ambiguous bets was significantly lower in the Comparative+ condition than the Standard Comparative condition, [for WTP task, F(1, 87) =9.40, p = .003, η2 = .015; for WTA task, F(1, 85) = 6.27, p = .02, η2 = .014], respectively. These findings indicate that the presence of the other bets in the Comparative+ condition affects the valuations of the bets (especially that of the risky one) and narrows the price gap between the risky and ambiguous bets.
In order to replicate Fox and Tversky’s main findings (1995), we then conducted a similar analysis to ask whether the price difference between the risky versus the ambiguous bets was smaller in the Non-comparative than in the Standard Comparative condition. Note that, however, the valuation for the risky bet and the ambiguous bet was done by the same group of subjects in the Standard Comparative condition (therefore, the bet type was a within-subject factor) while the valuation for the risky bet and the ambiguous bet was done by two independent groups of subjects in the Non-comparative condition (therefore, the bet type was a between-subject factor in this case). To overcome this complication, we simply treated all four cells [i.e., valuations in (1) the risky bet in the Non-comparative; (2) the risky bet in the Standard; (3) the ambiguous bet in the Non-comparative; (4) the ambiguous bet in the Standard condition] as between-subjects, and ran a 2x2 between-subjects ANOVA for each task.6 The analysis revealed that the interaction was marginally significant for the WTP task [F(1, 188) = 3.846, p = .051, η2 = .020], but not for the WTA task [F(1, 187) =2.328, p = .129, η2 = .012.
The results showed that in the Comparative+ condition when the risky and ambiguous bets were presented along with three additional intermediate bets, the risky bet was priced significantly lower than when it was evaluated only with the ambiguous bet (Figure 2). The price of the ambiguous bet, on the other hand, remained unchanged regardless of the condition, indicating that the presence of the additional intermediate bets (negatively) influenced only the value of the risky bet. This reduction in the price of the risky bet narrowed the price gap between the risky and the ambiguous bets (in the Comparative+ condition compared to the Standard Comparative condition), which implies that the introduction of the additional intermediate bets decreased ambiguity aversion.
Our results are generally consistent with the key findings obtained by Fox and Tversky (1995), because in the Standard Comparative condition the risky bet was priced significantly higher than the ambiguous bet. In addition, there was an overall price difference among bets in the Non-comparative condition. This is an interesting pattern because it shows that valuations can still differ even in the absence of explicit comparisons among bets – a pattern which implies that the informational content of each bet might individually affect people’s perception of how valuable that bet is.7 We also found that the price difference between the risky and the ambiguous bets was significantly smaller in the Non-comparative condition than in the Standard condition only in the WTP task, but not in the WTA task – which is a pattern of results consistent with the findings in the literature as well (see Fox & Tversky, 1995 vs. Chow & Sarin, 2001).
Overall our findings indicate that the introduction of additional intermediate bets decreases the price gap between the risky and ambiguous bet, and hence ambiguity aversion (Fox & Tversky 1995), mainly as a result of a reduction in the price of the risky bet. So why did the pricing of the risky bet, not that of the ambiguous bet, change when there were other bets in the evaluation context? Is there a specific bet and/or its informational content that leads to this pattern or is it their overall existence in the evaluation context that created this significant shift in the price of the risky bet? To explore this issue further, we conducted Experiment 2 in which we presented a single additional bet along with the risky and ambiguous bets and looked at how the respective context influenced evaluations accordingly.
In Experiment 2, we presented only one of the three intermediate bets (i.e., ND, EP, and FF) along with the risky and ambiguous bets. Our aim was to see if a specific additional bet would impact evaluations in a certain way (i.e., whether a particular intermediate bet is responsible for the shift in the price of the risky bet).
We recruited 310 subjects (M age = 29.18, 120 female) through Amazon Mechanical Turk, and paid a flat fee of $.50 in return for their online participation.
In the experiment, there were three conditions in which only one of three intermediate bets (ND, EP, or FF) was presented with the risky and ambiguous bets. We again used both price elicitation tasks (which made up 6 different between-subjects groups). Subjects were randomly assigned to one of these six groups and instructed in the same way as in Experiment 1 for the price elicitation tasks. The experiment was conducted using Qualtrics online survey software.
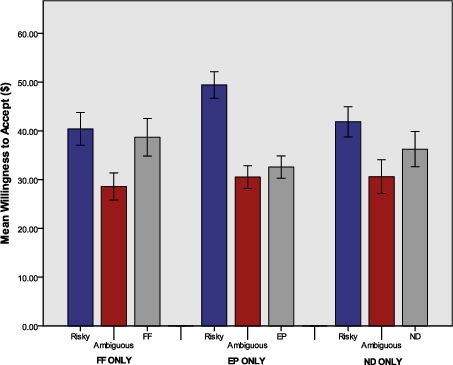
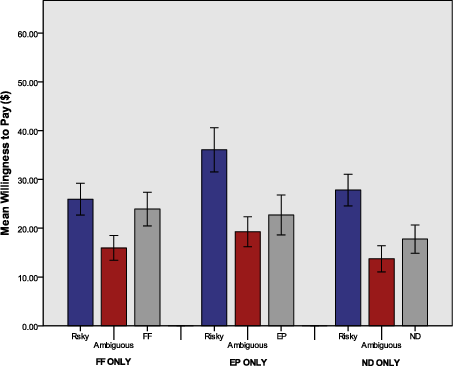
Figure 3: Panel (a) Mean willingness to pay (WTP) and Panel (b) mean willingness to accept (WTA) for bets across ND Only, FF Only and EP only conditions in Experiment 2. Error bars represent SEM.
Subjects who did not respond (i.e., reported 0 dollars), those who violated dominance (i.e., reported 100 dollars), or those who could not pass the attention check question were excluded from analysis.8 9
Figure 3 shows the mean prices for the bets across ND only, EP only, and FF only conditions [Panel (a) for mean WTPs, Panel (b) for mean WTAs]. The figure shows, following the pattern observed in Experiment 1 that subjects valued the risky bet highest and the ambiguous bet lowest across all conditions and methods of elicitation. The price of the additional bet once again fell between those of the risky and ambiguous bets, irrespective of the additional bet type. There is some indication of differences in the pricing gap between the risky and ambiguous bets as a function of additional bet type: the risky bet appears to be priced higher when it was presented with EP only than when the risky and the ambiguous bets were introduced with either ND or FF. However, these differences in prices for the risky bet as a function of the additional bet type were not significant, either in the WTP task or in the WTA task [F(2, 128) = 2.1, p = 0.13, η2 = .03; F(2, 118) = 2.66, p = 0.07, η2 = .04, respectively]. The price of the ambiguous bet did not differ across conditions for both elicitation tasks either [for WTP task, F(2, 128) = 1.00, p = 0.37, η2 = .015; for WTA task, F(2, 118) = 0.16, p = 0.8, η2 = .002].
In addition, we wanted to see if the price difference between the risky and the ambiguous bets changed depending on the type of additional bet with which they were evaluated. To do so, we first ran a 2x3 mixed design factorial ANOVA, where the within-subjects factor was the bet type (i.e., risky vs. ambiguous), the between-subjects factor was the condition (i.e., FF vs. EP vs. ND) and the mean price was the dependent variable. For both WTP and WTA tasks, the main effect for bet type was significant [F(1, 128) = 61.393, p < .001, η2 = .068= .324 and F(1, 118) = 44.684, p < .001, η2 = .275, respectively]. Neither the main effect for the condition, nor the interaction was significant.
Even though cross experimental comparisons might be dangerous, we also wanted to test if the price difference between the risky and ambiguous bets in any of these three conditions of Experiment 2 was different from the respective price difference in the Standard Comparative condition of Experiment 1. To do so, we used the following analysis: we first calculated the price difference between the risky and ambiguous bets (i.e., price difference = WTP for the risky bet − WTP for the ambiguous bet) for each participant in four conditions: Standard Comparative condition of Experiment 1, and FF, EP, and ND conditions of Experiment 2. We then ran a one-way between-subjects ANOVA where the type of condition was the independent variable (with 4 levels; Standard Comparative, ND, EP, FF), and the above-mentioned price difference was the dependent variable. The respective analyses revealed the price difference between the risky and the ambiguous bet did not significantly differ across conditions either in the WTP task or in the WTA task (F(3, 174) = 2.219, p = 0.088; F(3, 162) = 2.088, p = .104, respectively).
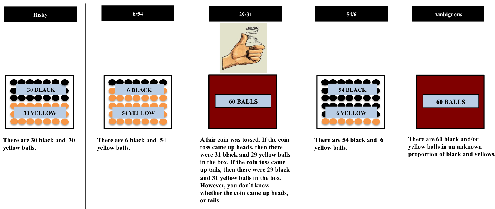
Figure 4: Presentation of the boxes in the Filler condition in Experiment 3. The names of the boxes were not given to the subjects, but rather the labels such as Box 1, Box 2, etc.
The data from Experiment 2 show that subjects priced the risky bet higher than the ambiguous bet in all conditions, irrespective of the type of additional bet presented alongside. Although there was a suggestion in the data that the risky bet is relatively more attractive in the presence of the EP bet alone compared to the ND and FF bets alone (Figure 3) these differences were not statistically reliable. Thus the first conclusion from Experiment 2 is that the specific informational content of the additional bet does not appear to affect evaluations. Moreover, our comparison with the Standard Comparative condition of Experiment 1 suggested, tentatively, that the presence of only one additional bet does not have a dramatic impact on the price difference between the risky and ambiguous bets relative to when those two bets are presented side-by-side (i.e., Standard Comparative). However, given the unsatisfactory nature of this cross-experiment comparison, Experiment 3 pursued further exploratory investigations by testing whether the presence of any type of additional bet (that is ones that were not necessarily intermediate between the ambiguous and risky bets) affected evaluations. In addition, subjects were asked directly about the attractiveness of the different bet types via a simple questionnaire.
Experiment 3 comprised three between-subject conditions: Standard Comparative, Comparative+ (these replicated those of Experiment 1) and a new Filler Condition designed to test whether the mere presence of additional bets, that were not necessarily ‘intermediate’, was sufficient to reduce the price gap between the risky and ambiguous bet. The three filler bets were very similar to the standard risky bet in terms of the information that was made known to the subjects – that is, the proportion of the colored balls (see Figure 4). We decide to only use the WTA task as our elicitation method since there were no major differences between the methods in term of the patterns (of pricing) obtained across conditions in Experiment 1 and 2.
The new follow-up questions aimed to investigate how the bets were perceived in terms of their attractiveness, informativeness, and uncertainty they yielded, depending on the context they were presented in.
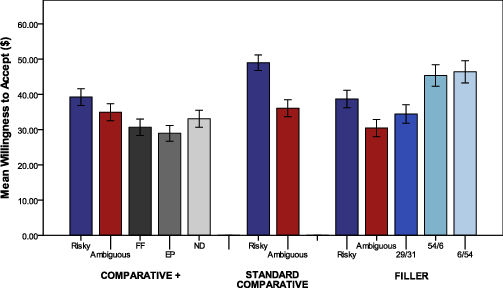
Figure 5: Mean willingness to accept (WTA) for risky and ambiguous bets across the Filler, Standard Comparative (Comparative) and Comparative+ Additional bets (Comparative+) conditions in Experiment 3. Error bars represent SEM.
Three hundred subjects (M age = 35.79, 147 female) were recruited through Amazon Mechanical Turk and paid a flat participation fee of $.50. All subjects were located in the U.S.A., and they were native English speakers. The experiment was conducted using Qualtrics.
The subjects were randomly assigned to one of the 3 conditions, that were, the Comparative+ and Standard Comparative conditions along with the new condition called Filler, where the risky and ambiguous boxes were presented with the new filler boxes (Figure 4). In the Filler condition, the “6/54” box contained 6 black and 54 yellow balls whereas the “54/6” box contained 54 black and 6 yellow balls. The “29/31” box had 29 black and 31 yellow balls (determined by a coin flip, i.e., a 50% chance), otherwise 31 black and 29 yellow balls. Instructions for the WTA task were almost exactly the same with those in the previous experiments, except for two minor differences: (1) Right before the subjects stated their WTAs for the bets, they were given a reminder about how the betting task worked (i.e., that they were supposed to guess a colour first, and then pick a box to draw a ball from etc.), so that they could clearly remember what their evaluations/pricing was supposed to be based on. (2) They were instructed not to give the values of 0 or 100 as their WTA.10 The order of presentation of the boxes during the pricing stage were randomized across subjects in each condition.
The follow-up questionnaire probed how the subjects felt about each box in each condition after completing the pricing stage. There were total of 4 items in the questionnaire, and subjects were asked to state how much they agreed/disagreed with each item on a scale from 1 (Strongly Disagree) to 7 (Strongly Agree) for each box. The first item was about how informative the subjects think a particular box is (i.e., “I know very little about the proportion of black balls in the box”). The second item was related to how certain they feel about the box (i.e., “I feel that some information is missing about this box”). The third item was about how confident they feel in betting on the box (i.e., “I am in a good position to make a decision about the bet on this box”). The last item was about how attractive they think the box is (i.e., “I find this box highly appealing to bet on”). Note that the bets were presented on the screen together (but in a randomized order).
Figure 5 shows the mean WTAs of the bets across the three conditions. Focusing first on the Standard Comparative and Comparative+ conditions, we can see – consistent with Experiment 1 – that additional bets appear to reduce the price difference between the risky and ambiguous bets. Unlike the first two experiments, however, the ambiguous bet is no longer the lowest priced bet in the Comparative+ condition (although differences between it and the additional bets are small). In the new Filler condition, the ambiguous bet is lowest-priced with the remaining bets priced apparently according to known odds of winning (see below for further explanation of this pattern). Importantly, the difference between the risky and ambiguous bet in this conditions is also smaller than in the Standard Comparative condition.
To investigate these patterns, we first conducted two separate one-way between-subjects ANOVAs; one for examining the change in the price of the risky bet among the three conditions, and the other one for the ambiguous bet. The mean WTAs significantly differed across conditions for the risky bet [F(2, 297) = 6.13, p = .002, η2 = .04]. Replicating the pattern observed in Experiment 1, an independent samples t-test showed that the mean WTAs for the risky bet in the Comparative+ condition was significantly lower than in the Standard Comparative condition t(203) = −3.007, p = .003. In addition, the mean WTA for the risky bet was also significantly lower in the Filler condition than in the Standard Comparative condition t(195) = −3.114, p = .002. On the other hand, the mean WTAs for the ambiguous bet were not significantly different across the three conditions [F(2, 297) = 1.47, p = .231, η2 = .01].
More crucial to the aim of Experiment 3, we wanted to see whether the price difference between the risky and ambiguous box changed depending on the condition. We first conducted a 2x3 mixed design factorial ANOVA, where the within-subjects factor was the bet type (i.e., risky vs. ambiguous), the between-subjects factor was the condition (i.e., Filler vs. Standard Comparative vs. Comparative+), and the mean price was the dependent variable. We found a significant main effect for both the bet type [F(1, 297) = 33.21, p < .001, η2 = .101] and the condition [F(2, 297) = 4.035, p = .019, η2 = .026]. The interaction was not quite significant, [F(2, 297) = 2.954, p = .054, η2 = .020, two-tailed]. Note that the interaction effect here still does not fully capture our main interest of whether the price difference between the risky and the ambiguous bets in the Comparative+ and Filler conditions differs from the respective difference in the Standard Comparative condition. In order to address this question, we used the same analysis of comparison across three conditions in terms of the price difference between the risky and the ambiguous bet: we again first calculated the price difference between the risky and ambiguous bets (i.e., price difference = WTA for the risky bet − WTA for the ambiguous bet) for each participant in all three conditions. We then ran a one-way between-subjects ANOVA where the type of condition was the independent variable (with 3 levels; Comparative+, Standard Comparative, and Filler), and the above-mentioned price difference was the dependent variable. The analysis revealed a non-diagnostic p-value in terms of whether there was difference in the price difference between the risky and ambiguous bets [F(2, 297) = 2.954, p = .05, η2 = .02]. Post-hoc pairwise comparisons showed that the mean price difference in the Comparative+ was significantly smaller than that of the Standard Comparative condition (p = .042) (Tukey HSD, critical value (.05, 3, 297) = 3.31). Even though the mean price difference between the risky and ambiguous bets in the Filler condition was relatively smaller than that of the Standard Comparative condition (8.22. vs 12.89, respectively), the respective difference between the two conditions didn’t reach statistical significance.
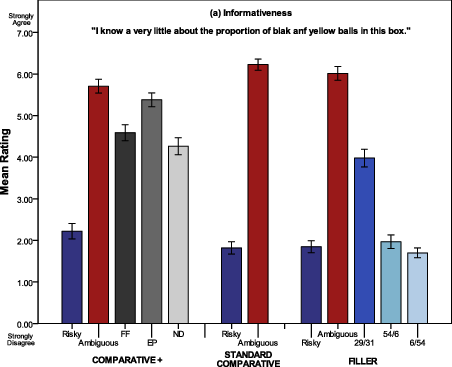
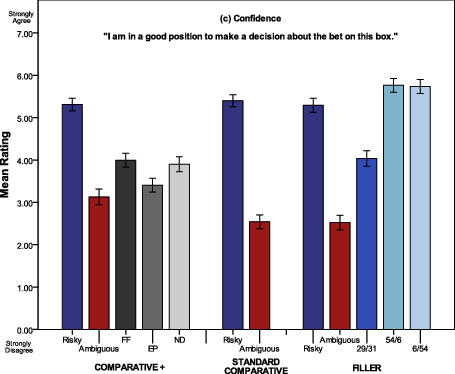
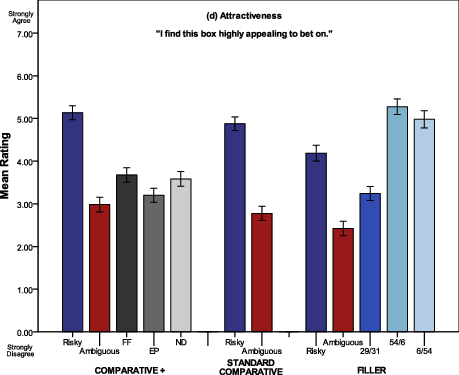
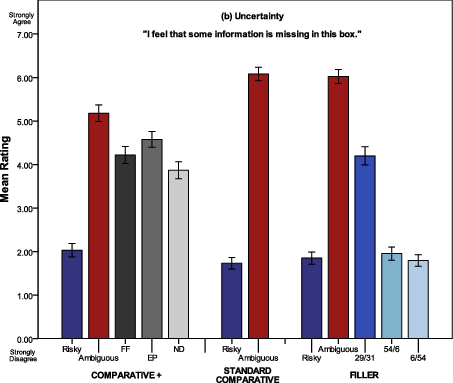
Figure 6: Mean ratings for each follow-up item across three conditions on a scale from 0 (“strongly disagree”) to 7 (“strongly agree”).
Figure 6 shows the mean ratings of each item (informativeness, uncertainty, confidence and attractiveness) for each bet across all conditions. Note that higher ratings indicate less informativeness, higher uncertainty, higher confidence, and higher attractiveness. The overall trend for each item among the bets was as follows: Regardless of the context, the risky bet(s)11 were always rated as the most informative and attractive, and the ones subjects felt the most certain and confident about, whereas the ambiguous bet was rated the least of all. In the Comparative+ condition, the additional bets were almost always rated in between the risky and ambiguous bets on each item. In the Filler condition, the ratings for the 6/54 and 54/6 bets were almost identical to those of the risky one whereas the 29/31 was generally rated in between the risky and the ambiguous bets for each item.
In accordance with our main interest, we examined whether the ratings of the risky and ambiguous bets for each item varied depending on which condition (or context) they were presented in. Therefore, for all four items, we ran two sets of four separate one-way ANOVAs (for 4 items, one for the risky bet, and the other for the ambiguous bet), with the condition type (i.e., the Filler, Standard Comparative and Comparative+) as the independent variable and the rating as the dependent variable. The mean ratings for the risky bet did not significantly differ across three conditions, except for the attractiveness item, F(2, 297) = 8.245, p < .0001, η2 = .05. The risky bet was rated less attractive in the Filler condition than in the Comparative+ condition (p < .0001) and as well as the Standard Comparative condition (p = .012).
The overall ratings on the attractiveness item for the ambiguous bet did not significantly differ across conditions either. The mean ratings of uncertainty, and confidence items, however, were significantly different across the three conditions: F(2, 297) = 8.907, p < .0001, η2 = .06, and F(2, 297) = 3.96, p = .02, η2 = .02, respectively. However, the only non-marginal difference between pairs of conditions was between the mean rating for the uncertainty item in the Comparative+ condition compared to that in the Standard Comparative condition (p = .001) and the Filler condition (p = .002). This result indicates that the ambiguous bet was perceived less uncertain in the Comparative+ condition than in the other two conditions. (See Appendix A for a complete table presenting means, SDs and N for each condition)
The results of Experiment 3 are similar to those of Experiment 1 in showing that the additional bets in the evaluation context reduces the price difference between the risky and ambiguous bets relative to when those two bets are evaluated in the absence of any other bet. This pattern is more apparent when the additional bets are intermediate in informational value, rather than simply being ‘fillers’ but is qualitatively the same regardless of bet type. The Experiment 3 results also confirm that the observed price difference reduction is carried by movement in pricing of the risky bet (it is pulled downwards in the presence of other bets) rather than changes to the price of the ambiguous bet (it remains relatively constant across conditions). The post-experimental questionnaire revealed that participants rated the different gambles largely as one would expect given the information provided about each gamble (e.g., risky gambles as more informative and attractive than ambiguous). Differences in ratings as a function of condition, were mostly marginal or non-significant, thus suggesting caution in interpreting patterns prior to further replication (See Appendix A for further comparisons).
We undertook an exploratory investigation of the impact of additional bets on the evaluation of the standard risky and ambiguous bets in the two-color Ellsberg Task. Our main conclusion, from Experiments 1 and 3, is that presenting additional bets reduces the price gap between the risky and ambiguous bets, by lowering the pricing of the risky bet. Experiment 2 suggested that this reduction in the price gap is much smaller if only one additional bet (rather than three used in Experiments 1 and 3) is presented alongside the risky and ambiguous bets.
A potentially informative observation in attempting to understand why this pattern arises is to note that, regardless of whether the additional bets are ‘intermediate’ or ‘filler’, their presence makes the price gap between the risky and the ambiguous bet resemble the respective price gap in the Non-Comparative condition (the fourth and fifth bars from the right of Figure 2 panels A and B). This resemblance might suggest that the presence of additional bets creates a more isolated evaluation of the risky bet and ambiguous bet, in comparison to the Standard Comparative where there are no other bets to pay attention to. Perhaps this more diffuse evaluation context, in which each bet is assessed on its own merit rather than in direct comparison to one other single bet, leads to a less pronounced contrast between risky and ambiguous (similar to the Non-comparative condition – where isolated evaluation is enforced), which could in turn result in the smaller price gap (Tversky & Fox. 1995). The non-significant results of Experiment 2, where there was only one additional bet presented alongside, might also support this explanation. Perhaps the presence of only one bet was not enough to change the valuations dramatically, because the comparison context is not sufficiently diffuse (i.e., the risky vs ambiguous bets contrast remains pronounced). Perhaps what is crucial in facilitating such separate, more isolated evaluations is the number of additional bets presented alongside the risky and ambiguous bets. A simple test of this idea would be to present the standard risky and ambiguous bets with different numbers of additional bets (i.e., with 1 additional bet, 2 additional bets, 3 additional bets and so on) but keep their informational content almost identical to one another (i.e., risky type bets) to see if the price gap – and hence ambiguity aversion – is reduced as an increasing function of the number of additional bets.
An alternative explanation for the reduction in price for the risky bet is that the presence of additional bets invites particular types of comparison processes that are driven by the context. For example, in the Filler condition of Experiment 3, there were two other bets that were very similar to the risky bet in terms of the information disclosed to the participants (i.e., specified proportion of the colored balls). Moreover, one of those two bets was always dominant in comparison to the risky bet in terms of winning probabilities (depending on the color a participant selected). Thus, within this specific context, the risky bet might have stood out to be less attractive, thus lowering its price relative to the Standard Comparative condition. Across-condition comparison of the attractiveness ratings of the risky box supports this idea given that the risky bet was rated significantly lower on the attractiveness item in the Filler condition than in the Comparative+ or the Standard Comparative conditions.
One could further speculate that in this particular condition, the evaluation of the risky bet might have been driven by a form of the similarity effect (Tversky, 1972). The similarity effect suggests that, even though one prospect is strictly preferred to another when they are evaluated in dyads, the addition of a new prospect that is highly similar to the initially preferred bet can reverse preferences when they are evaluated in triads (Tversky, 1972). Thus, in our Filler condition, this similarity effect might be reflected as the risky bet being devalued (relative to the Standard Comparative condition) when two other similar bets (the 54/6 and 6/54 bets) are added to the evaluation context.
While our findings from all three studies showed that price of the risky bet changes depending on the evaluation context, the price of the ambiguous bet remained unaffected regardless of the presence or absence of the additional bets. This may reflect a simple ceiling effect whereby people will not go above a certain dollar amount given the (relatively) unknown odds of winning. This interpretation would be consistent with the finding that, even though the ambiguous bet was rated as relatively more informative and/or less uncertain in Experiment 3 depending on the context it was presented in, the ratings of its attractiveness did not significantly differ across condition. Perhaps in order to dramatically shift pricing for ambiguous gambles, other methods of information presentation might be required, such as experiencing the potential outcomes of taking a gamble (e.g., Güney & Newell, 2015)
Arlo-Costa, H., & Helzner, J. (2010). Ambiguity aversion: the explanatory power of indeterminate probabilities. Synthese, 172, 37–55.
Baron, J., & Frisch, D. (1994). Ambiguous Probabilities and the Paradoxes of Expected Utility. In G. Wright & P. Ayton (Eds.), Subjective Probability, Chichester: John Wiley and Sons Ltd.
Bazerman, M. H., Loewenstein, G. F., & White, S. B. (1992). Reversals of preference in allocation decisions: Judging an alternative versus choosing among alternatives. Administrative Science Quarterly, 37, 220–240.
Bazerman, M. H., Moore, D. A., Tenbrunsel, A. E., Wade-Benzoni, K. A., & Blount, S. (1999). Explaining how preferences change across joint versus separate evaluation. Journal of Economic Behavior & Organization, 39, 41–58.
Birnbaum, M. H. (1992). Violations of monotonicity and contextual effects in choice-based certainty equivalents. Psychological Science, 3, 310– 314.
Birnbaum, M. H., & Beeghley, D. (1997). Violations of branch independence in judgments of the value of gambles. Psychological Science, 8, 87–94.
Birnbaum, M. H., & Zimmermann, J. M. (1998). Buying and selling prices of investments: Configural weight model of interactions predicts violations of joint independence. Organizational Behavior and Human Decision Processes, 74, 145–187.
Bossaerts, P., Ghirardato, P., Guarnaschelli, S., & Zame, W. (2010). Ambiguity in asset markets: theory and experiment. Review of Financial Studies, 23, 1325–1359.
Camerer, C., & Weber, M. (1992). Recent developments in modeling preferences: Uncertainty and ambiguity. Journal of Risk and Uncertainty, 5, 325–370.
Chow, C. C., & Sarin, R. K. (2001). Comparative ignorance and the Ellsberg paradox. Journal of Risk and Uncertainty, 22, 129–139.
Chow, C. C., & Sarin, R. K. (2002). Known, unknown, and unknowable uncertainties. Theory and Decision, 52(2), 127–138.
Curley, S. P., Yates, J. F., & Abrams, R. A. (1986). Psychological sources of ambiguity avoidance. Organizational Behavior and Human Decision Processes, 38, 230–56.
Dolan, P., & Jones, M. (2004). Explaining attitudes towards ambiguity: An experimental test of the comparative ignorance hypothesis. Scottish Journal of Political Economy, 51(3), 281–301.
Du, N., & Budescu, D. V. (2005). The effects of imprecise probabilities and outcomes in evaluating investment options. Management Science, 51, 1791–1803. Einhorn, H. J., &
Ellsberg, D. (1963). Risk, ambiguity, and the Savage axioms: Reply. Quarterly Journal of Economics, 77, 336–342.
Fellner, W. (1961). Distortion of subjective probabilities as a reaction to uncertainty. Quarterly Journal of Economics, 75, 670–689.
Gärdenfors, P. (1979). Forecasts, decisions, and uncertain probabilities. Erkenntis, 14, 159–181.
Hogarth, R. M. (1985). Ambiguity and uncertainty in probabilistic inference. Psychological Review, 92, 433–461.
Ellsberg, D. (1961). Risk, ambiguity and the Savage axioms. Quarterly Journal of Economics, 75, 643–669.
Fox, C. R., & Tversky, A. (1995). Ambiguity aversion and comparative ignorance. Quarterly Journal of Economics, 110, 585–603.
Fox, C. R., & Weber, M. (2002). Ambiguity aversion, comparative ignorance, and decision context. Organizational Behavior and Human Decision Processes, 88, 476–498.
Frisch, D., & Baron, J. (1988). Ambiguity and rationality. Journal of Behavioral Decision Making, 1, 146–157.
Georgantzis, N., & Navarro-Martinez, D. (2010). Understanding the WTA-WTP gap: Attitudes, feelings, uncertainty and personality. Journal of Economic Psychology, 31, 895–907.
Gneezy, U., List, J. A., & Wu, G. (2006). The uncertainty effect: When a risky prospect is valued less than its worst possible outcome. The Quarterly Journal of Economics, 1283–1309.
Güney, Ş., & Newell, B. R. (2015). Overcoming ambiguity aversion through experience. Journal of Behavioral Decision Making, 28(2), 188–199.
Güney, Ş. & Newell, B. R. (2011). The Ellsberg ’problem’ and implicit assumptions under ambiguity. In L. Carlson, C. Hoelscher, & T. F. Shipley (Eds.), Proceedings of the 33rd Annual Conference of the Cognitive Science Society (pp. 2323–2328). Austin, TX: Cognitive Science Society.
Halevy, Y. (2007). Ellsberg revisited: An experimental study. American Economic Review, 75(2), 503–536.
Heath, C., & Tversky, A. (1991). Preference and belief: Ambiguity and competence in choice under uncertainty. Journal of Risk and Uncertainty, 4, 5–28.
Horowitz, J. K., & McConnell, K. E. (2002). A review of WTA / WTP studies. Journal of Environmental Economics and Management, 44, 426–447.
Horton, J. J., Rand, D. G., & Zeckhauser, R. J. (2011). The online laboratory: Conducting experiments in a real labor market. Experimental Economics, 14(2), 399–425.
Hsee, C. K. (1996). The evaluability hypothesis: An explanation for preference reversals between joint and separate evaluations of alternatives. Organizational Behavior and Human Decision Processes, 67, 247–257.
Hsee, C. K. (1998). Less is better: When low-value options are valued more highly than high-value options. Journal of Behavioral Decision Making, 11, 107–121.
Hsee, C. K., Lowenstein, G. F., Blount, S., & Bazerman, M. H. (1999). Preference Reversals Between Joint and Separate Evaluations of Options: A Review and Theoretical Analysis. Psychological Bulletin, 125, 576–590.
Hsee, C. K., & Zhang, J. (2004). Distinction bias: Misprediction and mischoice due to joint evaluation. Journal of Personality and Social Psychology, 86, 680–695.
Janiszewski, C., & Lichtenstein, D. R. (1999). A range theory account of price perception. Journal of Consumer Research, 25(4), 353–368.
Keren, G. B., & Gerritsen, L. E. M. (1999). On the robustness and possible accounts for ambiguity aversion. Acta Psychologica, 103, 149–172.
Knight, F. H. (1921). Risk, uncertainty and profit. Boston: Houghton Mifflin.
Kühberger, A., & Perner, J. (2003). The role of competition and knowledge in the Ellsberg task. Journal of Behavioral Decision Making, 16, 181–191.
List, J. A. (2002). Preference reversals of a different kind: The ‘‘more is less’’ phenomenon. American Economic Review, 92, 1636–1643.
Liu, H. H., & Colman, A. M. (2009). Ambiguity aversion in the long run: repeated decision making under risk and uncertainty. Journal of Economic Psychology, 30, 277–284.
MacCrimmon, K. R., Stanbury, W. T., & Wehrung, D. A. (1980). Real money lotteries: A study of ideal risk, context effects, and simple processes. In T. S. Wallsten (Ed.), Cognitive process in choice and decision behavior (pp. 155–177). Hillsdale, NJ: Erlbaum.
Mellers, B. A., Ordonez, L. D., & Birnbaum, M. H. (1992). A change-of-process theory for contextual effects and preference reversals in risky decision making. Organizational Behavior and Human Decision Processes, 52, 311–369.
Mellers, B., Schwartz, A., Ho, K., & Ritov, I. (1997). Decision affect theory: Emotional reactions to the outcomes of risky options. Psychological Science, 8, 423–429.
Okada, E. M. (2010). Uncertainty, risk aversion, and WTA vs. WTP. Marketing Science, 29(1), 75–84.
Ritov, I., & Baron, J. (1990). Reluctance to vaccinate: Omission bias and ambiguity. Journal of Behavioral Decision Making, 3, 263–277.
Roberts, H. V. (1963). Risk, ambiguity, and the Savage axioms: Comment. Quarterly Journal of Economics, 11, 327–336.
Rubaltelli, E., Rumiati, R., & Slovic, P. (2010). Do ambiguity avoidance and the comparative ignorance hypothesis depend on people’s affective reactions?. Journal of Risk and Uncertainty, 40(3), 243–254.
Savage, L. J., (1954). The Foundation of Statistics. New York: John Wiley and Sons.
Schmeltzer, C., Caverni, J. P., & Warglien, M. (2004). How does preference reversal appear and disappear? Effects of the evaluation mode. Journal of Behavioral Decision Making, 17(5), 395–408.
Simonson, U. (2009). Direct risk aversion evidence from risky prospects valued below their worst outcome. Psychological Science, 20(6), 686–692.
Smithson, M., & Campbell, P. D., (2009). Buying and selling prices under risk, ambiguity and conflict. 6th International Symposium on Imprecise Probability: Theories and Applications, Durham, United Kingdom.
Stewart, N., Chater, N., Stott, H. P., & Reimers, S. (2003). Prospect relativity: how choice options influence decision under risk. Journal of Experimental Psychology: General, 132(1), 23.
Trautmann S. T., & Schmidt, U. (2012). Pricing risk and ambiguity: The effect of perspective taking. The Quarterly Journal of Experimental Psychology, 65(1), 195–205.
Trautmann, S. T., Vieider, F. M., & Wakker, P. P. (2008). Causes of ambiguity aversion: Known versus unknown preferences. Journal of Risk and Uncertainty, 36, 225–243.
Tversky, A. (1972). Elimination by aspects: A theory of choice. Psychological Review, 79, 281–299.
Yates, J. F., & Zukowski, L. G. (1976). Characterization of ambiguity in decision making. Behavioral Science, 21, 19–21.
Zeelenberg, M., Van den Bos, K., Van Dijk, E., & Pieters, R. (2002). The inaction effect in the psychology of regret. Journal of Personality and Social Psychology, 82, 314–327.
Mean ratings [SDs in brackets] on a scale from 0
(“strongly disagree”) to 7 (“strongly agree”) for each follow-up item
across three conditions (number of subjects for each condition in
parentheses).
Condition: | Filler (n=95) | SC (n=102) | Comparative+ (n=103) | |||||
Item | Bet | Rating | Bet | Rating | Bet | Rating | ||
Informativeness | Risky | 1.84 [1.41] | Risky | 1.82 [1.49] | Risky | 2.22 [1.89] | ||
41.25in(“I know very little about the proportion of black balls in the box”) | 6/54 | 1.70 [1.16] | Amb. | 6.22 [1.34] | ND | 4.26 [2.05] | ||
29/31 | 3.98 [2.06] | FF | 4.59 [1.94] | |||||
54/6 | 1.97 [1.59] | EP | 5.38 [1.68] | |||||
Amb. | 6.01 [1.59] | Amb. | 5.70 [1.67] | |||||
Certainty | Risky | 1.85 [1.36] | Risky | 1.73 [1.34] | Risky | 2.03 [1.57] | ||
31.25in (“I feel that some information is missing about this box”) | 6/54 | 1.79 [1.27] | Amb. | 6.08 [1.57] | ND | 3.87 [1.99] | ||
29/31 | 4.20 [2.02] | FF | 4.22 [2.00] | |||||
54/6 | 1.95 [1.48] | EP | 4.58 [1.86] | |||||
Amb. | 6.02 [1.57] | Amb. | 5.18 [1.93] | |||||
Confidence | Risky | 5.29 [1.63] | Risky | 5.40 [1.44] | Risky | 5.31 [1.52] | ||
41.25in (“I am in a good position to make a decision about the bet on this box”) | 6/54 | 5.73 [1.60] | Amb. | 2.54 [1.63] | ND | 3.90 [1.80] | ||
29/31 | 4.04 [1.79] | FF | 3.99 [1.69] | |||||
54/6 | 5.77 [1.58] | EP | 3.41 [1.66] | |||||
Amb. | 2.52 [1.70] | Amb. | 3.13 [1.87] | |||||
Attractiveness | Risky | 4.19 [1.80] | Risky | 4.88 [1.60] | Risky | 5.13 [1.67] | ||
31.25in (“I find this box highly appealing to bet on”) | 6/54 | 4.98 [1.96] | Amb. | 2.77 [1.69] | ND | 3.58 [1.75] | ||
29/31 | 3.24 [1.60] | FF | 3.68 [1.71] | |||||
54/6 | 5.27 [1.79] | EP | 3.20 [1.65] | |||||
Amb. | 2.42 [1.67] | Amb. | 2.98 [1.76] | |||||
Copyright: © 2019. The authors license this article under the terms of the Creative Commons Attribution 3.0 License.
This document was translated from LATEX by HEVEA.