The degree to which individuals prefer smaller sooner versus larger
delayed rewards serves as a powerful predictor of their impulsivity
towards a number of different kinds of rewards. Here we test the
limits of its predictive ability within a variety of cognitive and
social domains. Across several large samples of subjects,
individuals who prefer smaller more immediate rewards (steeper
discounters) are less reflective (or more impulsive) in their
choices, preferences, and beliefs. First, steeper discounters used
more automatic, less controlled choice strategies, giving more
intuitive but incorrect responses on the Cognitive Reflection Test
(replicating previous findings); employing a suboptimal probability
matching heuristic for a one-shot gamble (rather than maximizing
their probability of reward); and relying less on optimal planning
in a two-stage reinforcement learning task. Second, steeper
discounters preferred to consume information that was less complex
and multi-faceted, as suggested by their self-reported Need for
Cognitive Closure, their use of short-form social media (i.e.,
Twitter), and their preferred news sources (in particular, whether
or not they preferred National Public Radio over other news
sources). Third, steeper discounters had interpersonal and religious
beliefs that are associated with reduced epistemic complexity: they
were more likely to believe that the behavior of others could be
explained by fixed rather than dynamic factors, and they believed
more strongly in God and in the afterlife. Together these findings
provide evidence for a link between individual differences in
temporal discounting for monetary rewards and preferences for the
path of least resistance (less reflective and/or more automatic
modes of processing) across a variety of domains.
Intertemporal choice — deciding whether to delay gratification in
hopes of gaining larger future rewards — is a central topic of study
in judgment and decision-making. Individuals vary in their responses
to intertemporal choice, and their revealed discount rates are
predictive of behavior across several other reward domains. Most
notably, people who discount monetary rewards more steeply with delay,
preferring smaller sums sooner to larger sums later, tend to discount
delays associated with other goods, such as food (Duckworth, Tsukayama
& Geier, 2010; Jarmolowicz, Cherry, Reed & Bruce, 2014), alcohol
(MacKillop et al., 2010; Petry, 2001), sex (Reimers, Maylor, Stewart,
& Chater, 2009), and drugs (Kirby, Petry & Bickel, 1999). These
behavioral patterns have significant consequences. People who favor
immediate rewards, as in the classic “marshmallow experiments”, have
poorer academic performance, career success, and are more likely to be
incarcerated or have a drug addiction (Duckworth & Seligman, 2005;
Eigsti et al., 2006; Mischel, Shoda & Rodriguez, 1989). These
findings point toward a broad psychological and behavioral pattern.
Might this pattern be even broader? Here we investigate the
relationship between steep discounting and a more general tendency to
rely less on controlled processing and/or rely more on automatic
processing, that is, to take what we call the “path of
least cognitive resistance”.
Several lines of evidence suggest a relationship between steep
discounting and a more general avoidance of reflective/effortful
processing. Substance abusers collect fewer information samples than
others before forming a decision about an underlying distribution
(i.e., whether there are more samples of one color or another in a
partially observable set); this tendency to reach premature
conclusions is consistent with a construct has been called
reflection/impulsivity (Clark, Robbins, Ersche & Sahakian, 2006; see
Kagan, 1966). Steeper monetary discounters have also been shown to
discount cognitive effort more steeply: when given the choice of
performing an easy or a hard cognitive task (e.g., tasks varying in
working memory load) they are more likely to choose the easy task
(Kool, McGuire, Wang & Botvinick, 2013; Westbrook, Kester &
Braver, 2013). Consistent with this, Frederick (2005) found that
steeper discounters were also more likely to give automatic/intuitive
but incorrect responses to the word problems that comprised his
Cognitive Reflection Test (CRT), rather than engaging in the
(potentially effortful) reflection process that would lead to the
correct response. The CRT, as a measure of reflective cognitive style,
correlates with several measures of judgment of decision-making
(Stanovich & West, 1998; Toplak, West & Stanovich, 2011, 2014; West,
Toplak & Stanovich, 2008).
In the present research we ask whether this connection between
intertemporal choice and processing style generalizes across a wider
array of cognitive and social domains than previously described. Using
intertemporal choice data from thousands of subjects (responses on
the Monetary Choice Questionnaire; Kirby et al., 1999), we show that
preferences for more immediate gratification are associated with taking
the path of least cognitive resistance across multiple manifestations:
steeper discounters rely on more automatic (less reflective) strategies
in a variety of choice environments assessing heuristic use and
planning; they prefer less informational complexity in their daily life
(as indicated by scores on the Need for Closure scale and by the
complexity of their preferred news sources); and they hold
interpersonal and religious beliefs that are associated with reductions
in epistemic complexity (endorsing stronger psychologically
essentialist beliefs that the behaviors of others are stable and
predictable, and stronger beliefs in the existence of God and the
afterlife).
2 Methods
2.1 Subjects
We recruited subjects to complete surveys online (N=7894, 59.2%
female, Mage=30.2, SDage=12.0) or in
the laboratory (N=399, 50.9% female, Mage=23.7,
SDage=7.4). Participation took part in independent
waves across which survey materials varied (total of twelve survey
samples). However, subsequent tests confirmed that all results remained
qualitatively similar when controlling for each individual sample, and
therefore these data were aggregated for all of our analyses. Online
surveys were completed by (a) volunteer subjects (N=1542), (b)
students and local residents completing a prescreening survey for the
Harvard University study pool (N=1876), (c) workers on Amazon’s
Mechanical Turk (N=4106), or (d) subjects completing a paid
follow-up survey for a neuroscientific study assessing a wide array of
individual differences (N=370). To provide independent validation for
perceptions of different news media outlets (see News Rankings), we
surveyed an independent sample of workers on Amazon’s Mechanical Turk
(N=257, 46.7% female).
2.2 Measures
Monetary Choice Questionnaire
. Discount rates were determined
from responses to a series of delay/monetary trade-off choices (e.g.,
“Would you rather have $34 today or $50 in 30 days?”). All choices
included a smaller option today, but the two monetary amounts and the
future delay were varied. Assuming a hyperbolic discount function,
these data allow one to estimate the rate at which subjects discount
future rewards. See Kirby et al. (1999) for details on the measure and
how discount rates were estimated from choices (essentially by
identifying the discount rate that best predicted the distribution of
choices for/against a delayed reward).
Discount rates were then log10-transformed to correct for skewness of
the distribution (Kirby et al., 1999). Except in one case (see
Appendix 1), intertemporal choices were hypothetical. Discount rates
estimated based on hypothetical intertemporal choices have been shown
to correspond closely to those based on equivalent incentivized
choices (Johnson & Bickel, 2002; Madden, Begotka, Raiff & Kastern,
2003; Madden et al., 2004), and the predictive validity of such
hypothetical-based discount rates has been multiply confirmed (e.g.,
Alessi & Petry, 2003; Duckworth & Seligman, 2005; Hariri et al.,
2006). Further, for some survey samples the original 27-question
version of the questionnaire was given, which includes nine choices
each for small, medium and large reward amounts (i.e., each set of
nine choices samples indifference points for the same set of discount
rates, but is shifted to points higher or lower along each curve). For
the remaining samples, we included only the set of nine choices at the
medium reward level because (a) we were not interested in “magnitude
effects” on discounting (see Frederick, Loewenstein & O’Donoghue,
2002; Kirby et al., 1999) and (b) we found that discount rates could
be robustly estimated from any of the three sets of nine choices alone
(and among them the medium reward magnitude provided the strongest
estimate). In aggregating across samples, we therefore combine
estimates based only on the medium magnitude rewards (either from
surveys that only included these choices or extracting these nine
choices from the longer surveys). However, all of the temporal
discounting results are highly similar irrespective of incentive level
or number of questions used to estimate one’s discount rate.
Discount rates were not estimated for subjects who neglected to respond
to two or more of the binary choices in the 9-item survey (total of 142
subjects across all surveys; when estimating the discount rate for the
27-item version, this exclusion criterion was four or more). Following
Kirby et al. (1999), we also calculated a measure of choice consistency
for each subject, calculated as the percentage of their nine responses
that were consistent with their estimated discount rate. We exclude
subjects who were less than 75% consistent in their responses (N =
64; 0.8% of total sample), but note that all of our results hold when
including all subjects, and when excluding subjects who were
not 100% consistent (N = 932; 11.4% of total sample). Moreover,
consistency was not significantly correlated with discount rate across
our sample (r(8149) = –0.006, p = 0.60). Finally,
given that smaller sooner rewards on the MCQ do not vary in their delay
(i.e., all would be received ‘today’), we also note that these discount
rates do not distinguish between preferences for immediate
rewards (immediacy bias) and preferences for sooner rewards.
Cognitive Reflection Test (CRT).
The CRT comprises 3 word
problems that reliably elicit automatic/intuitive responses that must
subsequently be rejected in order to arrive at the correct response
(e.g., “A bat and a ball together cost $1.10. The bat costs $1.00
more than the ball. How much does the ball cost?”) (Frederick, 2005).
We scored the CRT in two ways: based on the number of total correct
responses (e.g., 5 cents in the example above) and based on the total
responses that were incorrect but intuitive/automatic (e.g., 10
cents1). While these measures differ
slightly in their sensitivity to different aspects of CRT responding
(i.e., overcoming an automatic lure and/or reasoning to a correct
response; Baron, Scott, Fincher & Metz, 2015; Pennycook, Cheyne,
Koehler & Fugelsang, 2015), they are highly (negatively) correlated.
Subjects were excluded from CRT analyses if they failed to respond
to any of the questions.
We and others have recently shown that CRT scores correlate with belief
in God (Gervais & Norenzayan, 2012; Pennycook, Cheyne, Seli, Koehler
& Fugelsang, 2012; Pennycook, Ross, Koehler & Fugelsang, 2016;
Shenhav, Rand & Greene, 2012). The CRT data reported in this paper
highly overlaps the data reported in Shenhav et al. (2012) but all of
the analyses reported in this paper are new.
Cognitive Ability (Intelligence) Measures.
Subjects in one of
our samples (N = 321) completed the Shipley Vocabulary Test (Shipley,
1986) and the Wechsler Adult Intelligence Scale Matrix Reasoning test
(Wechsler, 1997), standard measures of crystallized and fluid
intelligence, respectively (for additional details, see Shenhav et al.,
2012).
Probability Matching Task.
We used a measure of probability
matching behavior as an additional test of heuristic reasoning. The
test, designed by Koehler & James (2010; see Vulkan, 2000)
involves showing subjects ten cups each of two different colors (in
this case blue and orange). They are told that five-dollar bills are
hidden under 10 of the 20 cups, seven under blue cups and three under
orange cups. Previous studies have shown that some subjects behave
suboptimally on this task by choosing 7–8 blue cups and 2–3 red cups,
referred to as probability matching, whereas others will
behave more optimally by instead choosing 9-10 of the blue cups,
referred to as probability maximizing. Matching versus
maximizing behavior on this task is believed to be driven by greater or
lesser reliance on heuristic reasoning, an assertion supported by the
finding that more intuitive responders on the CRT were more likely to
match than maximize (Koehler & James, 2010).
Two-Step Task.
Adapted from Daw and colleagues (2011), the
two-step task assesses reliance on forms of reasoning that are
referred to as model-based and model-free. The task involves
navigating an environment consisting of two stages and three possible
states (an initial state and two possible states in the second stage),
and trying to maximize rewards (game points). For ease of exposition,
we will refer to these states as Rooms 1, 2A, 2B, but in the actual
task these were represented in more abstract and symbolic terms. Each
trial begins in Room 1. In Room 1 subjects can choose actions A or B
which will lead them probabilistically to Room 2A or 2B – that is,
choosing A landed the subject in Room 2A most of the time (and
otherwise in room 2B), and the reverse was true for Room 2B. These
room-to-room transition probabilities were fixed over the course of
the session such that choosing A led to Room 2A 72% of the time and
Room 2B 28% of the time (and vice versa when choosing B). Subjects
were instructed that these transitions were not deterministic and that
the transition probabilities had to be learned through experience
(this included learning which rooms were more associated with choices
A and B since these rooms weren’t labeled in any way that connected
them to their Room 1 choices).
Once in either of the second rooms (2A or 2B), the subject makes a
second choice (2Ax or 2Ay in Room 2A, 2Bx or 2By in Room 2B), and wins
or loses points based on that choice. The rewards associated with these
four choices (2Ax, 2Ay, 2Bx, 2By) must also be learned, and they also
change over the course of the experiment such that sometimes choosing
2Ax might be the most rewarding and other times choosing 2By might be.
Achieving the best reward on a given trial therefore requires not only
selecting the appropriate choice in the second room (x or y) but also
planning ahead and making the choice in Room 1 that maximizes one’s
likelihood of ending up in the second room with the most rewarding
option (either 2A or 2B).
For example, a subject selects Choice A in Room 1, arrives in Room 2A
(the common room-to-room transition), then selects choice
2Ax, and receives a large reward. On the next trial, she may choose to
repeat the choice of A in Room 1 and the choice of 2Ax in Room 2A in
order to again reach that reward. Now consider a second example: the
subject selects Choice A in Room 1, arrives in Room 2B (the
rare transition), then selects 2By, and receives a large
reward. If the subject considers only the rewards associated with
their recent actions, referred to as model-free learning, she
will once again choose to repeat her previous Room 1 choice (A) in
hopes of arriving at the same large reward. However, if the subject
considers the previous actions, rewards, and the likelihood of
transitioning between rooms (i.e., the underlying world model),
referred to as model-based learning, then she will switch her
previous Room 1 choice and instead choose B in order to maximize her
likelihood of returning to the room with the high reward (in this
example, Room 2B). An individual’s overall tendency towards model-free
versus model-based learning/reasoning can therefore be ascertained by
the degree to which their Room 1 choices are guided only by the Room 2
reward on the previous trial (i.e., win-stay, lose-switch) versus a
combination of previous reward and previous transition probability
(i.e., common-win-stay, common-lose-switch, rare-win-switch,
rare-lose-stay).
The two-step task findings we describe are based on a reanalysis of
unpublished data collected and provided to us by Fiery Cushman.
Subjects in this study performed a web-based version of the two-step
task. The task consisted of 25 practice trials followed by 125 main
trials2. Their goal was to maximize points won over the course of the
experiment. To assess the degree to which behavior on this task was
characterized by model-based planning, we used a regression approach
previously used to relate this task to individual differences in
performance on cognitive control tasks and in devaluation sensitivity
(Gillan, Otto, Phelps & Daw, 2015; Otto, Skatova, Madlon-Kay & Daw,
2015). Specifically, we performed a mixed-effects logistic regression
analysis over Room 1 choices to predict whether subjects would stay
with or switch from their previous Room 1 choice given (i) the reward
received in Room 2 of the previous trial, (ii) whether the specific
Room 2 from the previous trial resulted from a common or rare
transition from Room 1, and (iii) the interaction of A and B. For
reasons described above, and as has been done in previous studies of
this task, we used this final interaction term as an index of
model-based planning on this task: a strong interaction between the
reward and transition type (common/rare) on the previous trial
suggests that the subject applied greater model-based reasoning
whereas a weak interaction suggests that the subject applied less
model-based reasoning. Note that these model-based influences on
behavior are separate from (and may serve to attenuate) the influence
of a basic win-stay/lose-switch strategy (which is indexed by the main
effect of reward [term (i) above]). This mixed-effects regression
included random intercepts and slopes for each subject.
We report findings from two closely related analyses that examine
whether terms in the regression above correlate with individual
differences measures (e.g., discount rate). In keeping with previous
approaches to analyzing individual differences in behavior on this
task (e.g., Gillan et al., 2015; Otto et al., 2015), our primary
analysis utilized a mixed-effects regression that included the
relevant individual differences measure (e.g., discount rate) as a
fixed effect in the regression above, interacting with the two main
effects and their interaction. These interactions between discount
rate and the task variables effectively test for the relationship
between the individual difference measure of interest and the
influence of that variable (or interaction between variables) on
choice. This regression approach enabled us to test for the
relationship between discount rate and one task variable (e.g., the
model-based planning index), while simultaneously accounting for the
relationship between discount rate and the remaining task
variables. However, in order to visualize the relationship between
discount rate and model-based planning, we separately display and
report the bivariate relationship between these two variables based on
the random effect estimates in the reduced regression described above
(i.e., including task variables but not discount rate).
To ensure sufficient within-subject variance for reliable analysis, we
exclude subjects who made the same Room 1 stay/switch decision
(i.e., consistently chose to stay or consistently chose to switch) on
more than 95% of trials (our results are, however, robust to including
these subjects).
News Ranking.
To investigate preferences for sources of more
vs. less complex information, subjects in some surveys were asked
to rank their top 3 networks from the following list, according to how
much they rely on each for their news: ABC, CNN, FOX News, NPR, CBS,
NBC, MSNBC. We analyzed the frequency with which each was given the top
ranking across subjects.
To provide independent validation for the perceived complexity of each
network, we surveyed a separate group of subjects through AMT
(N=257, 46.7% female, Mage = 34.1,
SDage = 12.2) to assess how much they associate each
network with the following terms: ‘intuitive,’ ‘easy to consume,’
‘informative,’ ‘complex/multifaceted,’ (‘entertaining’ was included as
a foil and excluded from our analysis). For each subject and news
network, these four ratings were combined together into a composite
complexity index, after reverse-coding the first two items. We
tested whether the average complexity of a given network (as rated by
these 257 subjects) was related to the discount rates of those (in
the main sample) who indicated this as their top-ranked news source.
Psychological Essentialism.
The Psychological Essentialism
Scale (derived from Bastian & Haslam, 2006) measures the degree to
which subjects perceive individuals as (i) reducible to basic
traits versus (ii) complex and nuanced in their thoughts and behavior.
In particular, we consider two 8-item subscales developed by these
authors: ‘informativeness’ (e.g., “Generally speaking, once you know
someone in one or two contexts it is possible to predict how they will
behave in most other contexts”) and ‘discreteness’ (e.g., “The kind of
person someone is, is clearly defined; they either are a certain kind
of person or they are not”).3 Overall scores were normalized within each of three
different experimental samples before the samples were aggregated, with
higher scores indicating greater endorsement of psychological
essentialism. The results reported are robust to controlling for
differences between samples.
Religious Belief.
Following our previous work (Shenhav et al.,
2012), we primarily used two items to assess religious belief: (A) a
continuous scale indicating belief in God on a 9-point scale from
‘confident atheist’ to ‘confident believer’ (B) a binary response
indicating whether the individual has “had an experience that convinced
[him/her] that God exists.” In addition to these, we included 9-point
items to indicate family religiosity during childhood; whether the
subject had become a much more confident atheist/believer since
childhood; and to indicate strong disagreement to strong agreement with
the following statements: “I spend a considerable amount of time on
religious practices” and “I believe that when someone dies a part of
them continues on to some form of afterlife.” Of these, the measure of
afterlife beliefs was treated as a primary dependent variable,
alongside the continuous and binary measures of belief above; the other
three items were analyzed individually for secondary analyses (e.g., to
test whether discount rate is more closely tied to belief than
practice).
To better compare our findings with previous findings that stand in
tension with our hypotheses (Carter, Mccullough, Kim-Spoon, Corrales
& Blake, 2012; DeWall et al., 2014) (see Appendix 2), subjects in one
of our samples (N = 1022) also responded to the Religious Commitment
Inventory (Worthington et al., 2003), the primary measure of religious
belief/practice from those studies (example item: “I often read books
and magazines about my faith”).
Demographic Variables.
We performed secondary analyses
that included a range of demographic variables as covariates. In
addition to gender and age (log-transformed to correct for positive
skew), these covariates included education variables (both one’s own
education level and the highest education level reached by each
parent), socioeconomic status (current income level and family income
level during childhood), and political affiliation/conservatism (US
party affiliation and scalar measures of self-reported social and
fiscal conservatism). Subjects indicated the highest education level
obtained (at present) by themselves and by their biological parents
using the following options: less than a high school degree, high
school diploma, vocational training, attended (or currently attending)
college, bachelor’s degree, graduate degree, unknown. We assessed
immediate family income level during childhood with a Likert-type
rating along a subjective scale ranging from ‘low’ to ‘average’ to
‘high.’ The subject’s own income in the previous year was reported on
an 8-point scale ranging from ‘$15,000 or less’ to ‘over $100,000.’
Subjects separately rated their social and fiscal conservatism on
9-point scales ranging from ‘Very liberal’ to ‘Very conservative.’ For
one sample (the prescreen survey, N=1876), we used an item asking “How
would you describe your family’s social class position?” (with
responses ‘Poor,’ ‘Working class,’ ‘Middle Class,’ ‘Upper middle
class,’ and ‘Upper class’) as the measure of socioeconomic
status. Education level, current income, and family social class were
treated as (discrete) ordinal variables, gender and party affiliation
as nominal variables, and the remaining demographic measures were
treated as continuous variables.
Note that samples varied in which of these variables were collected, and
thus not all analyses included the same set of covariates.
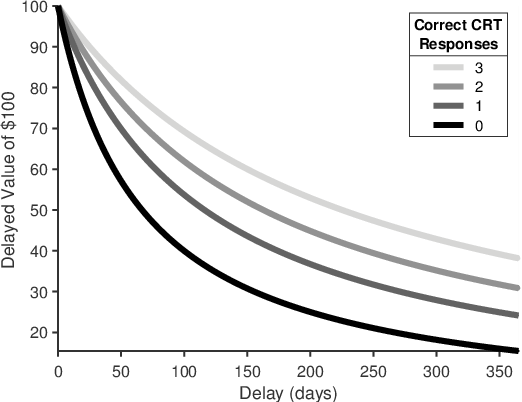
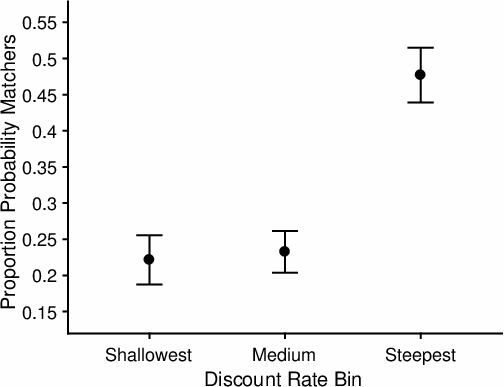
A [b]3in
B
Figure 1: Temporal discounting and choice behavior. A)Left: Steeper discounters give fewer correct and more
intuitive responses on the CRT. Average numbers of correct/intuitive
responses are shown for individuals with discount rates in the
lowest, mid, and highest tertiles of our sample. Higher versus lower
discount rates reflect steeper versus shallower discounting
functions. (Note that a continuous measure of discount rate is used
for all statistics in the main text, but these values were binned
for ease of display in figures.) Right: For illustrative
purposes we show projected discounted value of $100 over the course
of a year for subjects who gave 0–3 correct CRT
responses. B) Steeper discounters are more likely to apply
a probability matching rather than a probability maximizing strategy
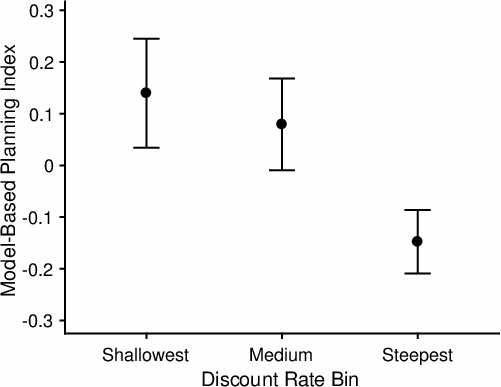
in a one-shot probabilistic gamble. C) Steeper discounters
are less likely to use a model-based strategy in the two-step
task. Higher model-based index values reflect a stronger interaction
between previous reward and previous transition probability when
making a stay/switch decision on Stage 1 of the current trial.
(Note that values on the y-axis represent random effect estimates
from a mixed-effects regression. Zero therefore represents the
fixed-effect slope across the group – which is significantly greater
than zero – rather than representing no effect of this interaction.)
Error bars represent s.e.m.
3 Results
Subjects (N=8293, 58.8% female) completed the Monetary Choice
Questionnaire (MCQ; Kirby et al., 1999), a standard measure of
temporal discounting consisting of a series of binary forced-choice
questions between a given amount of money today or a larger amount
received some days in the future. From the responses to these binary
choices we can estimate each subject’s overall preference for sooner
over delayed rewards, summarized as a single value: her discount rate.
(See Methods.) Higher discount rates reflect a steeper
discount function and thus greater overall preference for smaller
sooner rewards over larger delayed rewards; conversely, lower discount
rates reflect a shallower discount function and therefore
greater weight on larger delayed rewards (see Figure 1A, right; note
also that our analyses will always refer to discount rates that have
been log-transformed in order to correct for skew, as is
standard). The average discount rate (raw: Mgeom =
0.0076, SD = 0.05; log: Marithm = –2.1; SD = 0.8) and
the proportion of an individual’s choices consistent with their
discount rate (M = 0.98; SD = 0.05) were similar to those previously
reported using the MCQ4 (Kirby et al., 1999).
Table 1: Summary of correlations between intertemporal choice
and key variables of interest. Each row reflects the zero-order
correlation between discount rate and a given variable. The correlation
with the model-based index is based on individual random effect
estimates from the mixed-effects regression reported in the main text.
† denotes point-biserial correlation between discount
rate and binary variable. All other correlations are Pearson’s
r values. See also Table A1 for correlations of these
variables with each item from the discounting measure separately.
Variable
N
Corr (r)
p-value
BMI
5094
0.078
<.0001
Smoker
1838
0.175†
<.0001
Intuitive CRT responses
2286
0.200
<.0001
Correct CRT responses
2286
-0.252
<.0001
Probability matcher
538
0.233†
<.0001
Model-based planning
265
-0.183
0.003
Need for closure
1833
0.073
0.0019
Twitter use
1005
0.077
0.015
Reddit use
1005
-0.018
0.568
Complexity of preferred news
1282
-0.139
<.0001
Essentialism
881
0.106
0.0016
Genetics of race & behavior
1788
0.088
0.0002
Belief in God
7577
0.104
<.0001
Convinced of God
6454
0.097†
<.0001
Belief in afterlife
6454
0.083
<.0001
Steeper temporal discounting, as estimated from these intertemporal
choices, has been associated with greater impulsivity related not only
to monetary rewards (reflected, e.g., in gambling behavior; Alessi &
Petry, 2003), but also to food, nicotine, and other drugs (reflected,
e.g., in body mass index (BMI) and smoking; Baker, Johnson, & Bickel,
2003; Duckworth et al., 2010; Jarmolowicz et al., 2014; Kirby et al.,
1999; Reimers et al., 2009). Similarly, we found that steeper monetary
discounting was associated with significantly higher BMI
(r(5092) = 0.08, p<0.0001) and greater
likelihood of being a current smoker
(rpoint-biserial[pb](1836) = 0.17,
p<0.0001).5 These results help to validate our
estimated discount rates by showing that they are correlated with
impulsivity for other extrinsic rewards beside money, in a manner
consistent with previous research.
Having provided this validation, we now use these revealed discount
rates to test the hypothesis that temporal discounting is related to a
tendency toward less reflective (or more automatic) processing across
four domains: problem-solving strategies, decisions about information
consumption, beliefs about others, and beliefs about the divine. As
described above, the data presented here are the aggregation of a
series of different datasets, such that each subject completed only a
subset of the measures related to one or more of these domains.
Therefore, analyses presented below include all subjects who completed
the measure under consideration (see Table 1 for summary statistics for
each result). Furthermore, the covariates that were collected varied
across datasets, and so correspondingly our secondary analyses vary in
which covariates they include.
3.1 Discounting and problem-solving
We first tested whether steeper discounters were more likely to use
simplifying strategies when problem-solving. We tested this using
three indices of such behavior: intuitive (versus reflective)
responding to mathematical word problems (CRT), probability matching
(versus maximizing) on a one-shot probabilistic gamble, and model-free
(versus model-based) decision-making in a repeated multi-stage choice
task. First, replicating previous findings using different measures
of temporal discounting, we found that steeper temporal discounters
were significantly more likely to give intuitively compelling but
incorrect responses, and less likely to give correct responses, on the
CRT (Figure 1A; rcorrect(2284) =
–0.25, rintuitive(2284) = 0.20,
p<0.0001). We also extended this prior work by
showing that the relationship between discounting and CRT is still
present (N=321; rcorrect(319) =
–0.16, rintuitive(319) = 0.15,
ps<0.01) within a subset of our sample in which
measures of cognitive ability were collected and found to be
uncorrelated with discount rate (fluid IQ: r(318) = –0.026,
p = 0.64; crystallized IQ: r(313) = –0.066,
p = 0.24). These results suggest that general cognitive
ability cannot account for the correlation we observed between
discount rate and CRT.
Second, we tested whether discount rate correlated with use of a
probability matching heuristic (Koehler & James, 2010; Vulkan, 2000).
As noted earlier, when individuals allocate resources between two
options that have different (and complementary) probabilities of
winning (e.g., 70% versus 30%) they will occasionally rely on a
heuristic of splitting their resources in a way that approximates
these probabilities (e.g., 70% to the first option, 30% to the
second; i.e., matching) rather than placing all of their
resources with the higher probability option (i.e.,
maximizing). We had subjects perform a single one-shot
decision task that differentiated these two types of behavior (see
Methods) and found that steeper discounters were more likely to engage
in probability matching (Figure 1B;
rpb(536) = 0.23,
p<0.0001). Performance on this task was previously
shown to correlate with performance on the CRT (Koehler & James,
2010). We replicate this finding (CRT accuracy:
rpb(532) = –0.32, CRT intuitive:
rpb(532) = 0.32,
p<0.0001). Both discount rate and CRT were
significantly correlated with probability matching in combined models
containing discount rate and either CRT measure (CRT accuracy:
rpb_partial_CRT = –0.29,
rpb_partial_MCQ = 0.13; CRT
intuitive: rpb_partial_CRT = 0.28,
rpb_partial_MCQ = 0.148,
ps<0.0001).
Third, we tested whether discount rate was correlated with
decision-making approaches in a more complex choice environment. Using
a modified version of the well-validated “two-step” task (see
Methods), we assessed preferences for deliberating based on a rich
internal model of one’s environment (model-based
decision-making) versus choosing one’s actions based only on recent
reward history (model-free decision-making). Using our index
of model-based decision-making, we found that steeper discounters were
significantly less model-based in their decisions (N = 265, coeff =
0.20, SE = 0.07, z = 3.08, p=0.002; Figure
1C). While this correlation is consistent with our predictions, we
note that steeper discounters were also less sensitive to payoff
levels (coeff = –0.10, SE = 0.04, z = –2.39,
p=0.02), which we did not predict and may suggest that these
subjects were to some degree less attentive. Discount rate did not,
however, correlate with overall rates of staying with versus switching
from a previous choice (coeff = –0.06, SE = 0.07, z =
–0.77, p=0.44) or with the sensitivity of choices to the
transition probability of the previous trial (i.e., whether or not it
was an uncommon transition; coeff = 0.04, SE = 0.04, z =
1.03, p=0.30).
3.2 Discounting and information consumption
AB
C
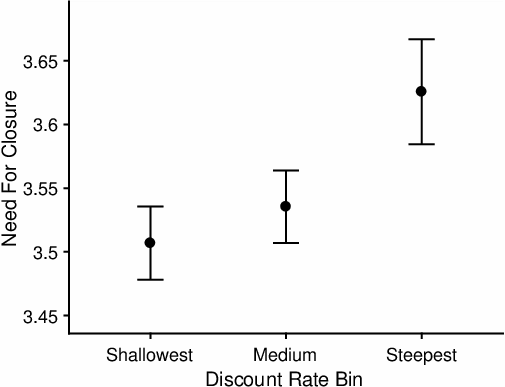
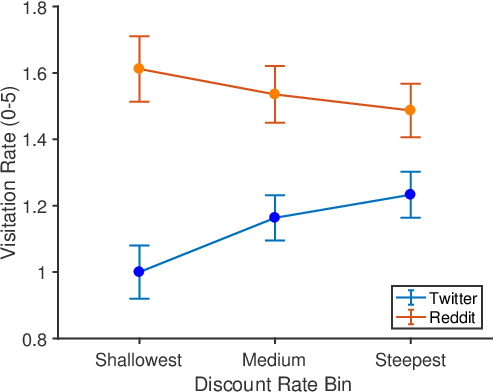
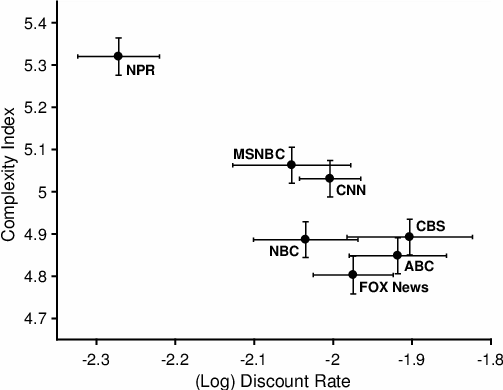
Figure 2: Temporal discounting and preference for reduced
epistemic complexity. A) Steeper discounters score higher on the Need
for Closure scale. B) Steeper discounting is also positively
correlated with frequency of checking Twitter (blue) but not Reddit
(orange; which only reveals a non-significant negative trend in the
opposite direction). C) Discount rate (x-axis) accounts for
significant variance in individuals’ choices of news media outlet, with
the shallowest discounters reporting the greatest preference for NPR as
their primary source of news. Similar patterns are found when assessing
how complex/informative (versus intuitive/easy to consume) a given
network is (y-axis), with NPR again standing out as significantly
different than the remaining networks. Values on the y-axis represent
average ratings on a composite complexity index, after controlling for
potential confounds (e.g., related to familiarity and political
leaning); these complexity ratings were given by a different sample of
subjects from the discount rates. Error bars represent s.e.m.
These results so far suggest that steep reward discounters tend to
rely on simplifying or more cognitively impulsive strategies in
different problem-solving and decision-making domains. To assess
whether these tendencies translated into preferences for simplicity in
their consumption of information, we tested for a correlation between
discount rate and a 15-item version of the Need for (Cognitive)
Closure scale (Roets & Hiel, 2011; example item: “I dislike it when a
person’s statement could mean many different things”; NFC; Webster &
Kruglanski, 1994). This self-report measure of cognitive disposition
has been used to explain variation in ideological extremism,
particularly for political or otherwise group-centered ideology.
Consistent with our prediction, we found a significant positive
correlation between discount rate and NFC score (Figure 2A;
r(1831) = 0.073, p< 0.002): steeper
discounters report a greater preference for information/solutions to
be provided to them in simpler, more immediate, and more predictable
form rather than in a more complex or ambiguous form.
Given the relationship between discount rate and NFC, we might also
expect individual differences in temporal discounting to predict how
people prefer to acquire new information. Specifically, we predicted
that steeper discounters prefer information that is presented in a
less complex fashion and is thus faster/easier to consume (and perhaps
provides sooner epistemic gratification). We tested this in two
ways. First, we examined whether discounting was correlated with use
of the social media platform Twitter, given its emphasis on short-form
messaging. Subjects indicated how often they use Twitter on a
six-point scale ranging from “never” to “at least once an hour.” For
comparison, we asked how often those same subjects visited the
longer-form blog site, Reddit. We found that steep discounters did in
fact spend more time using Twitter (r(1003) = 0.08,
p< 0.02) but not Reddit (r(1003) =
–0.02, p = 0.57), and the difference between these
correlations was significant (z = 2.13, p=0.03;
Figure 2B).6
Second, we asked subjects to rank their preferred media for obtaining
news, including major broadcast and cable television networks and
public radio (all U.S.-based news sources). We found an association
between discount rate and subjects’ choice of top-ranked news source
(Figure 2C; (6, 1282) = 29.8, p<0.0001), with the
shallowest discounters being most likely to prefer National Public
Radio.7
To provide evidence that the pattern we observed for news preferences
corresponded to the complexity of information offered by these
different news sources, we surveyed an independent group of subjects
(N=257, 46.7% female, Mage = 34.1,
SDage = 12.2) regarding their associations for each
network. Specifically, we generated a composite complexity
index based on how much each network was positively associated with
being ‘informative’ and ‘complex/multifaceted’ and negatively
associated with being ‘intuitive’ and ‘easy to consume.’ We then
tested for variation in this index as a function of news outlet, while
including as covariates demographic and political variables, average
time investment in TV/internet/radio/podcasts, familiarity with and
reliance on each network, and how much subjects felt that the
individuals on that network shared their views. We found that the news
networks significantly varied in complexity (F(6,1310) =
25.3, p<0.0001; Figure 2C), with a pattern similar
to that observed for discount rate. In particular, NPR was associated
with significantly greater complexity than any other network, and
MSNBC/CNN were further associated with greater complexity than the
remaining networks (Tukey’s HSD ps <
0.03).8
Furthermore, we found that the discount rates of subjects in the
previous sample significantly (negatively) correlated with the average
network complexity of those subjects’ top-ranked news source (ordinal
logistic regression, χ2 (6, 1297) = 18.1,
p<0.0001;
rspearman(1280) = –0.12,
p<0.0001); as predicted, steeper discounters
preferred news sources that were less complex and easier to consume.
While these findings support the hypothesis that informational
complexity played a role in steeper discounters preferring certain
news sources to others, they are qualified by the fact that our
measure of complexity was based on subjective ratings (from an
independent set of raters) rather than more objective analyses of news
content.
3.3 Discounting and simplifying beliefs
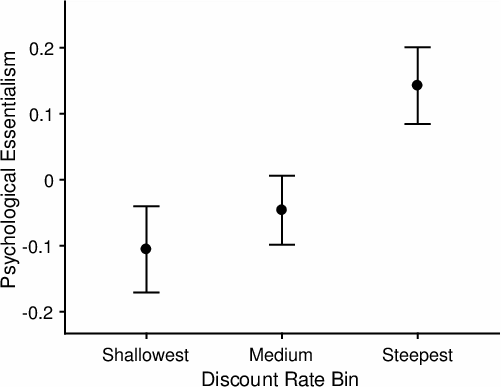
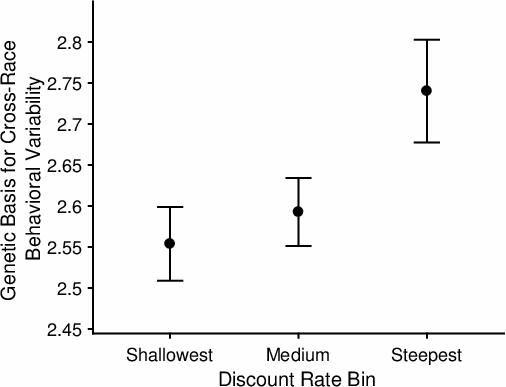
A
B
Figure 3: Temporal discounting and beliefs about others.
Steeper discounters A) score higher on a (z-scored) measure
of belief in psychological essentialism and B) attribute
behavioral differences between races to a combination of causes
favoring genetic factors more and environmental factors less.
We next asked whether steep discounting correlates with adherence to
beliefs that reduce epistemic complexity regarding our surroundings,
including the individuals that inhabit it. A classic example of this
from research on person perception is the belief that a person’s
character is stable and allows for generalization of their behavior
across varying contexts (Gelman, 2003). Such “psychologically
essentialist” beliefs can help to reinforce our automatic tendency to
perceive others through the lens of broad categories/stereotypes
rather than engaging in the effort of correcting for the individual’s
own history and current situation (Fiske & Taylor, 1991; Gilbert &
Hixon, 1991; Gilbert, Pelham & Krull, 1988). We therefore tested
whether discount rate was correlated with the degree to which people
endorse a psychologically essentialist perspective. We found that
subjects’ scores on a scale of psychological essentialism (Bastian &
Haslam, 2006) were significantly positively correlated with their
discount rate (Figure 3A; r(879) = 0.11, p< 0.002). In a separate sample we examined responses to the
question “Are behavioral differences between racial groups due more to
genetic factors or environmental factors?” (where responses were given
on a 7-point scale ranging from “completely due to genetic factors” to
“equally due to genetic factors and environmental factors” to
“completely due to environmental factors”; our analyses reverse-score
this item so that higher values favor genetic influences). Consistent
with the essentialism result, we found that steeper discounters were
also more likely to attribute cross-race behavioral differences to
genetic rather than environmental factors (Figure 3B; r(1786)
= 0.09, p< 0.0002). Essentialism and the measure
of racial differences were positively correlated with both social and
fiscal conservatism (rs> 0.10, ps< 0.002).9
A
B
C
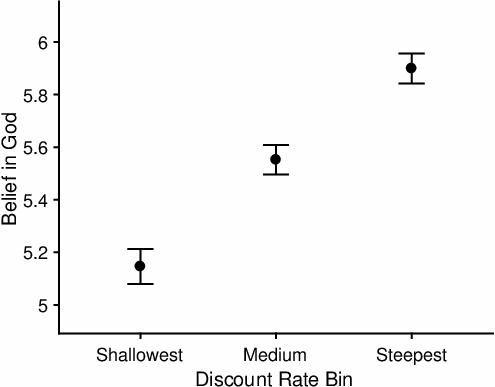
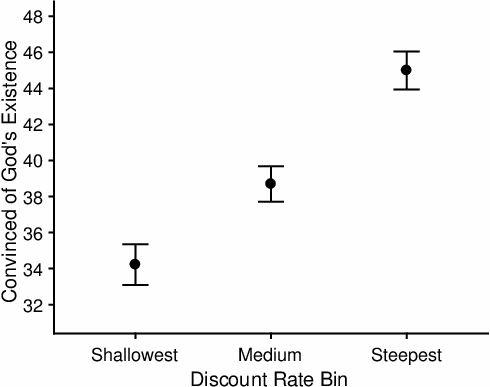
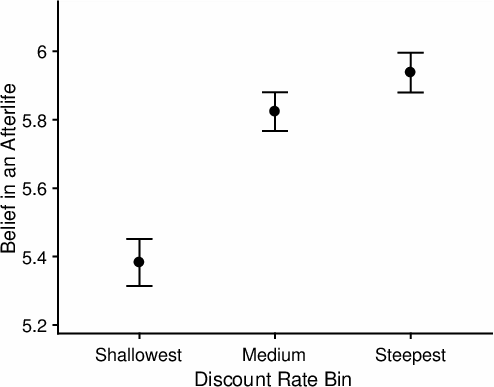
Figure 4: Temporal discounting and beliefs about the divine.
Steeper discounters A) have stronger beliefs in God,
B) are more likely to be convinced of God’s existence through
their own experience, and C) believe more strongly in an
afterlife.
Given that steeper discounters hold stronger beliefs in essentialism,
we sought to test whether the predicted relationship would hold for a
different set of beliefs related to belief in the divine. Previous
work suggests that these too have the ability to provide simple
explanations for complex phenomena, and that these beliefs are closely
tied to early developing beliefs and cognitive approaches that offer
automatic but often incorrect insights into one’s environment (e.g.,
anthropomorphism, dualism, and promiscuous teleology: Bloom, 2007;
Kelemen, 2004; Lupfer, Tolliver & Jackson, 1996; Preston & Epley,
2005; Shenhav et al., 2012). Accordingly, we find a positive
relationship between discount rate and both a Likert-scale measure of
belief in God (r(7575) = 0.10, p< 0.0001)
and a binary forced-choice measure of having convincing evidence of
God’s existence (rpb(6452) = 0.10,
p< 0.0001) (Figure 4A-B). Thus a greater
preference for sooner reward (steeper discounting) was associated with
more confident belief, while the opposite (shallower discounting) was
true of more confident non-believers (atheists)10, an association that held similarly when only
testing a subsample of subjects whose discounting choices were
incentivized rather than hypothetical (Appendix 1). (A subsequent
analysis, also reported in Appendix 1, sought to reconcile these
correlations with findings suggesting the opposite relationship
between discounting and religiosity (Carter et al., 2012; DeWall et
al., 2014); using the same materials as this prior work and a larger
sample, we replicated our finding of a positive relationship between
belief and discount rate, failing to observe the negative relationship
these studies describe.)
A natural question is whether these findings regarding divine beliefs,
or those described above regarding media preferences and essentialism,
are actually driven by political beliefs. Perhaps surprisingly, we
found no significant relationship between discount rate and subjects’
preference between the two major American parties (Democratic vs.
Republican; rpb(2558) = 0.003,
p = 0.90).11 This appears to be related to the fact that, while
discount rate is significantly correlated with social conservatism
(r(6489) = 0.08, p< 0.0001; consistent
with the relationship observed between discount rate and religious
belief above), discount rate is not related to fiscal
conservatism (r(6469) = –0.005, p = 0.71).
We further found that the correlation between discount rate and belief
in God was robust (rpartial(5590) =
0.08, p< 0.0001) to including the level of
religious practice as a covariate, whereas discount rate did
not significantly correlate with level of religious practice
(rpartial(5590) = 0.0001, p
= 0.99) when including belief in God as a covariate. Discount rate also
did not significantly correlate with level of religious practice when
focusing only on individuals who rated themselves above the midpoint
of the religious belief scale, r(2928) = –0.01, p =
0.61. Thus, we find no evidence for the hypothesis that steeper
discounters are more likely to attend church or pray (e.g., as a
self-regulatory strategy, attempting to rein in their impulsive
tendencies), except insofar as those practices are driven by belief in
God.
Similar to previous findings with CRT (Shenhav et al., 2012), we find
that discount rate is correlated with change in religious belief since
childhood (assessed retrospectively;
rpartial(5742) = 0.074, p< 0.0001), such that more shallow discounters report having
become more atheist over time, but that discount rate is not
significantly correlated with familial religiosity during one’s
upbringing (rpartial(5742) = 0.010,
p = 0.43).
In sum, the relationship between discount rate and religiosity was
particularly tied to what individuals believed rather than how they
acted on it, and how these beliefs were shaped over time rather than
where they started out. The correlation between steep discounting and
belief, but not practice, is consistent with the overarching theory
that steep discounters prefer not to modify a potentially prepotent
inclination towards believing in God (i.e., are less reflective;
Gervais & Norenzayan, 2012; Pennycook et al., 2012; Shenhav et al.,
2012) but they refrain from making the effort that religious practice
requires. Subsequent analyses also revealed previously unreported
relationships between lower belief in God and both lower likelihood of
probability maximizing and greater model-based planning on the
two-stage task described earlier (Appendix 2).
Interestingly, we also found a significant positive relationship between
discounting and belief in an afterlife (Figure 4C; r(6452) =
0.08, p< 0.0001). In other words, individuals who
have a stronger preference for sooner rewards are more likely
to believe that they will continue on to a (presumably everlasting)
afterlife. While perhaps surprising from a normative perspective (i.e.,
people who have longer time horizons and/or spend their life
anticipating later reward would not be expected to sacrifice potential
gains to get reward sooner), these results are entirely consistent with
a psychological framework that suggests that steeper discounting biases
an individual toward sooner epistemic gratification, which
belief in God may provide.
4 Discussion
We have shown that preferences for sooner monetary gratification are
associated with more automatic and/or less reflective cognitive
tendencies across domains (Table 1). When it comes to problem-solving,
steeper discounters are more likely to give false but immediately
appealing answers to math problems, more likely to apply a sub-optimal
probability matching heuristic in a one-shot gamble, and less likely to
rely on optimal planning in a two-stage decision task. In the epistemic
domain, steep discounters report greater Need for Cognitive Closure,
prefer short-form social media (Twitter over Reddit), and eschew the
(potentially more complex and multifaceted) news of National Public
Radio relative to other new sources. Likewise, steeper discounters are
more likely to hold simplifying, essentialist beliefs about the causes
of human behavior. Finally, in the domain of religion, steeper
discounters are more likely to believe in God — a belief that is
arguably highly simplifying (Bloom, 2007; Lupfer, Tolliver & Jackson,
1996; Preston & Epley, 2005; Shenhav et al., 2012) — and are more
likely to have increased their belief in God since childhood. And yet,
steep discounters are not more likely to engage in religious practice
per se.
This behavioral pattern is not simply a collection of tendencies that
happen to hang together. Instead, it follows naturally from a
dual-process framework for understanding judgment and decision-making
(Evans, 2008; Evans & Stanovich, 2013; Kahneman, 2003; Shiffrin &
Schneider, 1977; Sloman, 1996, 2014). To begin, there is substantial
evidence that steep discounting results from placing increased weight
on automatic/intuitive processes favoring sooner rewards over more
controlled/reflective processes favoring larger delayed rewards
(Figner et al., 2010; McClure & Bickel, 2014; McClure, Laibson,
Loewenstein & Cohen, 2004; Metcalfe & Mischel, 1999; but see also
Kable & Glimcher, 2007, 2010). Likewise, CRT responses (Frederick,
2005), reliance on model-free vs. model-based valuation (Otto,
Gershman, Markman & Daw, 2013; Smittenaar, FitzGerald, Romei, Wright
& Dolan, 2013), probability matching vs. maximizing (Koehler &
James, 2010), attributing behavior to durable traits vs. situational
factors (Gilbert & Hixon, 1991; Gilbert et al., 1988), and
(dis)belief in God (Gervais & Norenzayan, 2012; Pennycook et al.,
2012; Shenhav et al., 2012) have all been characterized in
dual-process terms. Separately, these findings indicate that, within a
specific domain, there is a tension between more automatic/intuitive
processes and more controlled/reflective processes (Pennycook,
Fugelsang & Koehler, 2015). The present results, in concert with this
literature, suggest that these cognitive tensions are related within
individuals. More specifically, we find that behaviors and preferences
that have been associated with a tension between automatic and
controlled processes in each case are also related to the fundamental
tension between smaller sooner and larger later rewards. Central to
this synthesis is the idea that deploying certain kinds of
problem-solving strategies, choosing certain kinds of information
sources, forming certain kinds of beliefs about others, and forming
certain kinds of religious beliefs may be manifestations of a more
general tendency toward more immediate gratification.
Importantly, the current study cannot distinguish between two
manifestations of controlled processing that have been explored in the
individual differences literature. One of these focuses on an
individual’s propensity to overcome prepotent biases (e.g., discarding
an intuitive but incorrect CRT response) whereas the other focuses on
the degree to which an individual engages in reasoning or reflection in
order to maximize for accuracy over speed in their response
(independently of whether this is directed away from a prepotent bias;
Baron et al., 2015; Kagan, 1966). Previous findings have offered reason
to favor the latter (variability in reflection) in certain situations,
for instance showing that belief in God is more strongly correlated
with CRT accuracy than the number of intuitive responses given on this
test (Pennycook, Cheyne, et al., 2015), and that utilitarian moral
reasoning can be predicted by performance on CRT-like problems that
lack an intuitive lure (Baron et al., 2015). In the context of the
current study, these findings raise the question whether shallow
discounters exhibit different patterns of behavior and preferences
because of their propensity to overcome an impulse towards a more
immediate (perhaps epistemic) reward or their propensity to
engage in the kind of reflection/prospection that favors longer-term
reward. Whatever the case may be, both the override of a default and
reflective/prospective reasoning have been argued to reflect modes of
increased control and decreased automaticity (e.g., both have been
shown to be susceptible to dual-task interference) (Braver, 2012;
Kurth-Nelson, Bickel & Redish, 2012; Otto et al., 2013; Otto, Taylor,
& Markman, 2011). Because both mechanisms strain against more
automatic modes of processing, and may thus require cognitive effort
(e.g., James, 1891; Norman & Shallice, 1986; reviewed in Kool,
Shenhav & Botvinick, in press; Westbrook & Braver, 2015), for
convenience we have referred to their collective influences using the
coarse terminology of the path of least cognitive resistance. However,
future work should more carefully tease apart the relative
contributions of different types of control to the current findings.
With respect to religious belief, the current work extends prior
findings (Gervais & Norenzayan, 2012; Pennycook et al., 2012; Shenhav
et al., 2012) confirming the dual-process prediction that belief in God
will be associated with steeper discounting. The success of this
prediction is significant because the opposite prediction has a clear
rationale: Most religions place high value on patience and restraint,
both in explicit teachings and in the provision of maximally large
delayed rewards for the faithful (Carter et al., 2012). Nevertheless,
the present results suggest that believing in God can be understood as
the claiming of a cognitive reward in the present, rather than or in
addition to being a commitment to claiming divine rewards in the
future. However, while these and previous findings are consistent with
the possibility that belief in God is more intuitive than disbelief (at
least in American culture), as suggested above these findings are also
consistent with the possibility that disbelief results from greater
reflection in the absence of an automatic lure (though the fact that
reflection appears to bias belief in a particular direction would still
need to be explained).
Along similar lines, we connect steeper discounting to the formation
of simplifying beliefs in the domain of social cognition. Once again,
people who are drawn more strongly to sooner rewards are more likely
to exhibit psychological essentialism, attributing other people’s
behavior to stable traits rather than to dynamic situational factors.
Importantly, our measure of psychological essentialism is associated
with greater endorsement of racial/ethnic stereotypes (Bastian &
Haslam, 2006), stigmatization of outgroup members (Howell, Weikum &
Dyck, 2011), and quicker orientation toward ingroup-related cues
(Bastian, Loughnan & Koval, 2011). Building on these results, we find
that steep discounters are also more likely to ascribe genetic (rather
than environmental) causes to the behavioral differences that
differentiate races. These findings are broadly consistent with
previous work showing that NFC correlates with intergroup/interracial
attitudes (Roets & Hiel, 2011; Webster & Kruglanski, 1994), and
indeed NFC correlated with both essentialism and this gene-environment
measure in our data12. Understanding the relationship
between reward-related impulsivity and prejudice may provide insight
into alternative approaches to reducing outgroup bias. We note that
political conservatism was also associated with both of these measures
of essentialism, and cannot be ruled out as a partial mediator, but it
is equally notable that discount rate was reliably correlated only
with social rather than fiscal conservatism (and not party affiliation
more generally). The latter finding underscores the connection between
discount rate and belief in God, since such beliefs are also tied
specifically to social conservatism.
Finally, we connect steeper discounting to people’s preferred sources
of information. Given the importance of having a well-informed
electorate, the association between need for epistemic gratification
and news consumption could have important implications for public
policy, and deserves further exploration. Given the connections drawn
here between steeper discounting and a broad range of distinct
behaviors, it seems likely that preferring simpler news is, at least
in part, a consequence of a more general preference for sooner
rewards. It is also possible, however, that consuming simpler news
reinforces a preference for sooner reward more generally. If the
causal arrows go in both directions, this could produce a feedback
cycle whereby people prone to favor sooner rewards favor news sources
that deliver such rewards, which in turn strengthens the preferences
for such news sources. However, it also bears emphasizing that our
interpretation of news network complexity was based on subjective
ratings of a limited set of news organizations. While there are some
benefits to using subjective rather than objective metrics (e.g.,
choices of news consumption are likely to be driven more by the former
than the latter), these explicit ratings are susceptible to demand
characteristics and other factors that may increase their noise as a
proxy for perceptions of complexity. Future work should therefore
compare discount rate with more direct estimates of news complexity,
related to the content of the news conveyed by these and other
organizations.
The ability to delay more immediate gratification and “grit” (the
continued exercise of self-control in pursuit of long-term goals) have
both been found to be reliable predictors of academic achievement
(Duckworth & Seligman, 2005; Mischel et al., 1989). The possibility
that such measures may in certain cases have predictive power over and
above (or even exceeding that of) standard measures of cognitive
ability (suggested by Duckworth & Seligman, 2005; but see Westfall
& Yarkoni, 2016) has important implications for education policy
(Tough, 2012). Other work has distinguished cognitive style and, more
specifically, the reliance on heuristic thinking, from the kind of
mental ability measured by traditional intelligence tests (Stanovich,
2009; Stanovich & West, 1998; West et al., 2008;for a more
integrative perspective of intelligence, see Baron, 1985). The present
results suggest a connection between these sets of findings and the
non-intelligence factors they highlight. Answering difficult questions
often requires resisting “easy answers” that promise an immediate
payoff at a low cognitive cost (Epley & Gilovich, 2006; Frederick,
2005; Kahneman, 2003). Thus, the ability to delay gratification may be
essential for academic achievement, not simply because academic
achievement requires an extended effort, but because the pursuit of
knowledge is, at a cognitive level, more like the pursuit of material
rewards than one might think, with easy answers functioning like
readily available marshmallows. One might naturally think of learning
as a long-term goal that competes with more immediately gratifying
activities — “books versus beer” (cf. Kurzban, Duckworth, Kable &
Myers, 2013). However, the present results extend earlier findings
suggesting that there is a parallel tension within the world of
“books”, including actual books such as religious texts and math
textbooks, as well as other sources of ambiguous information, such as
radio stations and gossip.
It is important to note that our results cannot speak directly to the
nature of the correlation between intertemporal choice and the other
measures examined, and it is also important to note that the strengths
of the correlations themselves are small to moderate by the standards
of individual differences research13 (Gignac & Szodorai, 2016) – there is no doubt that many
other factors, including upbringing and social environment, also
contribute to the development of these preferences and behaviors. The
correlations we observed do, however, hint at the existence of a
surprisingly broad cognitive phenotype extending across a range of
behaviors. Some are purely self-regarding, while others are social.
Some involve inherent uncertainty while others relate to questions with
clear answers. Some involve tricky laboratory tests while others
concern everyday choices. Some are about this world, while others are
about the next. The feature that all of these tendencies seem to share
is a broader inclination to take, or resist, what we have referred to
as the cognitive path of least resistance. We hope that future research
sheds light on the nature of this underlying cognitive factor, and
whether it represents an extension of intertemporal choice per se, or
whether steep discounting simply represents one manifestation of this
broader inclination.
References
Alessi, S. M., & Petry, N. M. (2003). Pathological gambling severity is
associated with impulsivity in a delay discounting procedure.
Behavioural Processes, 64(3), 345–354.
Baker, F., Johnson, M. W., & Bickel, W. K. (2003). Delay discounting in
current and never-before cigarette smokers: Similarities and
differences across commodity, sign, and magnitude. Journal of
Abnormal Psychology, 112(3), 382–392.
Baron, J., Scott, S., Fincher, K., & Metz, S. E. (2015). Why does the
Cognitive Reflection Test (sometimes) predict utilitarian moral
judgment (and other things)? Journal of Applied Research in
Memory and Cognition, 4(3), 265–284.
Bastian, B., & Haslam, N. (2006). Psychological essentialism and
stereotype endorsement. Journal of Experimental Social
Psychology, 42(2), 228–235.
Bastian, B., Loughnan, S., & Koval, P. (2011). Essentialist beliefs
predict automatic motor-responses to social categories. Group
Processes & Intergroup Relations, 14(4), 559–567.
Bloom, P. (2007). Religion is natural. Developmental Science,
10(1), 147–151.
Braver, T. S. (2012). The variable nature of cognitive control: a dual
mechanisms framework. Trends in Cognitive Sciences, 16(2),
105-112.
Buhrmester, M., Kwang, T., & Gosling, S. D. (2011).
Amazon’s Mechanical Turk: A New Source of Inexpensive,
Yet High-Quality, Data? Perspectives on Psychological Science,
6Journal of Personality and Social Psychology, 42(1).
Carter, E. C., Mccullough, M. E., Kim-Spoon, J., Corrales, C., & Blake,
A. (2012). Religious people discount the future less. Evolution
and Human Behavior, 33(3), 224–231.
Clark, L., Robbins, T. W., Ersche, K. D., & Sahakian, B. J. (2006).
Reflection impulsivity in current and former substance users.
BPS, 60(5), 515–522.
Daw, N. D., Gershman, Samuel J., Seymour, B., Dayan, P., & Dolan,
Raymond, J. (2011). Model-based influences on humans’
choices and striatal prediction errors. Neuron, 69(6),
1204–1215.
DeWall, C. N., Pond, R. S., Carter, E. C., Mccullough, M. E., Lambert,
N. M., Fincham, F. D., & Nezlek, J. B. (2014). Explaining the
relationship between religiousness and substance use: Self-control
matters. Journal of Personality and Social Psychology, 107(2),
339-351.
Duckworth, A. L., & Seligman, M. E. P. (2005). Self-discipline outdoes
IQ in predicting academic performance of adolescents.
Psychological Science, 16(12), 939–944.
Duckworth, A. L., Tsukayama, E., & Geier, A. B. (2010). Self-controlled
children stay leaner in the transition to adolescence.
Appetite, 54(2), 304–308.
Eigsti, I., Zayas, V., Mischel, W., Shoda, Y., Ayduk, O., Dadlani, M.,
…Casey, B. (2006). Predicting cognitive control from preschool to
late adolescence and young adulthood. Psychological Science,
17(6), 478–484.
Epley, N., & Gilovich, T. (2006). The anchoring-and-adjustment
heuristic: why the adjustments are insufficient. Psychological
Science, 17(4), 311–318.
Evans, J. S. B. T. (2008). Dual-processing accounts of reasoning,
judgment, and social cognition. Annual Review of Psychology,
59(1), 255–278.
Evans, J. S. B. T., & Stanovich, K. E. (2013). Dual-Process Theories of
Higher Cognition: Advancing the Debate. Perspectives on
Psychological Science, 8(3), 223–241.
Figner, B., Knoch, D., Johnson, E. J., Krosch, A. R., Lisanby, S. H.,
Fehr, E., & Weber, E. U. (2010). Lateral prefrontal cortex and
self-control in intertemporal choice. Nature Neuroscience,
13(5), 538–539.
Fiske, S. T., & Taylor, S. E. (1991). Social Cognition. New
York: McGraw-Hill.
Frederick, S. (2005). Cognitive reflection and decision making.
Journal of Economic Perspectives, 19(4), 25–42.
Frederick, S., Loewenstein, G., & O’Donoghue, T.
(2002). Time discounting and time preference: A critical review.
Journal of Economic Literature, XL, 351–401.
Gelman, S. A. (2003). The essential child: Origins of
essentialism in everyday thought. Oxford: Oxford University Press.
Gervais, W. M., & Norenzayan, A. (2012). Analytic Thinking Promotes
Religious Disbelief. Science, 336(6080), 493–496.
Gignac, G. E., & Szodorai, E. T. (2016). Effect size guidelines for
individual differences researchers. Personality and Individual
Differences, 102, 74–78.
Gilbert, D. T., & Hixon, J. G. (1991). The trouble of thinking:
activation and application of stereotypic beliefs. Journal of
Personality and Social Psychology, 60(4), 509.
Gilbert, D. T., Pelham, B. W., & Krull, D. S. (1988). On cognitive
busyness: When person perceivers meet persons perceived.
Journal of Personality and Social Psychology, 54(5), 733.
Gillan, C. M., Otto, A. R., Phelps, E. A., & Daw, N. D. (2015).
Model-based learning protects against forming habits.
Cognitive, Affective, & Behavioral Neuroscience, 15(3),
523-536.
Hariri, A. R., Brown, S. M., Williamson, D. E., Flory, J. D., De Wit,
H., & Manuck, S. B. (2006). Preference for Immediate over Delayed
Rewards Is Associated with Magnitude of Ventral Striatal Activity.
Journal of Neuroscience, 26(51), 13213–13217.
Howell, A. J., Weikum, B. A., & Dyck, H. L. (2011). Psychological
essentialism and its association with stigmatization.
Personality and Individual Differences, 50(1), 95–100.
James, W. (1891). The Principles of Psychology (Vol. 2).
London: Macmillan.
Jarmolowicz, D. P., Cherry, J., Reed, D. D., & Bruce, J. M. (2014).
Robust relation between temporal discounting rates and body mass.
Appetite.
Johnson, M. W., & Bickel, W. K. (2002). Within-subject comparison of
real and hypothetical money rewards in delay discounting.
Journal of the Experimental Analysis of Behavior, 77(2),
129-146.
Kable, J. W., & Glimcher, P. W. (2007). The neural correlates of
subjective value during intertemporal choice. Nature
Neuroscience, 10(12), 1625–1633.
Kable, J. W., & Glimcher, P. W. (2010). An “As Soon As
Possible” Effect in Human Intertemporal Decision Making:
Behavioral Evidence and Neural Mechanisms. Journal of
Neurophysiology, 103(5), 2513–2531.
Kagan, J. (1966). Reflection-impulsivity: the generality and dynamics
of conceptual tempo. Journal of Abnormal Psychology, 71(1),
17-24.
Kahneman, D. (2003). A perspective on judgment and choice: mapping
bounded rationality. American Psychologist, 58(9), 697–720.
Kelemen, D. (2004). Are children “intuitive
theists"? Reasoning about purpose and design in nature.
Psychological Science, 15(5), 295–301.
Kim-Spoon, J., Mccullough, M. E., Bickel, W. K., Farley, J. P., &
Longo, G. S. (2014). Longitudinal Associations Among Religiousness,
Delay Discounting, and Substance Use Initiation in Early Adolescence.
Journal of Research on Adolescence, 25(1), 36–43.
Kirby, K., Petry, N., & Bickel, W. K. (1999). Heroin addicts have
higher discount rates for delayed rewards than non-drug-using controls.
Journal of experimental psychology. General, 128(1), 78–87.
Koehler, D. J., & James, G. (2010). Probability matching and strategy
availability. Memory and Cognition, 38(6), 667–676.
Kool, W., McGuire, J. T., Wang, G. J., & Botvinick, M. M. (2013).
Neural and Behavioral Evidence for an Intrinsic Cost of Self-Control.
PLoS ONE, 8(8), e72626-72626.
Kool, W., Shenhav, A., & Botvinick, M. M. (in press). Cognitive control
as cost-benefit decision making. In T. Egner (Ed.), Wiley
Handbook of Cognitive Control.
Kurth-Nelson, Z., Bickel, W., & Redish, A. D. (2012). A theoretical
account of cognitive effects in delay discounting. European
Journal of Neuroscience, 35(7), 1052–1064.
Kurzban, R., Duckworth, A., Kable, J. W., & Myers, J. (2013). An
opportunity cost model of subjective effort and task performance.
Behavioral and Brain Sciences, 36(6), 661–679.
Lupfer, M., Tolliver, D., & Jackson, M. (1996). Explaining
Life-Altering Occurrences: A Test of the
’God-of-the-Gaps’ Hypothesis.
Journal for the Scientific Study of Religion, 35(4), 379–391.
MacKillop, J., Miranda, R., Monti, P. M., Ray, L. A., Murphy, J. G.,
Rohsenow, D. J., . . . Gwaltney, C. J. (2010). Alcohol demand, delayed
reward discounting, and craving in relation to drinking and alcohol use
disorders. Journal of Abnormal Psychology, 119(1), 106–114.
Madden, G. J., Begotka, A. M., Raiff, B. R., & Kastern, L. L. (2003).
Delay discounting of real and hypothetical rewards.
Experimental and Clinical Psychopharmacology, 11(2), 139–145.
Madden, G. J., Raiff, B. R., Lagorio, C. H., Begotka, A. M., Mueller, A.
M., Hehli, D. J., & Wegener, A. A. (2004). Delay Discounting of
Potentially Real and Hypothetical Rewards: II. Between- and
Within-Subject Comparisons. Experimental and Clinical
Psychopharmacology, 12(4), 251–261.
McClure, S. M., & Bickel, W. K. (2014). A dual-systems perspective on
addiction: contributions from neuroimaging and cognitive training.
Annals of the New York Academy of Sciences, 1327(1), 62–78.
McClure, S. M., Laibson, D., Loewenstein, G. F., & Cohen, J. D. (2004).
Separate Neural Systems Value Immediate and Delayed Monetary Rewards.
Science, 306(5695), 503–507.
Metcalfe, J., & Mischel, W. (1999). A hot/cool-system analysis of delay
of gratification: dynamics of willpower. Psychological Review,
106(1), 3–19.
Mischel, W., Shoda, Y., & Rodriguez, M. (1989). Delay of gratification
in children. Science, 244(4907), 933–938.
Norman, D. A., & Shallice, T. (1986). Attention to action: Willed and
automatic control of behavior. In R. J. Davidson, G. E. Schwartz & D.
Shapiro (Eds.), Consciousness and Self-Segulation: Vol. 4.
Advances in research and theory (pp. 1-18). New York: Plennum Press.
Otto, A. R., Gershman, S. J., Markman, A. B., & Daw, N. D. (2013). The
curse of planning: dissecting multiple reinforcement-learning systems
by taxing the central executive. Psychological Science, 24(5),
751-761.
Otto, A. R., Skatova, A., Madlon-Kay, S., & Daw, N. D. (2015).
Cognitive Control Predicts Use of Model-based Reinforcement Learning.
Journal of Cognitive Neuroscience, 27(2), 319–333.
Otto, A. R., Taylor, E. G., & Markman, A. B. (2011). There are at least
two kinds of probability matching: Evidence from a secondary task.
Cognition, 118(2), 274–279.
Pennycook, G., Cheyne, J. A., Koehler, D. J., & Fugelsang, J. A.
(2015). Is the cognitive reflection test a measure of both reflection
and intuition? Behavior Research Methods, 48(1), 341–348.
Pennycook, G., Cheyne, J. A., Seli, P., Koehler, D. J., & Fugelsang, J.
A. (2012). Analytic cognitive style predicts religious and paranormal
belief. Cognition, 123(3), 335–346.
Pennycook, G., Fugelsang, J. A., & Koehler, D. J. (2015). Everyday
Consequences of Analytic Thinking. Current Directions in
Psychological Science, 24(6), 425–432.
Pennycook, G., Ross, R. M., Koehler, D. J., & Fugelsang, J. A. (2016).
Atheists and Agnostics Are More Reflective than Religious Believers:
Four Empirical Studies and a Meta-Analysis. PLoS ONE, 11(4),
e0153039-0153018.
Petry, N. M. (2001). Delay discounting of money and alcohol in actively
using alcoholics, currently abstinent alcoholics, and controls.
Psychopharmacology, 154(3), 243–250.
Preston, J., & Epley, N. (2005). Explanations Versus Applications: The
Explanatory Power of Valuable Beliefs. Psychological Science,
16(10), 826.
Reimers, S., Maylor, E. A., Stewart, N., & Chater, N. (2009).
Associations between a one-shot delay discounting measure and age,
income, education and real-world impulsive behavior.
Personality and Individual Differences, 47(8), 973–978.
Roets, A., & Hiel, A. V. (2011). Item selection and validation of a
brief, 15-item version of the Need for Closure Scale.
Personality and Individual Differences, 50(1), 90–94.
Shenhav, A., Rand, D. G., & Greene, J. D. (2012). Divine intuition:
Cognitive style influences belief in God. Journal of
Experimental Psychology General, 141(3), 423–428.
Shiffrin, R. M., & Schneider, W. (1977). Controlled and automatic
information processing: II. Perceptual learning, automatic attending,
and a general theory. Psychological Review, 84, 127–190.
Shipley, W. C. (1986). Shipley Institute of Living Scale. Los Angeles,
CA: Western Psychological Services.
Sloman, S. A. (1996). The empirical case for two systems of reasoning.
Psychological Bulletin, 119(1), 3–22.
Sloman, S. A. (2014). Two systems of reasoning, an update. In J.
Sherman, B. Gawronski & Y. Trope (Eds.), Dual process theories
of the social mind: Guilford Press.
Smittenaar, P., FitzGerald, T. H. B., Romei, V., Wright, N. D., &
Dolan, R. J. (2013). Disruption of Dorsolateral Prefrontal Cortex
Decreases Model-Based in Favor of Model-free Control in Humans.
Neuron, 80(4), 914–919.
Stanovich, K. E. (2009). Rational and Irrational Thought: The Thinking
that IQ Tests Miss. Scientific American Mind, 20(6), 34–39.
Stanovich, K. E., & West, R. (1998). Individual differences in rational
thought. Journal of Experimental Psychology-General, 127(2),
161-188.
Toplak, M. E., West, R. F., & Stanovich, K. E. (2011). The Cognitive
Reflection Test as a predictor of performance on heuristics-and-biases
tasks. Memory & Cognition, 39(7), 1275–1289.
Toplak, M. E., West, R. F., & Stanovich, K. E. (2014). Assessing
miserly information processing: An expansion of the Cognitive
Reflection Test. Thinking & Reasoning, 20(2), 147–168.
Vulkan, N. (2000). An economist’s perspective on probability matching.
Journal of Economic Surveys, 14(1), 101–118.
Webster, D. M., & Kruglanski, A. W. (1994). Individual differences in
need for cognitive closure. Journal of Personality and Social
Psychology, 67(6), 1049–1062.
Wechsler, D. (1997). Wechsler Adult Intelligence Scale — 3rd Edition
(WAIS-3®). San Antonio, TX: Harcourt Assessment.
West, R. F., Toplak, M. E., & Stanovich, K. E. (2008). Heuristics and
biases as measures of critical thinking: Associations with cognitive
ability and thinking dispositions. Journal of Educational
Psychology, 100(4), 930–941.
Westbrook, A., & Braver, T. S. (2015). Cognitive effort: A
neuroeconomic approach. Cognitive, Affective, & Behavioral
Neuroscience, 15(2), 395–415.
Westbrook, A., Kester, D., & Braver, T. S. (2013). What is the
subjective cost of cognitive effort? Load, trait, and aging effects
revealed by economic preference. PLoS ONE, 22, e68210.
Westfall, J., & Yarkoni, T. (2016). Statistically controlling for
confounding constructs is harder than you think. PLoS ONE,
11(3), e0152719-0152722.
Worthington, E. L. J., Wade, N. G., Hight, T. L., Ripley, J. S.,
Mccullough, M. E., Berry, J. W., . . . O’Connor, L.
(2003). The Religious Commitment Inventory--10: Development,
refinement, and validation of a brief scale for research and
counseling. Journal of Counseling Psychology, 50(1), 84–96.
Table A1: Correlations between variables of interest and
individual binary choices on the MCQ items. Individual choices of
the sooner option are coded as zero
(0), and choices of the delayed option are coded as one (1), so that
negative correlations reflect an association with preference for the
sooner reward. The consistency in the direction of these item-wise
correlations for a given variable on the left-hand side suggests that
correlations with overall discount rate were not driven by responses to
any particular item in the MCQ.
Variable
1
2
3
4
5
6
7
8
9
BMI
-0.09
-0.09
0.05
-0.09
-0.02
-0.07
-0.04
-0.10
0.04
Smoker
-0.09
-0.09
-0.18
-0.12
-0.15
-0.12
-0.12
-0.09
-0.20
Correct CRT responses
0.03
0.08
0.20
0.20
0.20
0.16
0.22
0.12
0.19
Intuitive CRT responses
-0.04
-0.08
-0.14
-0.17
-0.15
-0.15
-0.16
-0.12
-0.10
Probability matcher
-0.01
-0.05
-0.21
-0.20
-0.29
-0.09
-0.24
-0.05
-0.21
Model-based planning
-0.00
0.03
0.20
0.08
0.17
0.10
0.17
0.04
0.11
Need for closure
-0.06
-0.06
-0.08
-0.04
-0.05
-0.04
-0.04
-0.06
-0.07
Twitter use
-0.09
-0.08
0.02
-0.06
-0.01
-0.06
-0.06
-0.09
0.03
Complexity of preferred news
0.05
0.08
0.07
0.11
0.06
0.11
0.12
0.07
0.08
Essentialism
-0.01
-0.03
-0.08
-0.08
-0.09
-0.07
-0.10
-0.02
-0.06
Genetics of race & -behavior
-0.07
-0.06
-0.09
-0.06
-0.06
-0.05
-0.05
-0.06
-0.09
Belief in God
-0.02
-0.03
-0.07
-0.10
-0.07
-0.08
-0.08
-0.06
-0.06
Convinced of God
-0.01
-0.02
-0.10
-0.08
-0.08
-0.07
-0.08
-0.03
-0.09
Belief in afterlife
-0.04
-0.04
-0.02
-0.09
-0.03
-0.07
-0.05
-0.07
-0.02
Appendix 1: Previous findings in conflict with reported
discounting-belief correlations
We find, across several surveys, that steeper discounting is reliably
associated with stronger belief in God (Figure 4). Another group
recently reported the opposite finding (i.e., steeper discounters had
weaker religious beliefs; Carter et al., 2012; DeWall et al., 2014).
This group used the same monetary choice questionnaire as we do but
different measures of religious belief (the Religious Commitment
Inventory [RCI]; Worthington et al., 2003; see also Kim-Spoon,
Mccullough, Bickel, Farley & Longo, 2014, discussed below). They also
incentivized their subjects (subjects had a 25% chance of
receiving one of their intertemporal choice outcomes), whereas most of
our samples used hypothetical choice. For one of our survey samples we
therefore included the exact measures they include and incentivized our
intertemporal choices (subjects had a 1% chance of having a
randomly drawn intertemporal choice played out).
We were unable to replicate this group’s findings. In our data, discount
rate was positively rather than negatively correlated with RCI
(r(1012) = 0.06, p=0.061), and we once again
replicated our own result using the belief measures used as in the main
text (continuous: r(1012) = 0.08, p<0.02,
binary: rpb(1012) = 0.09,
p<0.005; note that this was one of the samples
aggregated into the analyses reported in the main text). Because Carter
and colleagues estimated discount rate from the full discounting scale,
whereas we used only the medium magnitude items throughout our
analyses, we repeated our analyses correlating discount rate and belief
in God using overall discount rates for the full scale and highly
similar results obtain. We also note that the distributions of RCI
values were very similar across the two studies (our sample: M = 2.02,
SD = 1.11; Carter et al: M = 2.02, SD = 1.04; DeWall et al: M = 2.01,
SD = 1.03).
Follow-up analyses identified a potential source of the discrepancy
between our findings and theirs. Specifically, it appears as though
the relationship between discount rate and RCI may be U-shaped. The
influence of discount rate on RCI scores was better explained by a
combination of linear and quadratic terms (corrected Akaike
Information Criterion [AICc] = 3082) rather than only a linear term
(AICc = 3087) and, in this more complete model, we find a significant
quadratic relationship between discounting and RCI scores in our data
(βquadratic = 0.09, t(1011) = 2.60,
p<0.01). (The linear term in this model remains
significant and slightly stronger than the linear term in the model
that omitted a quadratic term; βlinear = 0.10,
t(1011) = 2.84, p<0.005). This quadratic
effect is by no means conclusive regarding whether there these
variables have a U-shaped relationship (Simonsohn, unpublished), and
follow-up work is needed to more thoroughly examine the range of RCI
values. If such a relationship existed, however, it would suggest that
there is a range of discounting values for which one might observe
a negative relationship with RCI (as Carter and colleagues and DeWall
and colleagues observed). Why this quadratic relationship might exist
is a matter of speculation, and may have to do with the fact that
average RCI scores in our sample and theirs are very low (on a scale
ranging from “not at all true for me to “totally true for me”),
suggesting that shallower discounters scoring more highly on RCI may
simply be evincing greater uncertainty rather than more confident
religious commitment. We also note that, in addition to being a larger
sample (Ns=1014 vs. 277 for Carter et al and 327 for DeWall et al)
our online data are collected from a geographically and
demographically diverse sample of the American population (Buhrmester,
Kwang & Gosling, 2011), including university-based samples, rather
than only from a single university sample. This may have contributed
to our sample having a higher mean discount rate (natural
log-transformed medium-magnitude ks = –4.32 vs. -4.68) and
greater variance (SDs = 1.75 vs. 1.48), relative to at least Carter
et al14, which may in turn have enabled us to capture a wider range of
the quadratic curve described above.
Another recent finding from this group examines discount rate in a group
of 106 early adolescents and compares this to their religiosity a few
years later, and again finds a negative association (Kim-Spoon et al.,
2014). While this latter dataset is different enough from our own (in
terms of age and longitudinal approach) to preclude any direct
comparison, we note that in this study, like those of Carter and
colleagues and, DeWall and colleagues, the key measure of religious
belief seems to focus on how one feels about faith and their religion
(e.g., how often they engage with their religious group and religious
material [Carter et al and DeWall et al], or how important they think
it is to believe in God [Kim-Spoon et al]) rather than on the
strength/confidence of their belief in the existence of God/afterlife.
In our data, this difference appeared to produce a slightly weaker
association between discounting and RCI than our standard belief
measures (though both correlations were in the direction predicted by
our other findings and contra to Carter et al and DeWall et al);
whether this difference in measures helps to explain the difference
between our findings and the finding by Kim-Spoon and colleagues awaits
further investigation.
Finally, since these three previous studies measured discounting and
religiosity in separate sessions, we sought to rule out the possibility
that our findings resulted from collecting both measures in the same
session. To do so, the data for one of our samples (N=1009) was
collected from individuals who had previously completed the MCQ and/or
a measure of belief in God15 for other, unrelated experiments that we had performed
through AMT. We had these subjects complete a new survey consisting
of measures of religious belief followed by the 9-item MCQ, demographic
measures, and measures of internet usage. We found that the positive
correlation between belief and discounting held when measured in
separate sessions as it did when measured in the same session.
Specifically, we found that (a) estimates of discount rate from
previous sessions (averaged over sessions for a given subject)
predicted belief in God in the new survey (Likert item: r(987)
= 0.08, p<0.02; binary item:
rpb(987)= 0.10,
p<0.005) and (b) discount rate measured by the new
survey correlated with belief measured in the previous surveys, whether
those surveys included intertemporal choice questions (r(982)
= 0.10, p<0.005) or not (r(358) = 0.14,
p<0.01).
Appendix 2: Belief in God and behavior on probability matching and
two-step tasks
For completeness, we tested whether belief in God was associated not
only with CRT (Shenhav et al., 2012) and intertemporal choice (main
text), but also with behavior in the other choice paradigms we
explored. First we tested for and found a relationship between
probability matching and belief in God. Probability matchers believed
more strongly in God (continuous scale: r(537) = 0.10,
p<0.02) and were more likely to say they had a
previous convincing experience of God’s existence
rpb(530) = 0.17,
p<0.0001).
We then tested for a similar relationship between belief in God and
model-based planning in the two-step task. (We note that this survey
employed a slightly different measure of belief (“How convinced are you
of the existence of God” – 7-point scale ranging from ‘not at all’ to
‘very’) so these responses were excluded from cross-survey analyses of
belief in God reported in the main text.) These analyses revealed a
significant relationship between lower belief in God and higher
model-based indices (N=263, coeff = –0.24, SE = 0.06, z =
–3.8, p< 0.0005). No significant relationships were
found between belief in God and either of the main effects whose
interaction forms the model-based index (main effect of reward: coeff =
–0.07, SE = 0.04, z = –1.6, p = 0.10; main effect of
transition: coeff = 0.03, SE = 0.04, z = 0.74, p =
0.46).
Department of Cognitive, Linguistic, and
Psychological Sciences, Brown Institute for Brain Science,
190 Thayer St., Box 1821, Brown University, Providence, RI 02912,
USA. Email: amitai_shenhav@brown.edu.
Department of Psychology, Yale University,
New Haven, CT, 06520, USA.
We are very grateful to Fiery Cushman for developing and sharing data
from a web-based two-step task; to Lisa Stewart, Gordon Kraft-Todd, and
Antonio Alonso Arechar for assistance with data collection; and to Mike
McCullough for helpful discussions. DR gratefully acknowledges funding
from the John Templeton Foundation.
Because a subset of subjects responded to the
specific problem above with the response 0.10 or 0.05 (suggesting that
they missed the instruction to give the answer in cents), we assumed in
these cases that they intended to respond 10 or 5 and counted those
responses accordingly. However, all of our findings are qualitatively
unchanged if we instead treat these responses as though they were
intended in cents rather than dollars.
Due to occasional bottleneck issues with the web
server, some trials were not recorded. Additional trials were
missing due to a few incomplete sessions. We excluded four subjects
with fewer than 100 main task trials (out of 125). The remaining
subjects had an average of 122 trials available for analysis (SD =
3.8).
Of the 883 subjects who
completed this measure, 137 also completed a third ‘biological basis’
subscale (e.g., “The kind of person someone is can be largely
attributed to their genetic inheritance”); we omit this subscale from
our analyses, and did not have the other subjects complete it,
because it is only weakly correlated with the other two subscales and
had the potential to introduce biases related to scientific authority
and evolutionary theory. We also note that one sample (N=348) completed
a shortened scale consisting of 5 representative items across the two
subscales.
Both of these effects hold when
including age and gender as covariates (BMI:
rpartial(5022) = 0.06,
p<0.0001, smoking:
rpb_partial(1763) = 0.16,
p<0.0001).
This finding could not be accounted for by
average time spent using the internet – which was positively
correlated with discount rate (r(2668) = 0.07, p
< 0.001) – as overall internet use was negatively
associated with an individual’s relative use of Twitter versus
Reddit (i.e., people who spent more time on the internet used Reddit
more frequently than Twitter; r(1003) = –0.06, p
= 0.054). The correlation between discounting and Twitter use also
remained significant in a model that included age, gender, education
and weekly internet use as covariates
(rpartial(995) = 0.10, p
< 0.005).
A secondary analysis showed that this association
between discount rate and network preference was also significant in
a model that included covariates for age, gender, and measures of
education, socioeconomics, political affiliation/conservatism,
religious belief, and average time spent watching TV and browsing
the internet (χ2 (6, 977) = 15.9,
p<0.02).
In addition to accounting for variance associated
with political and other variables, which has it limitations
(Westfall & Yarkoni, 2016), we separately tested whether these top
rankings varied by political party affiliation. We found that the
average complexity ratings of subjects affiliated with the
Democratic and Republican parties yielded identical rankings of the
top three networks (NPR, MSNBC, CNN), suggesting that these
particular network rankings were not politically motivated.
While discounting continues to be
significantly associated with both of these when conservatism
measures are included as covariates (essentialism:
rpartial(859) = 0.09, p
< 0.007; gene-environment:
rpartial(1738) = 0.09, p
< 0.0005), this does not rule out a role for conservatism
in explaining these associations. (See also discussion of the
distinction between discount rate’s association with fiscal versus
social conservatism, below.)
Secondary
analyses showed that the correlations between discount rate and
belief in God remain significant in a model that also includes age,
gender, and measures of education level, socioeconomic status, and
conservatism as covariates (continuous: β =0.06,
t(2907) = 3.3, p=0.001; binary: χ2 (N=2559)
= 16.1, p<0.0001). Follow-up analyses also showed
that discount rate is significantly correlated with belief in God
when covarying both measures of CRT
(rpartial(1950) = 0.05, p
< 0.05), which have previously been found to be associated
with belief in God (Gervais & Norenzayan, 2012; Pennycook et al.,
2012; Shenhav et al., 2012). We similarly find that discount rate is
correlated with belief in God when covarying essentialist beliefs
(rpartial(876) = 0.15, p
< 0.0001) or the gene-environment item
(rpartial(1765) = 0.11, p
< 0.0001), and that the correlations between discount rate
and these other variables also remain significant in those same
models (essentialism:
rpartial(876) = 0.08, p
< 0.02; gene-environment:
rpartial(1765) = 0.07, p
< 0.002).
When including Independent and Other as
categories, the relationship between discount rate and party
affiliation is almost significant (χ2 (3, 4317) = 7.46,
p = 0.059), apparently driven by a tendency for individuals
indicating ‘Other’ to be shallower discounters than the remaining
categories.
The correlation between discount rate
and responses to the racial genetic essentialism item remained
significant when covarying NFC:
rpartial(1779) = 0.07,
p<0.002. NFC and psychological essentialism were
not included in the same survey, preventing a comparable analysis
for the correlation between discounting and psychological
essentialism while covarying NFC.
While these correlations
with discount rate are modest in size, they do appear to be consistent
across individual items within the MCQ (Table A1), suggesting that they
are not being driven by a strong correlation with responses to a subset
of items.
This belief measure differed
slightly from the main Likert measure used for this study. It consisted
of the prompt “How strongly do you believe in the existence of a God or
Gods?” and a seven-point Likert scale anchored at “very little” and
“very much.”
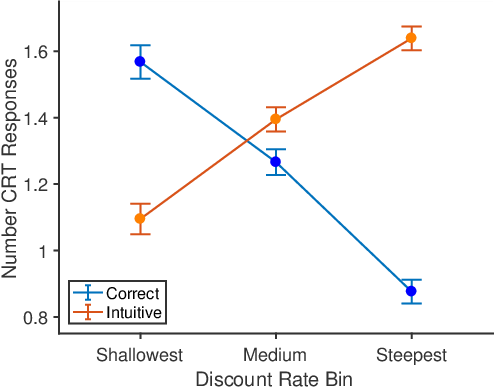 [b]3in