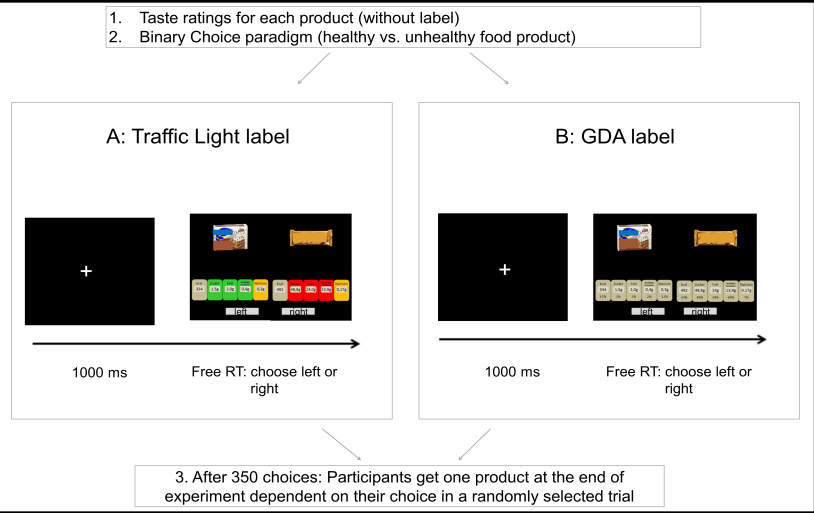
| Figure 2: Summary of experimental setup: Subjects rated the
taste of 100 food products and then chose between products that were
either labeled with a traffic light or with a numeric, information
based (GDA, guideline daily amount) label. Note that brand names are
shadowed here, but were not masked in the real experiment. After the
experiment, one trial was randomly selected, and the subjects
received the product they chose in this trial. |
2 Method
2.1 Subjects
44 subjects completed the experiment (mean age=23.72,
SD=4.4). The sample size was chosen based on the assumed
effect size of 0.4 from a prior study (Enax, Hu, et al., 2015). For a
hierarchical multiple regression analysis, and two levels of the
predictor (TL vs. GDA), a sample size of 40 subjects would
provide 90% power to detect a significant effect tested at
α =0.05. We also conducted two additional experiments
with single-nutrient nutrition labels, which are included in the
Supplement. All
subjects had normal or corrected-to-normal vision. In line with
previous studies (Hare et al., 2011; Maier et al., 2015), subjects
were tested at varying times during the day but asked to fast four
hours prior to the experiment to increase the value of food items
(Epstein et al., 2003) and standardize hunger levels. Subjects
received €15 endowment for participation as well as their chosen
product from a randomly selected choice trial.
2.2 Stimuli
A set of 50 healthy and 50 unhealthy packaged products were obtained
from the internet and presented on a black background (resolution:
1920 × 1200 pixel). Nutrition labels were taken from the producer’s
nutrition information for the product and included sugar, fat,
saturated fat, salt, and calories. The labels were presented either
numerically with percentages (GDA) or more saliently, using the
color-coded TL; see Figure 2 for the stimuli. The GDA percentage
values were extracted from the CIAA (CIAA (EU Food and Drink
Confederation), 2014) and the TL guidance values from the Food
Standards Agency’s website (Department of Health & Food Standards
Agency (FSA), 2013). Note that calories were not colored, as no
guidance values from the FSA exist. GDA and TL labels were of the same
size and denoted the respective nutrition value per 100g. We used the
classification of healthy versus unhealthy products as described in
(Enax, Hu, et al., 2015) based on the TL color classification
scheme. Specifically, an item was considered healthy if it contained
at least one green and no red coded nutrient, and unhealthy if it
contained at least one red and no more than one green coded
nutrient. No difference between naturally occurring sugar (e.g.,
fructose) and added sugar (e.g., sucrose) was made. We used the
correct nutrition values of products, therefore, nutrition information
could be “mixed”, in that a label was not completely green or red, but
rather green (healthy) or rather red (unhealthy). The design was
presented using z-tree (version 3.4.7; Fischbacher, 2007)
2.3 Behavioral paradigm
In line with previous studies investigating the process of how people
make choices between food items based on independently collected taste
“liking ratings” on a simple Likert scale (Krajbich et al., 2010;
Maier et al., 2015; Philiastides & Ratcliff, 2013), we adopted this
design but incorporated nutrition labels as additional modulators of
value. Therefore, subjects first rated the taste of each product
on a discrete Likert scale from –5 to 5 (–5= do not like at
all, 5= like very much) in increments of 1. The items were
presented in the center of the screen without any nutrition
information. In the main task, subjects made binary choices
between healthy and unhealthy food products on the left and right side
of the display, see Figure 2. 350 pairs of healthy and unhealthy
products were randomly generated. For each individual, once a product
was coupled with a TL (or GDA) label, consecutive presentations of
this product also occurred with that label. Product-label combinations
were randomized across subjects. Whether the healthy product
appeared on the left or right side was randomized. TL and GDA trials
were interleaved. Trials were separated by an inter-trial interval of
1000 ms (showing a white fixation cross on a black background). No
time limits were imposed on these tasks, but subjects were told to
make a response as soon as they formed a decision. Subjects
indicated their choice by clicking on a button labeled “left” or
“right” below the products corresponding to the screen position with
the preferred index finger on a standard computer mouse. Items were
removed from the screen as soon as a choice was made.
2.4 Data analysis
Behavioral data were analyzed using R (R Core Team, 2013).
Data cleaning:
For each individual, we excluded trials in which the RT was two
standard deviations above the individual mean RT, as those trials were
likely contaminated by non-attention or distraction and are thus
problematic for further analyses. As mean RTs are very sensitive to
outliers, we first applied a cutoff of 30 s on the RTs. On average, 17
(SD = 5.4, range: 4–41 trials) out of 350 trials were excluded per
subject in this experiment. (The effect of label [model “Label”, see
below] on healthy choices is also significant when using all choices;
Z=2.9, p=0.0037).
Regression analyis:
To analyze the overall effect of label (GDA versus TL) on healthy
choices, a maximal logistic mixed-effects regression analysis was
performed with healthy choice as the dependent variable, label type as
an independent variable and subjects as random effects, to account
for idiosyncratic variation due to individual differences (Winter,
2013), fit by maximum likelihood (Laplace approximation, model
“Label”). We then also controlled for liking by adding rating as a
covariate in the model (model “Label + Liking”). Subsequently, we
tested for an interaction effect between subjective taste ratings and
nutrition labels by adding ratings and the interaction between rating
and label to the model (model “Label × Liking”). Further, RT
data were analyzed using a maximal linear-mixed model. As RT
distributions in these binary choices are highly skewed, we
log-transformed the RT data. We used label (TL vs. GDA) as a fixed
effect, subject as random effect and log-RT as dependent variable.
Diffusion model fits:
Diffusion modeling was performed using fast-dm (fast-dm-30, Heidelberg,
Germany) as well as the RWiener package implemented in R (Wabersich,
2014) for analyzing the drift rate as a function of preferences as this
analysis is currently not supported in fast-dm. We used the chi-square
(χ2 ) algorithm for diffusion model fitting. In
the DDM analyses, we were specifically interested in the following two
research questions (RQ1 and RQ2):
RQ 1:
If TL labels increase the drift rate towards
healthier options, or alternatively if they induce a starting point
bias, and
RQ2:
if TL labels increase the weight on health, and decrease
the weight on taste attributes in the comparison process, compared to
the GDA labels (see ω in the DDM equation below).
For all models, a positive drift indicates accumulation towards the
“healthy” boundary, whereas a negative drift indicates that
information is generally accumulated towards the “unhealthy”
boundary. Similarly, a starting point parameter value greater than 0.5
indicates a starting point bias towards the “healthy” boundary,
whereas a value below 0.5 indicates a starting point bias towards the
“unhealthy” boundary.
For RQ1, we investigated whether TL labels increase the drift rate
towards the healthier option. On a single-subject level, data were
modeled across taste ratings. Because we presented TL and GDA trials in
a random sequence, subjects could not anticipate which type of
label would occur on the next trial, and decision boundaries could not
be set beforehand. The model “Drift” included two drift rate parameters
(for GDA and TL). We further included label-specific inter-trial
variability in drift rates to account for the fact that each decision
involves a unique pair of items (Krajbich & Smith, 2015; Philiastides
& Ratcliff, 2013). We let non-decision time and starting point vary
across both labels and set the parameter accounting for variability in
non-decision time and inter-trial variability in relative starting
point to zero because this makes the estimation of the remaining
parameters more robust, even in presence of inter-trial-variability in
our data (Voss et al., 2015). We then compared the two drift rates for
GDA and TL using a paired-samples t-test.
Testing for model fit:
Model fit was assessed using Monte Carlo simulations, which has, in
comparison to graphical inspection, the advantage that it leads to a
clear criterion for model fit to each subject (Voss et al., 2015).
1000 parameter sets from a multidimensional normal distribution defined
by the covariance matrix of estimated parameter values were drawn using
the mvtnorm package for R (Genz et al., 2014). Then, for each
of the 1000 parameter sets, a data set was simulated using the
construct-sample tool of fast-dm and then re-fit with the same settings
as used for the empirical data. The parameters from the empirical fit
were then compared to these distributions of simulated data fits. Any
subjects with parameter fits lying outside of the 95% confidence
intervals from the simulated fits were excluded from further analysis
(Voss et al., 2015). For completeness, we also present the quantile
probability plots across subjects (Figure S1).
Alternative models:
As the behavioral effect could also be explained by other diffusion
model parameters, suggesting a different mechanism for how labels are
processed, we tested three alternative models. The model “Drift +
Starting Point” included separate parameter estimates for drift rate
and starting point bias for each label. The model “Drift +
Non-decision” included separate parameter estimates for drift rate and
non-decision time for each label. The model “Drift + Starting Point +
Non-decision” included separate estimates for drift rate, starting
point, and non-decision time for each label. All alternative models
accounted for drift rate variability. Variability in non-decision time
and inter-trial variability in relative starting point were again set
to zero. We then tested for significant differences between TL and GDA
using a paired-samples t-test.
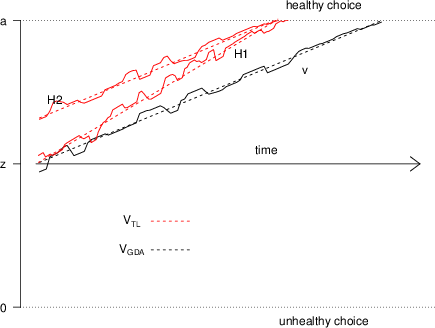
Drift as a function of taste ratings:
For RQ2, we allowed the drift rate to vary as a function of the taste
ratings on a single-subject level. We assumed that
| RDV(t) = RDV(t−1) + healthS + (ω ×
(tasteH − tasteU)) + ε |
where RDV is
the relative decision value at time t, healthS is the sensitivity
to health (intercept), and ω is the weight on the difference
between the taste ratings of the healthy (H) and unhealthy (U)
food item. ω multiplies the taste value difference between the
healthy and unhealthy option and determines the relative importance of
taste in the mean drift rate. The model assumes that it takes time to
accumulate and compare evidence for the options until a pre-specified
level of confidence is reached. The rate of evidence accumulation
depends linearly on the difference between the underlying subjective
taste values. For estimation purposes (because we did not have enough
data in each bin to properly fit the model), we further binned the
taste ratings into three coarse bins: unhealthy preferred [rating
difference from –10 to –4], roughly equally liked [–3 to 3] and
healthy preferred [4 to 10]. We also included Gaussian noise
(ε ). See the
Supplement for
further logit analyses investigating whether the labels change the
absolute or the relative weight of taste and health attributes, as
well as rating-specific drift rates, which were calculated using a
jackknifing procedure.
3 Results
3.1 Choice and reaction time data analyses
We found a significant effect of label on healthy choice (model
“Label”, estimate (standard error, SE): 0.25 (0.08); Z=2.82,
p<0.01, intercept: –0.09), with higher proportions
of healthy choices in the TL compared to the GDA condition. The
effect of label was still significant, and even larger (0.33), when
statistically controlling for liking (model “Label + Liking”). As
expected we found that liking ratings significantly affected choices
(main effect label: estimate (SE): 0.33 (0.10); Z=3.43,
p<0.001; main effect liking: estimate (SE): 0.55
(0.03); Z=17.15, p<0.001, intercept:
0.17).
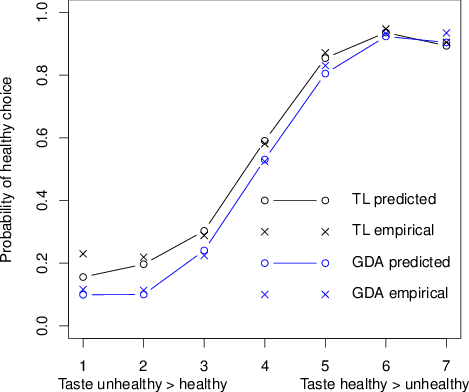
Further, we found an almost significant interaction between ratings
and label (model “Label × Liking”, interaction effect: estimate (SE):
–0.05 (0.02) Z=1.75, p=0.08; main effect label:
estimate (SE): 0.30 (0.10); Z=3.12, p=0.002; main
effect liking: estimate (SE): 0.58 (0.03); Z=16.7,
p<0.001; intercept: 0.18); see Figure 3.
Note that the almost significant interaction term probably does not reflect
a true psychological difference in the effect of the TL labels when
taste healthy > unhealthy, but is rather the product of a
ceiling effect where the healthy item is almost always being chosen,
and so there is little room for the TL labels to have an additional
effect. In other words, this is likely a removable interaction
(Loftus 1978; Wagenmakers et al. 2012).
| Figure 3: Empirical probability of healthy choice and predicted
probabilities as a function of taste. Note that for display purposes
only, ratings were binned into seven larger bins (from –10 to –8, –7 to
–5, –4 to –2, –1 to 1, 2 to 4, 5 to 7 and 8 to 10). Values and
confidence intervals for healthy choices per rating bin were predicted
from a logistic mixed regression model (model “Label × Liking” with
binned liking ratings). |
| Table 1: Alternative diffusion models. |
| | | Mean | SEMa | | | |
|
Model | Parameters | GDA | TL | GDA | TL | t-value | p-value | Mean model χ2 b |
| 1. | Drift rate | –0.12 | 0.07 | 0.02 | 0.02 | 2.34 | 0.02 | 18.54 |
| | Starting Point | 0.50 | 0.49 | 0.01 | 0.01 | 0.74 | 0.46 | |
| 2. | Drift rate | –0.09 | 0.05 | 0.02 | 0.02 | 2.13 | 0.04 | 18.89 |
| | Non-decision time | 0.76 | 0.76 | 0.01 | 0.01 | 0.54 | 0.60 | |
| 3. | Drift rate | –0.11 | 0.05 | 0.02 | 0.02 | 2.16 | 0.04 | 17.19 |
| | Starting Point | 0.50 | 0.50 | 0.01 | 0.01 | 0.36 | 0.72 | |
| | Non-decision time | 0.77 | 0.77 | 0.01 | 0.01 | 0.29 | 0.77 | |
| a Standard error of the mean. |
| b Does not account for model complexity. |
We also analyzed whether there was a difference in RT depending on the
label using a mixed-effects linear regression analysis using
log-transformed RT data. We found a trending effect of
label on RTs in that subjects were somewhat faster in the GDA
condition (t=1.43, p=0.16; mean log-RT for GDA=0.766,
SD=0.55; mean log-RT for TL=0.78, SD=0.53)
3.2 Diffusion model analyses
For RQ1, we investigated whether drift rates differ between the two
labels at a single-subject level (model “Drift”). The drift rate
towards the healthy option is significantly higher for the TL label,
compared to the numeric GDA label (t(43)=2.3,
p=0.029; drift rate mean GDA=-0.10, TL=0.05)). Monte-Carlo
simulations as well as quantile-probability plots were used to assess
model fit. Since fast-dm minimizes the χ2 value, high χ2
values are indicative of a poor fit. We used the 95% quantile of the
χ2 distribution and determined whether our values were below
this criterion. All of our fits were below the obtained critical
value, indicating an acceptable model fit in all cases; therefore, no
subjects were excluded. See also the quantile probability plot across
subjects (Figure S1 in the
Supplement).
| Figure 4: Results from Model “Drift + Starting Point +
Non-decision”: Only drift rates differ significantly for TL versus GDA.
* indicates p<0.05. |
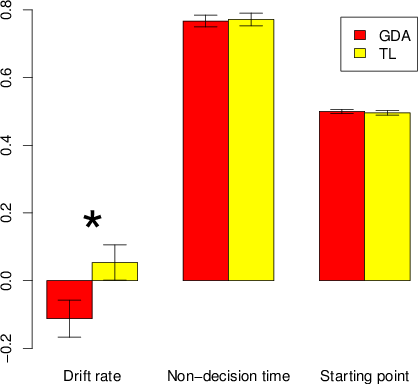
We then tested alternative models to investigate whether other diffusion
model parameters can capture the observed behavioral effect, which
would suggest a different underlying psychological process. We only
find significant differences between drift rates but not in
non-decision time or starting point bias for TL and GDA; see Table 1
and Figure 4.
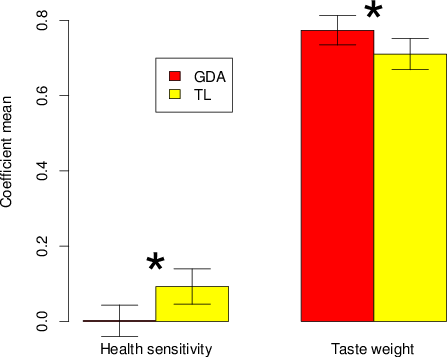
For RQ2, we let the drift rate vary as a function of the relative
desirability of the taste of the products, that is, the difference
between the taste of the healthy product and the taste of the
unhealthy product. As expected, the salient TL labels
increase the sensitivity (s) to health attributes (mean
healthS GDA=0.002, SEM=0.012; mean
healthS TL=0.093, SEM=0.013,
t(43)=2.60, p=0.013). Also, salient labels reduce
the weight (ω ) subjects place on taste attributes (mean
ω GDA=0.77, SEM=0.01; mean ω TL=0.71,
SEM=0.012; t(43)=2.331, p=0.021); see
Figure 5 and also the additional analyses in the
Supplement, where we
further investigated whether the labels change the relative or
absolute weight on health and taste attributes. Rating-specific drift
rates were analyzed using a jackknifing procedure (see
Supplement).
| Figure 5: Relative decision value as a function of the
weight on taste and the sensitivity to health. We find that TL labels
increase the sensitivity to health attributes, and decrease the weight
subjects put on taste attributes. Abbreviations:
healthS, sensitivity to health (intercept); ω =
weight on taste; GDA=guideline daily amount; TL= traffic light.
* p<0.05. |
4 Discussion
In this study, we investigated the cognitive mechanism underlying
value-based decisions with nutrition labels as modulators of value. As
expected, the percentage of healthy choices increased when the product
was labeled with a color-coded, compared to a purely numeric label. We
further used drift diffusion modeling to draw conclusions about the
underlying cognitive mechanism, which has not been addressed in
previous studies. We found that the drift rate towards the healthier
option is increased in case of color-coded labeling, compared to the
purely numerical counterpart, suggesting that health information and
taste preferences are integrated in the decision process. In contrast,
we do not find evidence for a simple stimulus-response bias due to
color-coded labels irrespective of the items’ features. Last, our data
suggests that subjects put less weight on taste attributes, and
more weight on health attributes when choosing between color-coded
labeled products.
Manipulating the amount of attention paid to health features, for
example via overt instruction (Hare et al., 2011) or salient cigarette
warnings (Borland et al., 2009), can increase the weight placed on
health features, and thereby alter the choice process (Fehr & Rangel,
2011). Our traditional regression analyses revealed a higher
probability to choose the healthy product when presented with more
salient, color-coded labels. This is in line with previous studies
that showed that color-coded labels increase the identification and
choice of healthier options (Borgmeier & Westenhoefer, 2009; Hawley
et al., 2013; Hersey et al., 2013; Kelly et al., 2009; Roberto et al.,
2012; van Herpen & Trijp, 2011). Schulte-Mecklenbeck and colleagues
(2013) analyzed strategy use in information acquisition during food
choices and found that choices are often based on very simple
heuristics, which reduce computation time. As GDA labels are
cognitively more demanding than TL labels, they likely provide
information that is harder to process, which is in turn utilized less.
In this study, we did not classify subject’s overt behavior into
choice strategies. Therefore, future studies using strategy analysis
in combination with actual process tracing data (e.g., eye-tracking or
mouse-tracking) would be valuable to analyze, for example, if salient
labels interfere with an automatic preference-based choice heuristic
or actually promote a fully-informed choice strategy.
To our knowledge, this is the first study to also analyze how exactly
health information is integrated into the decision-making process, and
how this is changed by the more salient TL display, using empirical
choice and RT data in a DDM. This type of decision is interesting
because subjects need to combine information from pictorial stimuli
(food products) as well as symbolic and numeric information (labels).
Although DDMs have been used before in consumer contexts, it was not
known a priori whether the DDM could account for the impact of
nutrition information on the valuation process. Importantly, the DDM
provides information above and beyond traditional logit analyses, as it
estimates different parameters accounting for various decisional
processes, informing us not only whether health information influences
choices but also how exactly health information is incorporated into
the decision. In particular, we investigated whether the salient health
information influences the valuation process, or whether it induces a
simple response bias. Our data support the hypothesis that salient,
color-coded nutrition information directly influences the valuation
process in favor of healthier options, as the behavioral effect of
nutrition labels could only be explained by changes in drift rate, but
not in starting point bias. This finding provides evidence that
nutrition label information and taste preferences are incorporated into
the valuation process, ruling out the alternative mechanism that these
labels only induce an automatic stimulus-response choice bias. Further,
we find that for saliently labeled products the weight on taste gets
discounted, while the sensitivity to health increases.
In two additional experiments, subjects made the same binary
choices, but products were labeled with simplified nutrition
information, displaying only the amount of one nutrient, that is,
sugar. Overall, subjects made less healthy choices when confronted
with information on only one nutrient (sugar). The effects of
simplified nutrition information were weaker, suggesting that more
comprehensive, salient information is more effective (see
Supplement and Table
S1).
It is possible, given that we used the actual nutritional information
for each product, that healthiness could be correlated with other
features of the products. Thus the changes in behavior due to the TL
vs. GDA labels cannot unambiguously be attributed to an increase in the
weight on health information, though we do see this as the most likely
explanation. Importantly, our use of real products paired with real
nutritional information implies that, in any case, the use of TL labels
in real-world applications should promote choosing healthy products.
As many food decisions occur automatically or habitually (Rangel,
2013; Wansink & Sobal, 2007), nutrition labels may have a decisive
role in triggering goal-directed decisions that incorporate not only
taste considerations, but also long-term health outcomes. We
demonstrate that salient labels increase the integration of health
considerations into the decision process; salient nutrition labels may
therefore interfere with automatic decision processes and trigger
re-evaluation of the choice options. The results have obvious
implications for public policy interventions. Environmental nudges,
including understandable nutrition labels, are important pillars of
public policy interventions aiming at improving dietary preferences
and choices (Hawkes et al., 2015). Salient TL nutrition labels seem
to be a feasible option to increase the consideration of health
attributes in every-day choice situations to encourage consumers to
purchase the healthier product. Of course, the unnatural size and
placement of nutrition labels may have influenced the valuation
process. Previous studies have shown that display size is an important
determinant of attention (Bialkova & van Trijp, 2010), therefore,
future studies with a more natural design are necessary. In addition,
real-world choice alternatives include many other product attributes,
next to nutrition labeling, as well as subjects’ individual
characteristics, which were shown to influence nutrition label use and
understanding (Miller & Cassady, 2012). The impact of these factors
and their interaction with nutrition labels warrants further
investigation.
In sum, the results presented in this study provide insights into the
nature of computational processes that take place during simple choices
between two food products along with health attribute labels. Our
results suggest that health information can be successfully coalesced
with taste-preferences based on representational values during the
decision-making process.
References
Annett, L. E., Muralidharan, V., Boxall, P. c., Cash, S. b., & Wismer,
W. v. (2008). Influence of Health and Environmental Information on
Hedonic Evaluation of Organic and Conventional Bread. Journal
of Food Science, 73(4), H50–H57.
http://doi.org/10.1111/j.1750-3841.2008.00723.x.
Becker, M. W., Bello, N. M., Sundar, R. P., Peltier, C., & Bix, L.
(2015). Front of pack labels enhance attention to nutrition information
in novel and commercial brands. Food Policy, 56,
76–86. http://doi.org/10.1016/j.foodpol.2015.08.001.
Bialkova, S., Grunert, K. G., Juhl, H. J., Wasowicz-Kirylo, G.,
Stysko-Kunkowska, M., & van Trijp, H. C. M. (2014). Attention mediates
the effect of nutrition label information on consumers’ choice.
Evidence from a choice experiment involving eye-tracking.
Appetite, 76, 66–75.
http://doi.org/10.1016/j.appet.2013.11.021.
Bialkova, S., & van Trijp, H. (2010). What determines consumer
attention to nutrition labels? Food Quality and Preference,
21(8), 1042–1051.
http://doi.org/10.1016/j.foodqual.2010.07.001.
Bogacz, R. (2007). Optimal decision-making theories: linking
neurobiology with behaviour. Trends in Cognitive Sciences,
11(3), 118–125. http://doi.org/10.1016/j.tics.2006.12.006.
Borgmeier, I., & Westenhoefer, J. (2009). Impact of different food
label formats on healthiness evaluation and food choice of consumers: a
randomized-controlled study. BMC Public Health, 9(1),
184. http://doi.org/10.1186/1471-2458-9-184.
Borland, R., Wilson, N., Fong, G. T., Hammond, D., Cummings, K. M.,
Yong, H.-H., … McNeill, A. (2009). Impact of graphic and text warnings
on cigarette packs: findings from four countries over five years.
Tobacco Control, 18(5), 358–364.
http://doi.org/10.1136/tc.2008.028043.
Bruce, A. S., Bruce, J. M., Black, W. R., Lepping, R. J., Henry, J. M.,
Cherry, J. B. C., … Savage, C. R. (2014). Branding and a child’s brain:
an fMRI study of neural responses to logos. Social Cognitive
and Affective Neuroscience, 9(1), 118–122.
http://doi.org/10.1093/scan/nss109.
Busemeyer, J. R., & Townsend, J. T. (1993). Decision field theory: A
dynamic-cognitive approach to decision making in an uncertain
environment. Psychological Review, 100(3), 432–459.
http://doi.org/10.1037/0033-295X.100.3.432.
Campos, S., Doxey, J., & Hammond, D. (2011). Nutrition labels on
pre-packaged foods: a systematic review. Public Health
Nutrition, 14(8), 1496–1506.
http://doi.org/10.1017/S1368980010003290.
CIAA (EU Food and Drink Confederation). (2014, September 19). Guideline
Daily Amounts (GDAs) - GDAs Explained. Retrieved September 19, 2014,
from http://gda.fooddrinkeurope.eu/asp2/what\_are\_gdas.asp.
Cowburn, G., & Stockley, L. (2005). Consumer understanding and use of
nutrition labelling: a systematic review. Public Health
Nutrition, 8(1), 21–28.
De Martino, B., Fleming, S. M., Garrett, N., & Dolan, R. J. (2013).
Confidence in value-based choice. Nature Neuroscience,
16(1), 105–110. http://doi.org/10.1038/nn.3279.
Department of Health & Food Standards Agency (FSA). (2013, June
19). Guide to creating a front of Pack (FoP) Nutrition Label for
Pre-packed Products sold through Retail Outlets. Retrieved September
19, 2014, from
https://www.gov.uk/government/publications/front-of-pack-nutrition-labelling-guidance.
Enax, L., Hu, Y., Trautner, P., & Weber, B. (2015). Nutrition labels
influence value computation of food products in the ventromedial
prefrontal cortex. Obesity, 23(4), 786–792.
http://doi.org/10.1002/oby.21027.
Enax, L., Krapp, V., Piehl, A., & Weber, B. (2015). Effects of social
sustainability signaling on neural valuation signals and
taste-experience of food products. Frontiers in Behavioral
Neuroscience, 247. http://doi.org/10.3389/fnbeh.2015.00247.
Enax, L., Weber, B., Ahlers, M., Kaiser, U., Diethelm, K., Holtkamp, D.,
… Kersting, M. (2015). Food packaging cues influence taste perception
and increase effort provision for a recommended snack product in
children. Frontiers in Psychology, 6, 882.
http://doi.org/10.3389/fpsyg.2015.00882.
Epstein, L. H., Truesdale, R., Wojcik, A., Paluch, R. A., & Raynor, H.
A. (2003). Effects of deprivation on hedonics and reinforcing value of
food. Physiology & Behavior, 78(2), 221–227.
Fehr, E., & Rangel, A. (2011). Neuroeconomic Foundations of Economic
Choice — Recent Advances. Journal of Economic Perspectives,
25(4), 3–30. http://doi.org/10.1257/jep.25.4.3.
Fernqvist, F., & Ekelund, L. (2013). Consumer attitudes towards
origin and organic — the role of credence labels on consumers’
liking of tomatoes. European Journal of Horticultural
Science. 78(4), 184–190.
Fischbacher, U. (2007). z-Tree: Zurich toolbox for ready-made economic
experiments. Experimental Economics, 10(2), 171–178.
http://doi.org/10.1007/s10683-006-9159-4.
Genz, A., Bretz, F., Miwa, T., Mi, X., Leisch, F., Scheipl, F., …
Hothorn, T. (2014). mvtnorm: Multivariate normal and t distributions
(Version 1.0–2). Retrieved from
http://cran.r-project.org/web/packages/mvtnorm/index.html.
Gorton, D., Ni Mhurchu, C., Chen, M.-H., & Dixon, R. (2009). Nutrition
labels: a survey of use, understanding and preferences among ethnically
diverse shoppers in New Zealand. Public Health Nutrition,
12(9), 1359–1365. http://doi.org/10.1017/S1368980008004059.
Graham, D. J., & Jeffery, R. W. (2012). Predictors of nutrition label
viewing during food purchase decision making: an eye tracking
investigation. Public Health Nutrition, 15(2),
189–197. http://doi.org/10.1017/S1368980011001303.
Graham, D. J., Orquin, J. L., & Visschers, V. H. M. (2012). Eye
tracking and nutrition label use: A review of the literature and
recommendations for label enhancement. Food Policy,
37(4), 378–382. http://doi.org/10.1016/j.foodpol.2012.03.004.
Grunert, K. G., Fernández-Celemín, L., Wills, J. M., Storcksdieck
genannt Bonsmann, S., & Nureeva, L. (2010). Use and understanding of
nutrition information on food labels in six European countries.
Journal of Public Health, 18(3),
261–277. http://doi.org/10.1007/s10389-009-0307-0.
Grunert, K. G., & Wills, J. M. (2007). A review of European research on
consumer response to nutrition information on food labels.
Journal of Public Health, 15(5), 385–399.
http://doi.org/10.1007/s10389-007-0101-9.
Hamlin, R. P., McNeill, L. S., & Moore, V. (2015). The impact of
front-of-pack nutrition labels on consumer product evaluation and
choice: an experimental study. Public Health Nutrition,
18(12), 2126–2134. http://doi.org/10.1017/S1368980014002997.
Hare, T. A., Malmaud, J., & Rangel, A. (2011). Focusing attention on
the health aspects of foods changes value signals in vmPFC and improves
dietary choice. The Journal of Neuroscience: The Official
Journal of the Society for Neuroscience, 31(30), 11077–11087.
http://doi.org/10.1523/JNEUROSCI.6383-10.2011.
Hawkes, C., Smith, T. G., Jewell, J., Wardle, J., Hammond, R. A.,
Friel, S., … Kain, J. (2015). Smart food policies for obesity
prevention. The Lancet, 385(9985), 2410–2421.
http://doi.org/10.1016/S0140-6736(14)61745-1.
Hawley, K. L., Roberto, C. A., Bragg, M. A., Liu, P. J., Schwartz, M.
B., & Brownell, K. D. (2013). The science on front-of-package food
labels. Public Health Nutrition, 16(3), 430–439.
http://doi.org/10.1017/S1368980012000754.
Helfer, P., & Shultz, T. R. (2014). The effects of nutrition labeling
on consumer food choice: a psychological experiment and computational
model. Annals of the New York Academy of Sciences,
1331, 174–185. http://doi.org/10.1111/nyas.12461.
Hersey, J. C., Wohlgenant, K. C., Arsenault, J. E., Kosa, K. M., &
Muth, M. K. (2013). Effects of front-of-package and shelf nutrition
labeling systems on consumers. Nutrition Reviews,
71(1), 1–14. http://doi.org/10.1111/nure.12000.
Hübl, G., & Trifts, V. (2000). Consumer Decision Making in Online
Shopping Environments: The Effects of Interactive Decision Aids.
Marketing Science, 19(1), 4–21.
http://doi.org/10.1287/mksc.19.1.4.15178.
Jones, G., & Richardson, M. (2007). An objective examination of
consumer perception of nutrition information based on healthiness
ratings and eye movements. Public Health Nutrition,
10(3), 238–244. http://doi.org/10.1017/S1368980007258513.
Kelly, B., Hughes, C., Chapman, K., Louie, J. C.-Y., Dixon, H.,
Crawford, J., … Slevin, T. (2009). Consumer testing of the
acceptability and effectiveness of front-of-pack food labelling systems
for the Australian grocery market. Health Promotion
International, 24(2), 120–129.
http://doi.org/10.1093/heapro/dap012.
Krajbich, I., Armel, C., & Rangel, A. (2010). Visual fixations and the
computation and comparison of value in simple choice. Nature
Neuroscience, 13(10), 1292–1298.
http://doi.org/10.1038/nn.2635.
Krajbich, I., Oud, B., & Fehr, E. (2014). Benefits of neuroeconomic
modeling: new policy interventions and predictors of preference.
American Economic Review, 104(5), 501–506.
http://doi.org/10.1257/aer.104.5.501.
Krajbich, I., & Smith, S. M. (2015). Modeling Eye Movements and
Response Times in Consumer Choice. Journal of Agricultural &
Food Industrial Organization, 13(1), 55–72.
http://doi.org/10.1515/jafio-2015-0016.
Levy, D. E., Riis, J., Sonnenberg, L. M., Barraclough, S. J., &
Thorndike, A. N. (2012). Food choices of minority and low-income
employees: a cafeteria intervention. American Journal of
Preventive Medicine, 43(3), 240–248.
http://doi.org/10.1016/j.amepre.2012.05.004.
Loftus, G. R. (1978). On interpretation of interactions. Memory
& Cognition, 6(3), 312–319.
http://doi.org/10.3758/BF03197461.
Maier, S. U., Makwana, A. B., & Hare, T. A. (2015). Acute stress
impairs self-control in goal-directed choice by altering multiple
functional connections within the brain’s decision circuits.
Neuron, 87(3), 621–631.
http://doi.org/10.1016/j.neuron.2015.07.005.
Maubach, N., & Hoek, J. (2008). The effect of alternative nutrition
information formats on consumers’ evaluations of a children’s breakfast
cereal. Partnerships, Proof and Practice - International
Nonprofit and Social Marketing Conference 2008 - Proceedings.
Retrieved from http://ro.uow.edu.au/insm08/1.
Miller, L. M., & Cassady, D. L. (2012). Making Healthy Food Choices
Using Nutrition Facts Panels: The Roles of Knowledge, Motivation,
Dietary Modifications Goals, and Age. Appetite,
59(1), 129–139. http://doi.org/10.1016/j.appet.2012.04.009.
Moser, R., Raffaelli, R., & Thilmany, D. D. (2011). Consumer
Preferences for Fruit and Vegetables with Credence-Based Attributes: A
Review. International Food and Agribusiness Management Review,
14(2). Retrieved from
https://ideas.repec.org/a/ags/ifaamr/103990.html.
Ng, J., Stice, E., Yokum, S., & Bohon, C. (2011). An fMRI study of
obesity, food reward, and perceived caloric density. Does a low-fat
label make food less appealing? Appetite, 57(1),
65–72. http://doi.org/10.1016/j.appet.2011.03.017.
Orquin, J. L., Scholderer, J., & Jeppesen, H. (2012). What you see is
what you buy: How saliency and surface size of packaging elements
affect attention and choice. Society for Advancement of
Behavioural Economics. Retrieved from
http://scholar.google.com/scholar?cluster=11288207893494723098\&hl=en\&oi=scholarr.
Philiastides, M. G., & Ratcliff, R. (2013). Influence of branding on
preference-based decision making. Psychological Science,
24(7), 1208–1215. http://doi.org/10.1177/0956797612470701.
R Core Team. (2013). R: A language and environment for
statistical computing. (Vol. R Foundation for Statistical Computing).
Vienna, Austria. Retrieved from http://www.R-project.org/..
Raghunathan, R., Naylor, R. W., & Hoyer, W. D. (2006). The unhealthy =
tasty intuition and its effects on taste inferences, enjoyment, and
choice of food products. Journal of Marketing, 70(4),
170–184. http://dx.doi.org/10.1509/jmkg.70.4.170.
Rangel, A. (2013). Regulation of dietary choice by the decision-making
circuitry. Nature Neuroscience, 16(12), 1717–1724.
http://doi.org/10.1038/nn.3561.
Ratcliff, R. (1978). A theory of memory retrieval. Psychological
Review, 85(2), 59–108.
http://doi.org/10.1037/0033-295X.85.2.59.
Ratcliff, R., & Smith, P. L. (2004). A comparison of sequential
sampling models for two-choice reaction time. Psychological
Review, 111(2), 333–367.
http://doi.org/10.1037/0033-295X.111.2.333.
Roberto, C. A., Bragg, M. A., Schwartz, M. B., Seamans, M. J., Musicus,
A., Novak, N., & Brownell, K. D. (2012). Facts up front versus traffic
light food labels: a randomized controlled trial. American
Journal of Preventive Medicine, 43(2), 134–141.
http://doi.org/10.1016/j.amepre.2012.04.022.
Sabbe, S., Verbeke, W., Deliza, R., Matta, V., & Van Damme, P. (2009).
Effect of a health claim and personal characteristics on consumer
acceptance of fruit juices with different concentrations of açaí
(Euterpe oleracea Mart.). Appetite, 53(1), 84–92.
http://doi.org/10.1016/j.appet.2009.05.014.
Savoie, N., Barlow Gale, K., Harvey, K. L., Binnie, M. A., & Pasut, L.
(2013). Consumer perceptions of front-of-package labelling systems and
healthiness of foods. Canadian Journal of Public Health = Revue
Canadienne De Santé Publique, 104(5), e359-363.
Sonnenberg, L., Gelsomin, E., Levy, D. E., Riis, J., Barraclough, S.,
& Thorndike, A. N. (2013). A traffic light food labeling intervention
increases consumer awareness of health and healthy choices at the
point-of-purchase. Preventive Medicine, 57(4),
253–257. http://doi.org/10.1016/j.ypmed.2013.07.001.
Taubinsky, D., Morris, C. L., Schuldt, J. P., Chabris, C. F., &
Laibson, D. I. (2009). The allocation of time in
decision-making. (Scholarly Articles No. 4481495). Harvard University
Department of Economics. Retrieved from
https://ideas.repec.org/p/hrv/faseco/4481495.html.
Temple, N. J., & Fraser, J. (2014). Food labels: a critical
assessment. Nutrition, 30(3),
257–260. http://doi.org/10.1016/j.nut.2013.06.012.
Thaler, H., & Sunstein, C. R. (2008). Nudge: Improving decisions about
health, wealth, and happiness. Constitutional Political
Economy, 19(4), 356–360.
http://doi.org/10.1007/s10602-008-9056-2.
Thorndike, A. N., Sonnenberg, L., Riis, J., Barraclough, S., & Levy, D.
E. (2012). A 2-phase labeling and choice architecture intervention to
improve healthy food and beverage choices. American Journal of
Public Health, 102(3), 527–533.
http://doi.org/10.2105/AJPH.2011.300391.
Trudel, R., & Murray, K. B. (2011). Why didn’t I think of that?
Self-regulation through selective information processing.
Journal of Marketing Research, 48(4), 701–712.
http://doi.org/10.1509/jmkr.48.4.701.
Trudel, R., Murray, K. B., Kim, S., & Chen, S. (2015). The impact of
traffic light color-coding on food health perceptions and choice.
Journal of Experimental Psychology: Applied, 21(3),
255–275. http://doi.org/10.1037/xap0000049.
van Herpen, E., & Trijp, H. C. M. van. (2011). Front-of-pack nutrition
labels. Their effect on attention and choices when consumers have
varying goals and time constraints. Appetite, 57(1),
148–160. http://doi.org/10.1016/j.appet.2011.04.011.
Voss, A., Nagler, M., & Lerche, V. (2013). Diffusion models in
experimental psychology: A practical introduction. Experimental
Psychology, 60(6), 385–402.
http://doi.org/10.1027/1618-3169/a000218.
Voss, A., Voss, J., & Lerche, V. (2015). Assessing cognitive processes
with diffusion model analyses: a tutorial based on fast-dm-30.
Frontiers in Psychology, 6, 336.
http://doi.org/10.3389/fpsyg.2015.00336.
Wabersich, D. (2014). RWiener: Wiener process distribution functions
(Version 1.2-0). Retrieved from
http://cran.r-project.org/web/packages/RWiener/index.html.
Wagenmakers, E.-J., Krypotos, A.-M., Criss, A. H., & Iverson, G.
(2012). On the interpretation of removable interactions: A survey of
the field 33 years after Loftus. Memory & Cognition,
40(2), 145–160. http://doi.org/10.3758/s13421-011-0158-0.
Wansink, B., & Chandon, P. (2006). Can “low-fat” nutrition labels lead
to obesity? Journal of Marketing Research, 43(4),
605–617. http://doi.org/10.1509/jmkr.43.4.605.
Wansink, B., & Sobal, J. (2007). Mindless eating the 200 daily food
decisions we overlook. Environment and Behavior,
39(1), 106–123. http://doi.org/10.1177/0013916506295573.
Winter, B. (2013). Linear models and linear mixed effects models in R
with linguistic applications. Retrieved March 16, 2015, from
http://arxiv.org/pdf/1308.5499.pdf.
This document was translated from LATEX by
HEVEA.