Judgment and Decision Making, Vol. 11, No. 6, November 2016, pp. 572-581
Semantic cross-scale numerical anchoringAdam J. L. Harris* Maarten
Speekenbrink# |
Anchoring effects are robust, varied and can be
consequential. Researchers have provided a variety of alternative
explanations for these effects. More recently, it has become
apparent that anchoring effects might be produced by a variety of
different processes, either acting simultaneously, or else
individually in distinct situations. An unresolved issue is whether
anchoring, aside from simple numeric priming, can transcend
scales. That is, is it necessary that the anchor value and the
target judgment are expressed in the same units? Despite some
theoretical predictions to the contrary, this paper demonstrates
semantic cross-scale anchoring in four experiments. Such effects are
important for the direction of future theorising on the causes of
anchoring effects and understanding the scope of their consequences
in applied domains.
Keywords: anchoring, heuristics, scale distortion, selective accessibility, anchoring-and-adjustment, bias.
1 Semantic cross-scale numerical anchoring
Tversky and Kahneman (1974) famously asked their participants to
estimate the percentage of African countries in the United
Nations. Before providing their estimate, participants were asked
whether the percentage was larger or smaller than a number that was
randomly produced by a wheel of fortune. Participants for whom the
wheel produced a larger number estimated a higher percentage of
African countries in the United Nations than did those for whom the
wheel produced a smaller number. Tversky and Kahneman referred to this
as an anchoring effect, which in this instance is clearly irrational,
for a random number produced by a wheel of fortune should not
influence one’s estimates. Since Tversky and Kahneman’s seminal work,
anchoring effects have been observed in many domains. In the applied
arena, these include the pricing of real estate by estate agents
(Northcraft & Neale, 1987), sentencing decisions of judges (for a
review see Englich, 2006), students’ evaluations of course instructors
(Thorsteinson, Breier, Atwell, Hamilton & Privette, 2008),
negotiations (Galinsky & Mussweiler, 2001; Schaerer, Swaab &
Galinsky, 2015), supermarket purchase decisions (Wansink, Kent &
Hoch, 1998), and the payment of credit card bills (Navarro-Martinez,
Salisbury, Lemon, Stewart, Matthews & Harris, 2011; Stewart,
2009). Despite the obvious implications of such effects, there is no
agreed unifying theory for the effects. If anything, debate over the
underlying psychological processes appears to be intensifying, as
additional theories are advanced (Frederick & Mochon, 2012) and
previous influential results revisited (Simmons, LeBoeuf & Nelson,
2010).
Candidate accounts advanced to explain anchoring effects have included
anchoring-and-adjustment (Tversky & Kahneman, 1974), numeric priming
(Wilson, Houston, Etling & Brekke, 1996; Wong & Kwong, 2000),
magnitude priming (Oppenheimer, LeBoeuf & Brewer, 2008; see
Sleeth-Keppler, 2013, for a related account), selective accessibility
(Mussweiler & Strack, 1999, 2000a, 2000b, 2001; Strack & Mussweiler,
1997; see Chapman & Johnson, 1999, for a related account), and
scale distortion (Frederick & Mochon, 2012; Mochon & Frederick,
2013).
Scale distortion is the most recent theory advanced to explain
anchoring effects. An important feature of this account is that it is
the subjective perception of what values on the response scale mean
rather than the subjective impression of the stimulus itself (stimulus
distortion) that is altered (as shown in Figure ??).
Specifically, scale distortion suggests that, after consideration of a
small value (e.g., 5 lbs.), a contrast effect leads larger numbered
values (e.g., 1000 lbs.) to appear larger. Thus, the weight of an
object that is objectively 1000 lbs. is represented with a value less
than this (anchoring) because the perception of the numerical scale
has been altered. By contrast, selective accessibility is a theory of
stimulus distortion: Upon being asked whether an object (objectively
heavier than 5 lbs.) is heavier or lighter than 5 lbs., confirmatory
hypothesis testing results in selective recruitment of information
more consistent with the object being lighter than it is. When
subsequently asked how heavy the object is, this information results
in the impression of a lighter object (e.g., Strack & Mussweiler,
1997).
One source of evidence put forward in support of the scale distortion
account of anchoring was a failure to observe anchoring effects where
the scale unit of the anchor and the scale unit of the target judgment
differed (i.e., cross-scale anchoring was not observed, Frederick &
Mochon, 2012; a negative result also observed in Chapman & Johnson,
1994). The aim of the present investigation is to test whether
cross-scale anchoring effects can ever be obtained — outside of
low-level numeric and magnitude priming effects (Critcher & Gilovich,
2008 [but see Matthews, 2011, for critique]; Mussweiler & Strack,
2001, Study 3; Oppenheimer et al., 2008; Sleeth-Keppler, 2013; Wilson
et al., 1996; Wong & Kwong, 2000), which are likely to be less
long-lasting and resistant to change than those resulting from
semantic processes (see e.g., Blankenship, Wegener, Petty,
Detweiler-Bedell & Macy, 2008).
| Figure 1: A stimulus and scale distortion based account of the effect of a low anchor on estimates of a giraffe’s weight. Adapted from “A scale distortion theory of anchoring,” by S. W. Frederick and D. Mochon, 2012, Journal of Experimental Psychology: General, 141, p. 125. Copyright 2011 by the American Psychological Association. |
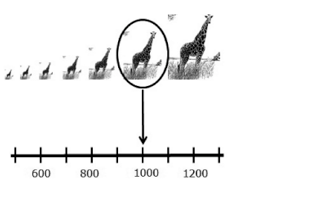 |
Control (no anchor)
With no anchor, people form an internal representation of the giraffe’s
size (represented by the top row) which they map onto an overt response on
the scale (pounds).
|
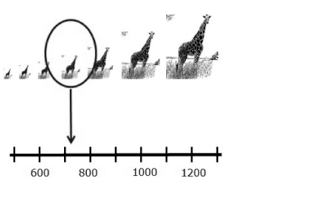 |
Stimulus Distortion
A low anchor results in a smaller internal representation of the size of a
giraffe, leading to a smaller numerical estimate of its weight.
|
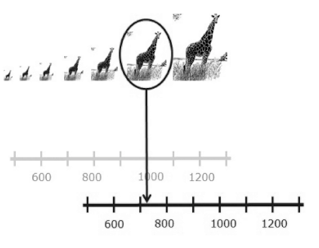 |
Scale Distortion
A low anchor results in large numbers on the scale feeling larger, which
consequently then correspond to larger exemplars (shifting the mapping from
the original greyed out scale, to the distorted one below). This distortion
implies that a smaller number is sufficient to communicate the (unchanged)
internal representation of the giraffe’s size.
|
In addition to Frederick and Mochon (2012), Harvey (2011) proposes
that anchoring effects might occur as an overgeneralisation of a
judgment strategy that is rational for (typically autocorrelated) time
series data. Potentially, he suggests, “all that is necessary for two
successive values to be treated as part of the same data series is
that they be labelled as being on the same scale” (p. 106). Whilst
an observation of cross-scale anchoring would not speak directly to
the detriment of any particular theory, it would be an important
result to be aware of for future theory development and
refinement. Furthermore, the applied consequences of anchoring are
likely greater if cross-scale anchoring can be observed: decision
making is typically dependent upon one’s subjective impression of a
stimulus, and not the label that one happens to give that
impression. Consequently, demonstrations of cross-scale anchoring
suggest a more consequential effect than a failure to demonstrate such
transfer.
Frederick and Mochon (2012) presented four studies in which an
anchoring effect was observed when the anchor was presented on the
same scale as the target judgment, but was not observed when the
anchor was presented on a different scale. A representative example of
these studies was that participants’ judgments of a giraffe’s weight
in lbs. were higher (than a control condition with no anchor) after
estimating the weight of a blue whale in lbs, but were unaffected when
estimating the weight of a blue whale in tons (Frederick & Mochon,
2012, Study 3B). Such a task differs from standard tasks in the
anchoring literature, in which participants are asked to make a
comparative judgment between the anchor and the stimulus (e.g., “Is
the proportion of African countries greater or less than 80%?” –
Tversky & Kahneman, 1974). Inclusion of such a question might lead to
cross-scale anchoring effects for one of (at least) two reasons:
-
The comparison question will trigger confirmatory hypothesis
testing, consequently leading to greater accessibility of
information consistent with the anchor value, generating an
anchoring effect via selective accessibility (e.g., Strack &
Mussweiler, 1997).
- The comparison question will lead participants to employ an
approximate conversion between the scales, which will allow scale
distortion processes to operate. Mochon and Frederick (2013)
demonstrate that a comparative question is necessary for anchoring
effects when the anchor stimulus and the target stimulus are
sufficiently different from one another. Even on the scale
distortion account, some comparison between the anchor and target
seems necessary, and when such a comparison is not instigated by the
nature of the anchor and target themselves, a comparison question
may be required.
In the present paper, Experiment 1 allows for both these processes to
potentially operate, but either way demonstrates the unique result of
cross-scale anchoring (where a numeric priming account predicts an
opposite result). Experiments 2 and 3, however, make the second process
difficult to envisage, since they demonstrate anchoring that is both
cross-scale and cross-dimensional. Experiments 2 and 3 demonstrate that an
estimate of weight (in lbs.) can bias an estimate of height (in
feet). It is difficult to envisage a straightforward conversion
between weight and height, as required for (2) above. Experiment 4,
finally, provides support for one consequence of cross-scale
anchoring: the failure of a straightforward intervention to avoid
anchoring effects of credit card minimum payment information on credit
card repayment decisions.
2 Experiment 1
Experiment 1 was based on Frederick and Mochon (2012, Study 3B), but
included an additional manipulation of whether or not a comparative
question was asked.
2.1 Method
Participants
6 participants were initially removed from the dataset for failing to
follow experimental instructions — providing a large range for their
best estimate of the giraffe’s weight, or they reported estimating the
giraffe’s weight in tons rather than lbs. 3 additional participants
(in line with departmental ethical guidelines) were excluded for not
reporting their age, or reporting that they were younger than 18 years
old. After these exclusions, there were 857 U.S-based Mechanical Turk
workers who participated in this experiment (319 female), aged 18–76
(median = 25).
Design, materials and procedure
The experiment was run online through http://www.qualtrics.com. There
were 5 (between-participant) experimental conditions. A control
condition simply required participants to estimate the weight of an
adult male giraffe in lbs. In the ‘lbs-no comparison’ condition,
participants estimated the weight of an adult male African elephant in
lbs. before estimating the weight of an adult male giraffe in lbs. The
‘tons-no comparison’ condition was the same, except that participants
estimated the elephant’s weight in tons. The lbs-comparison condition
and the tons-comparison condition replicated the latter two
conditions, but also required participants to indicate, after
estimating the weight of an elephant and before estimating the weight
of a giraffe, whether a giraffe weighs more or less than an
elephant. The dependent variable was the estimate of the giraffe’s
weight (lbs.).
All participants subsequently provided their age and gender.
2.2 Results and Discussion
Data preparation
Before further analysis, 11 additional participants were excluded for
estimating the giraffe’s weight as less than 10 lbs. All these
participants were in a condition that had first estimated the weight
of an elephant in tons. Given that 4 participants in this condition
had explicitly reported misreading the question and providing an
estimate in tons, it was assumed that these participants had made the
same mistake. One participant (from the lbs-comparison condition,
where higher estimates were predicted) was excluded for estimating the
giraffe’s weight at 1 million lbs. (as well as an estimate of the
elephant’s weight of 200 million lbs.(!)).Following these initial
exclusions, the mean and standard deviation of the data were
calculated, and participants whose estimates of the giraffe’s weight
were more than 3 standard deviations from the mean were excluded (the
cut-off for inclusion was an estimate that was less than 10, 621
lbs.). This excluded 10 further participants (3 estimated 12,000 lbs.;
1 estimated 14,500 lbs.; 3 estimated 15,000 lbs.; and estimates of
16,000; 20,000 and 70,000 lbs.).
835 participants (308 female) were thus retained for analysis, with an
age range of 18 to 76 years (median = 25). Remaining participants were
fairly evenly distributed across conditions, with between 161 and 171
in each condition. Analyses without these exclusions are presented in
the supplementary
materials, and any analysis for which an exclusion alters the
pattern of significance is noted with a footnote below.
Analysis
Because responses were positively skewed, all responses were log
transformed for inferential analyses, although for clarity we report
the non-transformed descriptive statistics (all patterns of
significance were the same when non-transformed data were
analysed). We initially followed Frederick and Mochon (2012),
comparing each of the experimental groups with the control
condition. The mean estimate of the giraffe’s weight in the control
condition was 1131 lbs. (SE = 72). We replicated Frederick and
Mochon’s results, observing an anchoring effect in the ‘lbs-no
comparison’ condition (mean = 1488, SE = 115, t(337) = 3.15,
p = .002, Cohen’s d = 0.34), and no anchoring effect in the
‘tons-no comparison’ condition (mean = 1065, SE = 66,
t(330) = 0.32, p = .75, d = −.03).
In the comparison conditions, 327/335 participants answered the
comparison question as predicted (elephant heavier than giraffe),
confirming that an elephant’s weight is a high anchor for a giraffe’s
weight. The critical analysis of estimates of a giraffe’s weight
concerned the ‘tons-comparison’ condition. Here, a significant
(cross-scale) anchoring effect was observed (mean = 1588, SE = 113,
t(335) = 3.59, p < .001, d = 0.39).1 A numerical priming explanation
would predict the opposite result, since the median estimate of the
elephant’s weight in tons was 3 tons (a small numeric
anchor).2 Moreover, a magnitude priming explanation would not
predict the lack of an effect with the absence of a comparative
question. To complete the pairwise tests with the control condition,
the ’lbs-comparison’ condition was compared with the control group,
and again a significant anchoring effect was observed (mean = 1593, SE
= 105, t(338) = 4.17, p < .001, d = 0.45). The complete
descriptive statistics are shown in Figure ?? (a table
summarising the anchoring effects observed across all experiments can
be found in the appendix as Table ??).
In terms of comparing the results of the experimental conditions with
the control group, the data were in line with experimental
predictions. To better ascertain the relative contributions of scale
consistency and the comparison question, a 2x2 ANOVA was conducted
between the 4 experimental conditions. All 3 effects were significant
in this analysis. The strongest effect was a main effect of comparison
question, such that higher estimates (i.e., a stronger anchoring
effect) were observed in the presence of the comparison question than
in its absence (see Figure ??, F(1, 660) = 12.65,
p < .001, MSE = 0.11, ηp2 = .019). There was also a
main effect of scale, such that a stronger anchoring effect was
observed when the anchor was on the same scale as the target judgment
(i.e., lbs.) (F(1, 660) = 7.36, p = .007, MSE = 0.11,
ηp2 = .011), and an interaction between the variables,
(F(1, 660) = 4.33, p = .038, MSE = 0.11,
ηp2 = .007).3 Simple effects tests confirmed what is suggested in
Figure ??. The scale on which the anchor was judged had
an effect only when no comparison was required between the anchor and the
target, (F(1, 660) = 11.42, p < .001, MSE = 0.11; other
F < 1). The presence of a comparison question had a significant
effect only when the anchor was judged in tons, (F(1, 660) = 15.69,
p < .001, MSE = 0.11; for lbs.: F[1, 660] = 1.11,
p = .29, MSE = 0.11).
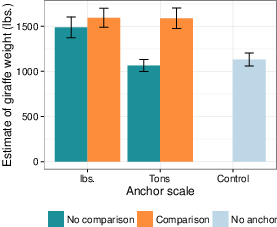
| Figure 2: Estimates of the giraffe’s weight (lbs.) across all conditions of Experiment 1. The control group did not judge an anchor, but is included for comparison. Error bars represent plus and minus 1 standard error. |
Thus, when participants are required to make a comparison between the
anchor and the target, it makes no difference whether they estimate
the size of the anchor using the same scale as the target or a
different one, the size of the anchoring effect is indistinguishable
(see Figure 2). As mentioned in the Introduction, the cross-scale
anchoring effect observed in this experiment could have arisen as a
result of participants distorting the lbs. scale after first having
translated the judgement of the whale onto this scale (e.g., by
multiplying the number of tons by 2000). Regardless, the present
experiment still demonstrates that cross-scale anchoring effects can
occur. However, it is an open question as to whether such effects can
occur when such a translation is not feasible, for instance when the
judgments about the anchor and target are about different dimensions,
not just on different scales. Experiment 2 was designed to answer this
question.
3 Experiment 2
Experiment 2 is based on Frederick and Mochon’s (2012) Study 4 and
tests whether cross-dimensional anchoring (estimates of a giraffe’s
height being lower having first judged a wolf’s
weight) can be observed once a comparative question is
included. On the selective accessibility account, the introduction of
the comparison question means that when determining whether a giraffe
weighs more or less than a wolf, participants will engage in a search
for information about a giraffe consistent with it weighing the same
as a wolf (Mussweiler & Strack, 1999). Hence, when they come to
estimate the giraffe’s height, their representation of a giraffe is
smaller and so an anchoring effect could be observed. It is useful to
note that early support for the selective accessibility theory of
anchoring (Strack & Mussweiler, 1997) was obtained from an
observation that judgments of the height of the Brandenburg Gate did
not influence estimates of the width of the Brandenburg Gate (though
Frederick & Mochon, 2012 and Mochon & Frederick, 2013, observed such
cross-dimensional transfer when estimates used the same scale in an
experiment with increased power). Here, we purport that selective
accessibility could predict an influence of weight on height judgments
(which are, by necessity, presented on different scales) because the
height and weight of animals tend to be correlated in the real world.
Whilst Experiment 1 employed a high anchor, Experiment 2 employed a
low anchor.
3.1 Method
Participants
325 U.S. participants (107 female) aged 18–69 (median = 26) were recruited via Amazon Mechanical Turk.
Design, materials and procedure
Participants were randomly
assigned to 1 of 2 experimental conditions. All participants estimated
the height of an adult giraffe in feet. Participants in the anchor
condition first judged the weight of an adult wolf in lbs., then
indicated whether an adult giraffe weighs more or less than an adult
wolf, before judging the height of a giraffe.
All other aspects of the procedure were the same as in Experiment 1.
3.2 Results and Discussion
2 participants were excluded from the analysis because their estimates
of the giraffe’s height were more than 3 standard deviations above the
mean (120 and 300 feet — the ‘cut-off’ was 77 feet). An additional
participant was excluded for reporting the impossible result of a
giraffe’s height being zero. In the anchor condition, 160/164
participants answered the comparison question as predicted (giraffe
heavier than wolf), confirming that a wolf’s weight is a low anchor
for a giraffe’s weight.
Because responses were positively skewed, all responses were log
transformed for inferential analyses, although we report the
non-transformed descriptive statistics (all patterns of significance
were the same when non-transformed data were analysed). An anchoring
effect was observed in this experiment. Estimates of the giraffe’s
height were lower in the anchor condition (mean = 16.46; SE = 0.60)
than the control condition (mean = 19.84; SE = 0.82, t(320) = 3.89,
p < .001, d = 0.43). Thus, once the comparative question was
included, an anchoring effect was observed on estimates of a giraffe’s
height when the anchor concerned the semantically related property of
weight. Once again, a numerical priming explanation would predict the
opposite result, since the median estimate of the wolf’s weight was a
high absolute number (100 lbs — the mean was 115 lbs).
Experiment 3 sought to replicate this key result, but included
information stating that the anchor was randomly generated. Such
instructions are common in anchoring research and designed to
highlight the sub-optimality of the anchoring effect, as results
cannot be interpreted as participants perceiving the anchor as an
informative conversational ‘environmental suggestion’ (Epley &
Gilovich, 2010).
4 Experiment 3
4.1 Method
Participants
482 U.S. participants (153 female; 1 participant did not answer this
question) aged 18–70 (median = 26) were recruited via Amazon
Mechanical Turk.
Design, materials and procedure
Participants were randomly assigned to 1 of 3 experimental
conditions. All participants estimated the height of an adult giraffe
in feet. Participants in the anchor conditions were instructed to
start and then stop a ‘random number generator’ (four very fast
spinning wheels). In the low anchor condition, these reels stopped at
a number between 0101 and 0129 (the mean estimate of a wolf’s weight
in Experiment 2 was 113 lbs.). This value was lower than the 5th
percentile of giraffe weight estimates in the control condition of
Experiment 1 (300 lbs.). The 95th percentile of giraffe weight
estimates in the control condition of Experiment 1 was 3380 lbs. We
therefore chose a high anchor that was higher than this value and so,
in the high anchor condition, the reels displayed a number between
4001 and 4029. In both conditions, the absolute value of the number
would provide a high anchor for the height of a giraffe on a numeric
priming account. These participants were subsequently asked whether a
giraffe weighed more or less than this number of lbs., and
subsequently estimated the height of a giraffe in feet.
All other aspects of the procedure were the same as in Experiment 1.
4.2 Results and Discussion
9 participants were excluded from the analysis because their estimates
of the giraffe’s height were more than 3 standard deviations above the
mean (the cut-off was 40 feet). In the comparison questions, 133/146
reported that a giraffe’s weight is less than the high anchor, whilst
144/151 reported that a giraffe’s weight is more than the low anchor
(χ2(1) = 222.7, p < .001), confirming the status of the high and
low anchors.
Because responses were positively skewed, all responses were log
transformed for inferential analyses, although we report the
non-transformed descriptive statistics (unless otherwise noted,
patterns of significance were the same when non-transformed data were
analysed). A significant effect of anchor condition on participants’
estimates of giraffe height was observed (F(2, 470) = 3.50,
MSE = 0.021, p = .031, ηp2 = .015). Planned pairwise
comparisons demonstrated that estimates in the low anchor condition
(mean = 15.30; SE = 0.41) were lower than in the control condition
(mean = 17.05; SE = 0.47, t(325) = 2.48, p = .014, d =
0.28). Estimates in the high anchor condition (mean = 15.69; SE =
0.43) did not significantly differ from estimates in the control
condition (t(320) = 1.83, p = .067, d = −0.21). Unexpectedly,
estimates in the high anchor condition were (directionally) lower than
those in the control condition.4
Experiment 3 therefore replicated the cross-dimensional effect of a
low anchor observed in Experiment 2, in a setup in which the potential
influence of environmental suggestion was controlled. Despite the
significant result in the overall ANOVA, the support for cross-scale,
cross-dimensional anchoring in this experiment is tempered by the fact
that only the low-anchor and control conditions differed from one
another. The two anchor conditions did not differ from each other,
t(295) < 1. The (directional) contrast effect with the high anchor
was not predicted. The selective accessibility account has, however,
been advanced to predict contrast effects where extreme anchors are
used (see Strack & Mussweiler, 1997), so it is possible that the high
anchor we used was too extreme in this case. 9% of participants did
not, however, appear to view the high anchor as a high anchor (from
their responses to the comparative question), whilst only 5% failed
to view the low anchor as a low anchor on the same metric. If,
however, one considers the distance from the median value of a
giraffe’s weight in the control condition of Experiment 1 (800 lbs.),
the high anchor (approx. 4000) appears somewhat more extreme than the
low anchor (approx. 100). Whilst Experiment 3 provides some support
for cross-scale, cross-dimensional anchoring, the lack of predicted
effects between certain cells might provide fruitful investigation for
future research.
5 Experiment 4
As mentioned in the Introduction, the observation of cross-scale
anchoring suggests a greater applied importance of anchoring than
implied by scale distortion. Moreover, it is a consequential result
for policy makers seeking to minimise potential harmful effects of
anchors. There have been numerous demonstrations of potentially
consequential anchoring effects in applied situations. One potentially
costly example is in the context of credit card repayments. Both
British (Stewart, 2009) and American (Navarro-Martinez et al., 2011)
credit card holders reported they would repay less of their bill in a
condition where a minimum payment was provided than in one where the
minimum payment information was absent. In Stewart’s experiment, mean
repayments decreased from 40% to 23% of the overall balance when
minimum payment information was included.5 For a typical
consumer, with a bill of $4,000 and an annual percentage rate of
interest of 20%, such an effect corresponds to a two-fold increase in
interest payments from $49 to $109 (Stewart, 2009). The elimination
of such an effect would therefore convey considerable economic benefit
to consumers. Were cross-scale anchoring to never occur, the
beneficial effects of low anchors (ensuring that no debtors default on
a monthly payment) could be maintained, without the undesirable
anchoring effect, simply by providing the anchor on a different scale.
The results reported in Experiments 1–3 suggest that anchoring would
not be eliminated by providing the minimum payment in a different
scale (percentage of balance) to the payment requested
($). Experiment 4 provided a direct test of this, and consequently a
further test of cross-scale anchoring.
5.1 Method
Participants
After excluding 2 participants who did not report an age greater than
18 years, 604 (215 female) U.S. based Mechanical Turk workers aged
between 18 and 75 (median = 26) were retained for analysis. 332
reported having paid off a credit card bill ‘virtually every month’ in
the course of the past year, whilst 132 reported never having paid off
a credit card bill in the course of the past year. 136 participants
reported paying off a credit card bill between 1 and 10 times in the
past year (4 did not answer this question).
Design
Participants were presented with a mock credit card statement showing
a total balance of $1937.28 (as in Navarro-Martinez et al.,
2011). They were instructed to imagine that they had just received
this credit card statement, and were to think about the money they
currently had and the amount they could afford to pay before making a
decision as to how much of the credit card bill to repay.
Below the instructions, the credit card bill was presented
(Figure ??). The total amount due was always
shown. Participants were assigned to one of three experimental
conditions. In the ‘no minimum’ group, there was no mention of a
minimum payment. In the ‘minimum $’ group, the “minimum payment
amount” was $38.74 (2% of the balance). In the ‘minimum %’ group,
the “minimum payment percentage” was 2%. Participants reported the
amount they would repay in dollars. In all three conditions, if
participants entered an amount that was less than $38.74, they were
presented with an error warning stating “You must pay at least
$38.74”. Thus, the minimum payment required in all conditions was
the same, but this information was differentially available to
participants before they attempted to submit their response.

| Figure 3: A screenshot of the credit card bill and response question presented to participants in the ‘minimum payment percentage’ condition. |
Materials and procedure
The experiment was programmed in html and JavaScript and run via
Amazon Mechanical Turk. Having provided their responses to the
repayment question, on the next screen participants provided
demographic information pertaining to their age and gender as well as
asking them how many times in the past year they had paid a credit
card bill (Never; 1–3 times; 4–6 times; 7–10 times; Virtually every
month). Finally, to guard against computer ‘robots’ completing the
experiment, participants typed out a 4-digit number shown in a
photograph.6
5.2 Results and Discussion
6 participants were excluded whose repayments either contained
inappropriate characters, or were greater than the balance of
$1937.28. After these exclusions, 209 participants were in the ‘no
minimum’ condition, 193 in the ‘minimum $’ condition and 196 in the
‘minimum % condition.’ Table 1 shows the number of participants
repaying the full amount ($1937.28) in each condition. Although more
participants paid the full amount in the ‘No minimum’ condition, an
overall chi-squared contingency test was not significant
(χ2(2) = 3.39, p = .18).
| Table 1: Percentage of participants repaying the full debt on their
credit card statement in Experiment 1. |
| Condition | Percentage repaying the full amount |
| No minimum | 25% |
| Minimum $ | 18% |
| Minimum % | 19% |
Following Stewart (2009), when participants made partial repayments
(i.e., excluding full repayers), the amount of repayment made in each
condition yielded the same anchoring effect reported in Stewart (2009)
and Navarro-Martinez et al. (2011). Participants paid off more in the
‘No minimum’ condition (mean = 339.69; median = 200, Interquartile
range [IQR] = $400), than the ‘Minimum $’ condition (mean =
$220.62; median = $93.64, IQR = $156.25, Mann-Whitney
U = 8115.0, p < .001).7 Of more
interest, the anchoring effect was also observed in the ‘Minimum %’
condition (mean = $232.24; median = $150, IQR = $240,
U = 10360.5, p = .009). Finally, partial repayments in the ‘Minimum
%’ condition were significantly higher than those in the ‘Minimum $’
condition (U = 10022.0, p = .002). The pattern of results remains
the same if those participants who did not report paying off a credit
card bill in the last year are excluded.
Thus, although the cross-scale anchoring effect was smaller than the
same-scale anchoring effect, mean repayments of people not paying off
the full amount were still smaller in the ‘Minimum %’ condition than
in the condition without a minimum payment, demonstrating cross-scale
anchoring.
6 General Discussion
Across three experiments, we observed consistent evidence for semantic
cross-scale numerical anchoring. In a final experiment investigating
hypothetical credit card repayments, we demonstrated a cross-scale
anchoring effect of minimum payment information, further demonstrating
the applied importance of this result. Experiments 2 and 3 went
somewhat further than Experiments 1 and 4 in demonstrating
cross-scale, cross-dimensional anchoring.
We argued that there was no potential for scale distortion processes
to operate in Experiments 2 and 3, since there is no direct
translation of height (in feet) into weight (in lbs.). In response, a
proponent of scale distortion could argue that the correlated nature
of height and weight means that one can provide a reasonable estimate
of height once one has an estimate of weight – consequently, although
there is not a straightforward translation between feet and lbs., a
‘reasonable’ conversion could be made. A subsequent anchoring effect
could then be attributed to scale distortion.8 Whilst such an account is possible, and indeed could be
induced by the experimental pragmatics associated with the
experimenter asking participants to first consider the giraffe’s
weight, it seems unlikely to us. Moreover, the correlation between
height and weight is inherently a feature of the stimuli (animals),
not one inherent in the scale. The inferential steps involved in first
translating and then distorting the scale of the target judgment are
thus much more involved than a simple scale distortion account would
assume. We believe an account in terms of stimulus distortion is both
more parsimonious and more likely.
In addition to demonstrating the applied importance of cross-scale
anchoring, Experiment 4 demonstrated cross-scale anchoring in the
absence of a comparative question. We posit that, in contrast to the
majority of laboratory anchoring studies that highlight the randomness
of an anchor value (e.g., the present Experiment 3), in this
real-world situation, in which the minimum payment is clearly not
entirely irrelevant to the decision at hand, it is this relevance
which facilitates a cross-scale anchoring effect. Whether this is due
to an anchoring-and-adjustment process, an implicit comparison giving
rise to selective accessibility processes, or even a conversion of the
percentage into a dollar amount, which is then susceptible to scale
distortion processes, is a question for future research. The result,
however, is clear. Presenting the minimum payment on a different scale
does not eliminate the anchoring effect on payment amounts, although
it does attenuate it (and could consequently be of economic benefit to
consumers). That the cross-scale anchoring effect seems not always to
require a comparison question (see also Oppenheimer et al., 2008, who
observed ‘magnitude priming’ in the absence of a comparison question),
is perhaps beneficial in reconciling the current result with seemingly
contradictory findings reported in Mochon and Frederick (2013). Mochon
and Frederick reported evidence that a comparative question was
neither a necessary nor sufficient condition for anchoring effects to
occur. By contrast, an explicit numerical value on a consistent scale
was a necessary condition. Having observed cross-scale anchoring
without a comparison question in Experiment 4, the result we now turn
attention to concerns the necessity of a consistent scale.
In the critical conditions (for the present discussion) of Mochon and
Frederick’s (2013) Study 1, participants were asked whether a camera
costs more or less than either: $6, $900, ‘a pack of AA batteries’
or ‘a washing machine’, before estimating the price of a camera. Based
on the current results, one might predict that comparing a camera to a
pack of batteries would lead to lower estimates of the camera’s price
than comparing it to a washing machine. Mechanism ‘1’ in the
Introduction, for example, would predict that comparing a camera to a
pack of batteries would prime information consistent with a cheap
camera, which would then result in lower estimates of the camera’s
price. There was, however, no significant difference in estimates
between the ‘batteries’ (mean = $158) and ‘washing machine’ (mean =
$189) conditions. Where the anchor was an explicit value ($6
vs. $900), however, estimates of the camera’s price were higher
following the high anchor (mean = $376) than the low anchor (mean =
$164).
Estimates following the ‘$6’ anchor were no lower than those
following the ‘batteries’ anchor. The result that anchoring is
observed with explicit numerical anchors (on the same scale) and not
implied values (the LG washing machine and AA batteries had objective
retail prices of approximately $900 and $6) is driven by the
increased estimate following the explicit $900 anchor, which was not
observed for the washing machine.
Explanation ‘1’ in the Introduction is based on the selective
accessibility account of anchoring (e.g., Strack & Mussweiler,
1997). According to this account, when asked whether a camera costs
more or less than a washing machine, participants will seek for
evidence consistent with the hypothesis that these are the same
price. Note that this evidence could come from thinking about more
expensive cameras, but it could also come from thinking about cheaper
washing machines. If perceptions of washing machine prices are more
uncertain than perceptions of camera prices (and note that this seems
plausible, as larger prices are typically less discriminable than
smaller prices [e.g., Lambert, 1978]), the perception of the washing
machine is likely to be shifted more than the perception of the camera
– theories of information aggregation predict that when combining two
values (estimates for example), the resulting posterior judgment will
be closer to the value with the lower variance (read ‘uncertainty’;
for direct application of such theories to anchoring, see Turner &
Schley, 2016). Consequently, any anchoring effect on the price of the
camera will be attenuated. In the present experiments, such an effect
is less likely as participants are first asked to report the value for
the anchor, potentially ‘locking in’ a specific exemplar for future
comparisons, meaning that future comparisons are more likely to
influence perceptions of the target object than the ‘locked in’
anchor.
The above explanation is but one possibility and we should highlight
the speculative nature of it. Nonetheless, we suggest that an
investigation of the effect of the uncertainty of the anchor value on
cross-scale anchoring effects would be a worthwhile endeavour for
future research. Note that this question has not arisen previously in
anchoring research since anchors are typically precise numerical
values, with no associated uncertainty. By contrast, one’s perception
of the value of an LG washing machine is likely to be associated with
a degree of uncertainty. Thus, we propose (tentatively) that
uncertainty of the anchor value might be one boundary condition for
anchoring effects on a target judgment (a similar argument might be
relevant to Chapman & Johnson, 1994, Experiment 2).
Our attempts to explain the different results obtained in the current
experiments and in Mochon and Frederick (2013) seem, to us, to be in line
with Mochon and Frederick’s own theorising. Different anchoring
effects might exert differential influence across different situations
(or internal characteristics of the individual – Blankenship et al.,
2008; Wegener, Petty, Blankenship & Detweiler-Bedell,
2010). Identifying those different situations is an important goal of
future research, especially given a move towards more integrative
theories of anchoring (in addition to the citations immediately above,
see also, Chaxel, 2014; Simmons, LeBoeuf & Nelson, 2010). The
potential explanations proferred here are not exhaustive, and
arbitrating between competing accounts in behavioral experiments is
clearly a far from straightforward challenge for future research. The
current research does demonstrate, however, that such future research
and theorising must entertain the reality of cross-scale numerical
anchoring effects transcending mere numeric priming effects.
References
Blankenship, K. L., Wegener, D. T., Petty, R. E., Detweiler-Bedell, B., & Macy, C. L. (2008). Elaboration and consequences of anchored estimates: An attitudinal perspective on numerical anchoring. Journal of Experimental Social Psychology, 44, 1465–1476.
Chapman, G. B., & Johnson, E. J. (1994). The limits of anchoring. Journal of Behavioral Decision Making, 7, 223–242.
Chapman, G. B., & Johnson, E. J. (1999). Anchoring, activation, and the construction of values. Organizational Behavior and Human Decision Processes, 79, 115–153.
Chaxel, A.-S. (2014). The impact of procedural priming of selective accessibility on self-generated and experimenter-provided anchors. Journal of Experimental Social Psychology, 50, 45–51.
Critcher, C. R., & Gilovich, T. (2008). Incidental environmental anchors. Journal of Behavioral Decision Making, 21, 241–251.
Englich, B. (2006). Blind or biased? Justitia’s susceptibility to anchoring effects in the courtroom based on given numerical representation. Law & Policy, 28, 497–514.
Epley, N., & Gilovich, T. (2010). Anchoring unbound. Journal of Consumer Psychology, 20, 20–24.
Frederick, S. W., & Mochon, D. (2012). A scale distortion theory of anchoring. Journal of Experimental Psychology: General, 141, 124–133.
Galinsky, A. D., & Mussweiler, T. (2001). First offers as anchors: The role of perspective-taking and negotiator focus. Journal of Personality and Social Psychology, 81, 657–669.
Harvey, N. (2011). Anchoring and adjustment: A Bayesian heuristic? In W. Brun, G. Keren, G. Kirkeboen, & H. Montgomery (Eds.), Perspectives on Thinking, Judging, and Decision Making (pp. 98–108). Oslo: Universitetsforlaget.
Lambert, Z. V. (1978). Differential thresholds in consumer perception of retail prices. The Journal of Psychology, 100, 139–150.
Matthews, W. J. (2011). What might judgment and decision making research be like if
we took a Bayesian approach to hypothesis testing? Judgment and Decision Making, 6,
843–856.
Mochon, D., & Frederick, S. (2013). Anchoring in sequential judgments. Organizational Behavior and Human Decision Processes, 122, 69–79.
Mussweiler, T., & Strack, F. (1999). Hypothesis-consistent testing and semantic priming in the anchoring paradigm: A selective accessibility model. Journal of Experimental Social Psychology, 35, 136–164.
Mussweiler, T., & Strack, F. (2000a). Numeric judgments under uncertainty: The role of knowledge in anchoring. Journal of Experimental Social Psychology, 36, 495–518.
Mussweiler, T., & Strack, F. (2000b). The use of category and exemplar knowledge in the solution of anchoring tasks. Journal of Personality and Social Psychology, 78, 1038–1052.
Mussweiler, T., & Strack, F. (2001). The semantics of anchoring. Organizational Behavior and Human Decision Processes, 86, 234–255.
Navarro-Martinez, D., Salisbury, L. C., Lemon, K. N., Stewart, N., Matthews, W. J., & Harris, A. J. L. (2011). Minimum required payment and supplemental information disclosure effects on consumer debt repayment decisions. Journal of Marketing Research, 48, S60–S77.
Northcraft, G. B., & Neale, M. A. (1987). Experts, amateurs, and real estate: An anchoring-and-adjustment perspective on property pricing decisions. Organizational Behavior and Human Decision Processes, 39, 84–97.
Oppenheimer, D. LeBoeuf, R., & Brewer, N. (2008). Anchors aweigh: A demonstration of cross-modality anchoring and magnitude priming. Cognition, 106, 13–26.
Schaerer, M., Swaab, R., & Galinsky, A. D. (2015). Anchors weigh more than power: Why absolute powerlessness liberates negotiators to achieve better outcomes. Psychological Science, 26, 170–181.
Simmons, J., LeBoeuf, R., & Nelson, L. (2010). The effect of accuracy motivation on anchoring and adjustment: Do people adjust from provided anchors? Journal of Personality and Social Psychology, 99, 917–932.
Sleeth-Keppler, D. (2013). Taking the high (or low) road: A quantifier priming perspective on basic anchoring effects. The Journal of Social Psychology, 153, 424–447.
Stewart, N. (2009). The cost of anchoring on credit-card minimum repayments. Psychological Science, 20, 39–41.
Strack, F., & Mussweiler, T. (1997). Explaining the enigmatic anchoring effect: Mechanisms of selective accessibility. Journal of Personality and Social Psychology, 73, 437–446.
Thorsteinson, T., Breier, J., Atwell, A., Hamilton, C., & Privette, M. (2008). Anchoring effects on performance judgments. Organizational Behavior and Human Decision Processes, 107, 29–40.
Turner, B. M., & Schley, D. R. (2016). The anchor integration model: A descriptive model of anchoring effects. Cognitive Psychology, 90, 1–47.
Tversky, A., & Kahneman, D. (1974). Judgment under uncertainty: Heuristics and biases. Science, 185, 1124–1131.
Wansink, B., Kent, R. J., & Hoch, S. J. (1998). An anchoring and adjustment model of purchase quantity decisions. Journal of Marketing Research, 35, 71–81.
Wegener, D. T., Petty, R. E., Blankenship, K. L., & Detweiler-Bedell, B. (2010). Elaboration and numerical anchoring: Implications of attitude theories for consumer judgment and decision making. Journal of Consumer Psychology, 20, 5–16.
Wilson, T. D., Houston, C., Etling, K. M., & Brekke, N. (1996). A new look at anchoring effects: Basic anchoring and its antecedents. Journal of Experimental Psychology: General, 4, 387–402.
Wong, K. F. E., & Kwong, J. Y. Y. (2000). Is 7300m equal to 7.3 km? Same semantics but different anchoring effects. Organizational Behavior and Human Decision Processes, 82, 314-333.
Appendix
| Table A1: Summary of the anchoring effects observed across all experiments. |
| | Was an anchoring effect observed relative to the control condition? | Additional notes |
EXPERIMENT 1 | | |
Consistent scale, no comparison | ✓ | |
Consistent scale, comparison | ✓ | |
Cross-scale, no comparison | × | |
Cross-scale, comparison | ✓ | |
EXPERIMENT 2 | | |
Cross-scale, cross domain, comparison, high anchor | ✓ | |
EXPERIMENT 3 | | |
Cross-scale, cross domain, comparison, high anchor | × | 21inEstimates did not differ between these conditions |
Cross-scale, cross domain, comparison, low anchor | ✓ |
EXPERIMENT 4 | | |
Consistent scale | ✓ | There was a larger anchoring effect with the consistent scale |
This document was translated from LATEX by
HEVEA.