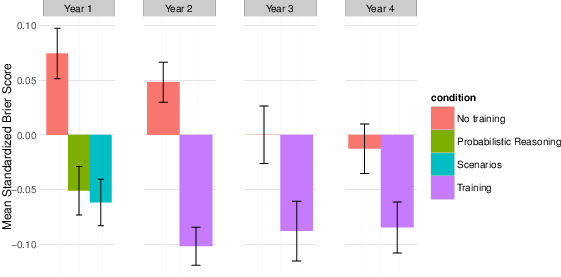
| Figure 1: Years 1–4 training results. |
Judgment and Decision Making, Vol. 11, No. 5, September 2016, pp. 509-526
Developing expert political judgment: The impact of training and practice on judgmental accuracy in geopolitical forecasting tournamentsWelton Chang* Eva Chen# Barbara Mellers# Philip Tetlock# |
The heuristics-and-biases research program highlights reasons for expecting people to be poor intuitive forecasters. This article tests the power of a cognitive-debiasing training module (“CHAMPS KNOW”) to improve probability judgments in a four-year series of geopolitical forecasting tournaments sponsored by the U.S. intelligence community. Although the training lasted less than one hour, it consistently improved accuracy (Brier scores) by 6 to 11% over the control condition. Cognitive ability and practice also made largely independent contributions to predictive accuracy. Given the brevity of the training tutorials and the heterogeneity of the problems posed, the observed effects are likely to be lower-bound estimates of what could be achieved by more intensive interventions. Future work should isolate which prongs of the multipronged CHAMPS KNOW training were most effective in improving judgment on which categories of problems.
Keywords: forecasting, probability judgment, training, practice,
cognitive debiasing
Research in judgment and choice has found numerous flaws in people’s intuitive understanding of probability (Bar-Hillel, 1980; Kahneman & Tversky, 1973, 1984; Lichtenstein, Slovic, Fischhoff, Layman & Combs, 1978; Slovic & Fischhoff, 1977; Tversky & Kahneman, 1974). We often make errors in prediction tasks by using effort-saving heuristics that are either insensitive to factors that normative theories say we should take into account or sensitive to factors that we should ignore (Kahneman & Tversky, 1977, 1982; Morewedge & Kahneman, 2010; Tversky & Kahneman, 1974). These results have sparked interest in interventions that can improve judgments (Arkes, 1991; Croskerry, Singhal & Mamede, 2013a, 2013b; Fischhoff, 1982; Lilienfeld, Ammirati & Landfield, 2009; Miller, 1969), but it remains true that significantly less attention has been paid to “debiasing” than to biases (Arkes, 1991; Graber et al., 2012; Lilienfeld et al., 2009). Moreover, few organizations have embraced the debiasing methods that have been developed (Croskerry, 2003; Graber et al., 2012; Lilienfeld et al., 2009).
Accurate probability judgments are important in domains such as law, finance, medicine and politics (Croskerry et al., 2013b; Jolls & Sunstein, 2005). For example, the U.S. justification for invading Iraq in 2003 hinged on intelligence estimates that stated with high confidence that Iraq possessed Weapons of Mass Destruction (WMD) (Director of Central Intelligence, 2002). Two years later, a bipartisan commission determined that there were no WMD in Iraq. The pre-war intelligence was “dead wrong,” putting the blame on the intelligence community and politicization of the available information by a subset of policymakers (Commission on the Intelligence Capabilities of the United States Regarding Weapons of Mass Destruction, 2005). The United States would continue its involvement in the country for over a decade at an estimated cost between $4 and $6 trillion and thousands of casualties, numbers which underscore the dangers of over-confident “slam-dunk” assessments of ambiguous evidence (Bilmes, 2014).
The intelligence community responded, in part, by creating a research division devoted to exploring methods of improving intelligence analysis, IARPA. The research reported here was part of four years of forecasting tournaments in which our team, the Good Judgment Project, was a competitor. Five university-based teams competed to submit the most accurate daily probability forecasts possible on a range of political and economic questions, which included improving human judgments with algorithms. Additional details on the forecasting tournament, competitors and Good Judgment Project’s winning methods, was previously reported in Mellers et al. (2014); Tetlock, Mellers, Rohrbaugh and Chen (2014). We experimentally tested the efficacy of a variety of tools for improving judgment, including a cognitive-debiasing and political knowledge training regimen called “CHAMPS KNOW”.
A number of studies have shed light on how probability estimates and judgments can be improved (Fischbein & Gazit, 1984; Fischhoff & Bar-Hillel, 1984; Stewart, 2001; Tetlock, 2005; Whitecotton, Sanders & Norris, 1998). However, past work suffers from at least six sets of limitations: 1) over-reliance on student subjects who are often neither intrinsically nor extrinsically motivated to master the task (Anderson, 1982; Petty & Cacioppo, 1984; Sears, 1986); 2) one-shot experimental tasks that limit both subjects’ opportunities to learn and researchers’ opportunities to assess whether experimentally induced gains were sustainable over time or whether they just briefly cued better thinking (Büyükkurt & Büyükkurt, 1991; Koriat, Lichtenstein & Fischhoff, 1980); 3) brief training modules, often as short as 10–15 minutes, that afforded few opportunities for retesting (Benson & Önkal, 1992; Stone & Opel, 2000) and exploring the potential interactive effects of training and deliberate practice (Ericsson, Krampe & Tesch-Römer, 1993); 4) debiasing interventions that are narrowly tailored to a single bias (e.g., over-confidence, hindsight) and not designed to help with problems that activate multiple biases (Arkes, Faust, Guilmette & Hart, 1988; Hafenbrack, Kinias & Barsade, 2014; Kardes et al., 2006); 5) multifaceted and lengthy educational interventions, such as statistics courses, that are high in ecological validity but lose the internal validity advantages that accrue from random assignment (Fong, Krantz & Nisbett, 1986; Lehman, Lempert & Nisbett, 1988; Lehman & Nisbett, 1990); and 6) limited study of the moderating effects of individual differences beyond cognitive ability (Salas & Cannon-Bowers, 2001). Research on individual differences and job performance suggests, for instance, a potential interaction effect between cognitive ability and practice (i.e., repeated execution of the thinking principles relayed didactically via training) (Deary, 2000; Ericsson & Lehmann, 1996; Schmidt & Hunter, 2000). Thus, debiasing is unlikely to have uniform effects on subjects.
We set out to overcome many of these problems. Our study uses a highly diverse cross-section of the population that, based on the effort expended for compensation provided, is almost certainly more intrinsically motivated than the standard undergraduate sample. The research went on for four years, tested lengthier debiasing methods, and investigated individual-difference moderators. Our study also represents one of the most rigorous tests of debiasing methods to date. The open-ended experimental task, forecasting a wide range of political and economic outcomes, is widely recognized as difficult (Jervis, 2010; Tetlock, 2005). Some political experts and commentators have portrayed it as impossible (Atkins, 2015; Taleb & Blyth, 2011). Our work does not correct all of the aforementioned conceptual and methodological problems, but we can address a significant fraction of them.
The analysis reported here builds on Mellers et al. (2014). The previous article examined the first two years of the forecasting tournament and discusses several drivers of performance. Here, we focus on the effects of training and include a more in-depth analysis of all four years of the experiment. We also examine mediational mechanisms and moderator variables to understand individual differences.
Past research on debiasing can be organized into four categories: 1) information-based (i.e., didactic) techniques in which trainees learn about errors in judgment such as over-confidence; 2) process-based techniques that teach subjects how to check for biases, such as the “consider-the-opposite” strategy; 3) feedback-based techniques that give subjects trial-by-trial information on their judgment strategies (i.e., here’s how you did and here are some strategies you use to get better, now try again); and 4) format-based techniques designed to boost judgmental coherence and accuracy by structuring problems in ways that are more easily understood and processed.
The purely didactic approach is the least costly method, but the experimental evidence suggests that it is also the least effective (Arkes, 1991; Graber, 2003). A review of debiasing methods for confirmation bias has found mixed effects at best (Lilienfeld et al., 2009; Weinstein & Klein, 1995). The shortcomings of instruction-only debiasing strategies are probably attributable to the tenacity of intuitive biases. Informing people of biases is simply not enough (Neilens, Handley & Newstead, 2009; Wegener & Petty, 1997). Recognition is only the first step and activating deliberate overrides requires self-awareness of error potential, a meta-cognitive skill (Croskerry, 2003; Flavell, 1979; Graber, 2003; Nelson & Narens, 1994).
Process-based techniques are designed to override the erroneous tendencies of some simple heuristics (Keren, 1990). For example, describing common reasoning patterns that lead to biased judgments and explaining how to avoid them is more effective than just informing people about biases (Cheng & Wu, 2010; Ross, Lepper & Hubbard, 1975). Larrick and colleagues showed that training both the educated and uneducated in economic principles of cost-benefit analysis led to better judgments (Larrick, Morgan & Nisbett, 1990). Another override strategy is to ask people the same question twice, which pushes them to evaluate the accuracy of their first-order judgments (Herzog & Hertwig, 2009; Van Der Henst, 2009; Vul & Pashler, 2008). Considering base rates can also improve judgmental accuracy (Kahneman & Tversky, 1973; Tversky & Kahneman, 1981). Finally, teaching people reference-class forecasting reduces base-rate neglect more than calling attention to the bias itself (Case, Fantino & Goodie, 1999; Fischhoff & Bar-Hillel, 1984; Flyvbjerg, 2008; Kahneman & Tversky, 1977; Lovallo, Clarke & Camerer, 2012).1
Other researchers have found that the format used to present a problem can have a large effect on understanding. Some have shown that frequency presentation formats boost accuracy and coherence (Gigerenzer, 1991; Gigerenzer & Hoffrage, 1995; Gigerenzer & Todd, 1999). Mandel and Navarrete (2015) underscore this point in their recent review. Researchers have also shown that displaying probabilities as “nested sets” or visualizing data distributions can improve probability judgments (Mellers & McGraw, 1999; Yamagishi, 2003). Problem format also impacts the extent to which subjects consider the prior probabilities of events (i.e., base-rate neglect) (Barbey & Sloman, 2007; Macchi, 2000) and the degree to which they correctly process information (Radecki & Medow, 2007; Roy & Lerch, 1996).
Beyond these short-term interventions, longer-lasting improvements in probabilistic reasoning skills may require combinations of process-based techniques and repeated feedback. Several studies have found that providing feedback in probabilistic reasoning tasks improves resolution and calibration (Benson & Önkal, 1992; Lichtenstein & Fischhoff, 1980; Stone & Opel, 2000). Even after brief amounts of feedback, subjects may demonstrate improved Bayesian reasoning (Lichtenstein & Fischhoff, 1980; Sedlmeier & Gigerenzer, 2001). Longer-term educational programs, such as undergraduate-level statistical training have also improved probabilistic reasoning (Fong et al., 1986; Lehman et al., 1988; Lehman & Nisbett, 1990; Nisbett, Krantz, Jepson & Kunda, 1983).
Although feedback is necessary for improvement, it is unlikely to be sufficient. Sustained improvement likely requires practice that reinforces learning and facilitates deeper thought (Ericsson, 2006, 2008; Ericsson et al., 1993). One aspect of our study explores the effect of practice and concentrated effort on performance. Ericsson (2006) stresses the power of deliberate practice: concentrated, effortful and gradual improvement on sequential tasks that feed into overall skill. Although the task and experimental structure of the tournament did not allow us to directly test Ericsson’s concept of deliberate practice (we could not directly measure cognitive exertion), we could draw some inferences about the effects of targeted practice (focused effort) on forecasting accuracy.
Our probabilistic-reasoning training was designed to teach subjects to use principles such as grounding forecasts in plausible reference classes. We could test two hypotheses:
Subjects trained to apply probabilistic reasoning principles will be more accurate than controls.
The more opportunities subjects have to make judgments, the more accurate they will become (across both untrained and trained conditions).
Although training and practice can enhance accuracy, the evidence for interactions is mixed. Schmidt and Hunter (2000) found that those with higher cognitive ability were quicker to master virtually all forms of job knowledge. Others have focused on cognitive motivation (Cacioppo, Petty, Feinstein & Jarvis, 1996). Duckworth and colleagues found grit to be predictive of success in completing military training and academic performance. Moreover, intelligence and grit were roughly orthogonal (Duckworth, Peterson, Matthews & Kelly, 2007; Duckworth & Quinn, 2009). Studies of individual difference variables that correlate with probabilistic reasoning have found that higher cognitive ability influences accuracy and correlates with better performance on logic and probabilistic reasoning tasks, but is not sufficient for overcoming hindsight bias and overconfidence (Stanovich & West, 1998b). Higher ability has also been found to correlate with less sensitivity to framing and conjunction effects (Stanovich & West, 1998a). Lehman and Nisbett’s (1990) study of undergraduates undergoing statistical training found a weak but positive correlation (r=0.16, p < .06) between intelligence (as measured by quantitative and verbal SAT scores) and improvement in reasoning performance. We expected that:
Forecasters with higher cognitive abilities will make more accurate predictions.
More cognitively motivated forecasters will make more accurate predictions.
Training may disproportionately benefit those who practice more or have higher abilities. And those with higher cognitive abilities may discover more useful ways to apply insights from training. Although Ericsson’s findings show that those with natural aptitude for a skill also need to engage in deliberate practice, he does not deny that those with natural talent can derive greater benefits from a virtuous cycle of motivation-related gains in which initial cognitive advantages are reinforced by lower barriers to deliberate practice (Ericsson, 2002, 2007). In this view, higher cognitive ability makes deliberate practice easier and those subjects may benefit more quickly from practice than others. We thus pose the following interaction hypotheses:
Forecasters who engage in more practice will benefit more from training.
Forecasters with greater cognitive abilities will benefit more from training.
Forecasters who engage in more practice and have higher cognitive abilities will benefit more from training (e.g., exhibit higher levels of accuracy).
In summary, we hypothesize that subjects who receive training will be more accurate than control subjects; practice will benefit forecasters, regardless of training; and those who start with higher cognitive ability and motivation will perform better. Among subjects who receive training, those who practice more or have higher abilities will benefit more from training. And subjects who both practice more and have higher abilities will be even better forecasters.
Four geopolitical forecasting tournaments were conducted between September 2011–April 2012, June 2012–April 2013, August 2013–May 2014, and August 2014–May 2015. Subjects submitted probability estimates via a custom-designed Internet platform on a variety of geopolitical and economic events.
Subjects were recruited initially from professional societies, research centers, alumni associations, blogs, and word of mouth. At the start of Year 3, subjects from other forecasting teams that were a part of the wider government research program, the Aggregative Contingent Estimate (ACE) program, were added to the subject pool. Additional recruits came from publicity generated by media coverage. Subject demographics for Years 1 and 2 were previously reported in Mellers et al. (2014). In Years 3 and 4, the subject pool was approximately 83% male, averaged 41 years of age, and 67% self-reported completion of some form of graduate education, similar to the Years 1 and 2 subject pools.
Subjects joined the tournament via a customized online platform and officially entered the tournament after completing a survey that included individual differences measures such as Raven’s Progressive Matrices, the Cognitive Reflection Test (both original and extended), the Berlin Numeracy Test (comprising cognitive ability-related factors), grit (abbreviated scale in years 1-2, full grit-s scale in year 3) and actively open-minded thinking (comprising motivation-related factors) (Cokely, Galesic, Schulz, Ghazal & Garcia-Retamero, 2012; Duckworth & Quinn, 2009; Frederick, 2005; Haran, Ritov & Mellers, 2013; Raven, 2003).
After completing the survey, subjects were randomly assigned to either training or control conditions. Following each nine-month tournament, forecasters who met participation thresholds and opted to continue were placed in the same condition for the next forecasting year.2
Each year, subjects were given between 100 and 150 questions that U.S. intelligence agencies deemed to be of national security relevance, such as “Will a Syrian no-fly zone be enacted before X date?” and “Will Russia test an ICBM by X date?” (see the Supplement for a full list of questions). Subjects were free to choose which questions to answer.
The traditional Brier scoring rule was used to measure accuracy (Brier, 1950). A Brier score is the sum of the squared differences between event occurrence (e.g. events that occurred = 1, events that did not occur = 0) and the forecasters’ assigned probability, averaged over all forecasted days for each question (e.g., if a subject submits a 0.25 probability on day 1, that forecast is carried over for each day until the subject entered a different estimate or the question resolved). Brier scores, based on their original formulation, can thus range from 0 to 2. (The original Brier score was retained, as the more recent version of the Brier score is proper only for binary outcomes.) Lower Brier scores represent higher levels of accuracy. The analysis that follows uses mean standardized Brier scores, with standardization occurring within a question. Mean Brier scores were calculated for each question and then the standardized scores were generated as a function of deviation from the mean score for that question. This method takes into account varying levels of difficulty on questions and thus allows for comparisons between individuals since forecasters were free to choose questions. For this paper, only forecasters who attempted more than 30 questions (the minimum participation threshold) during the year were included in the sample.3
Forecasters were paid with electronic gift certificates for meeting participation goals (up to $250). To qualify for the gift certificates, forecasters had to make a forecast on a minimum number of questions during the year. Forecasters were able to view their score and rank relative to the other forecasters in their condition.
Table 1: QUEST definition.
Letter Reasoning principle Q Question views U Use plausible scenarios E Explore assumptions S Several assumptions should be considered T Take heed of biases
Training evolved from year 1 to 4, but was never designed to take more than an hour. Common probabilistic reasoning principles included the understanding and use of event base-rates, basic principles of belief updating in a way that reflected the probative value of new evidence, the value of averaging independent evidence, the difference between calibration and resolution in Brier scoring, the pros and cons of using statistical-mathematical models to inform forecasts, and a discussion of common biases in probability judgment.
Training in year 1 consisted of two different modules: probabilistic reasoning training and scenario training. Scenario-training was a four-step process: 1) developing coherent and logical probabilities under the probability sum rule; 2) exploring and challenging assumptions; 3) identifying the key causal drivers; 4) considering the best and worst case scenarios and developing a sensible 95% confidence interval of possible outcomes; and 5) avoid over-correction biases. The principles were distilled into an acronym QUEST: Question views, Use plausible worst-case and best-case scenarios, Explore assumptions, Several assumptions should be considered, Take heed of biases (Table 1). Scenario training was designed in a way very similar to analytic training already used by the intelligence community, encouraging trainees to think critically about assumptions, potential futures, and causal mechanisms that could be at play on a given forecasting question.
Table 2: CHAMP definition.
Letter Probabilistic reasoning principle C Comparison classes H Historical trends A Averaging M Mathematical models P Predictable biases
Probabilistic reasoning training consisted of lessons that detailed the difference between calibration and resolution, using comparison classes and base rates (Kahneman & Tversky, 1973; Tversky & Kahneman, 1981), averaging and using crowd wisdom principles (Surowiecki, 2005), finding and utilizing predictive mathematical and statistical models (Arkes, 1981; Kahneman & Tversky, 1982), cautiously using time-series and historical data, and being self-aware of the typical cognitive biases common throughout the population. The training encouraged forecasters to remember the principles by the acronym CHAMP (Table 2):
In year 2, probabilistic reasoning and scenario training were combined into a single module. Graphics and more checks on learning were added.
Table 3: CHAMPS KNOW decomposition.
Letter Probabilistic reasoning principle C Comparison classes H Hunt for the right information A Adjust and update forecasts when appropriate M Mathematical and statistical models P Post-mortem analysis S Select the right questions to answer Political Reasoning Principle K Know the power players and their preferences N Norms and protocols of institutions O Other perspectives should inform forecasts W Wildcards, accidents, and black swans
Year 3 expanded on year 1 and year 2 training by delivering the content in a graphical format (online via commercial software) and adding a letter S to CHAMP, as well as a new political science content module described by the acronym KNOW. The additional S encouraged forecasters to select the right questions to answer and seek out subjects where they have a comparative advantage. The additional KNOW module encouraged forecasters to understand the dynamics involving key political players (Bueno De Mesquita & Smith, 2005; Waltz, 2001), determine the influence of norms and international institutions (Finnemore & Sikkink, 1998; Keohane, 2005), seek out other political perspectives and be aware of potential wildcard scenarios (Taleb, 2010). The original CHAMP guidelines were also slightly modified based on lessons learned and observation of the best forecasters, together forming the revised guidelines under the acronym CHAMPS KNOW (Table 3). Additional checks on learning (i.e., short quizzes) were integrated into this version of the training as well.
Figure 1: Years 1–4 training results.
Year 4 training was very similar to year 3 training. The probabilistic reasoning training was delivered via a customized web platform. Almost all information conveyed was illustrated with graphical examples or pictures. The main CHAMPS KNOW framework remained intact—save for the revision of the S guideline from “Select the right questions to answer” to “Select the right level of effort to devote to each question,” which provided a sharper and clearer description of performing cognitive triage on the forecasting question pool.
Table 4: Summary statistics of training experiment years 1–4. Std means standardized.
Condition N Mean Brier Score SD SE Mean Brier Score (std) M SD (std) SE (std) % Improvement Year 1 No training 152 0.42 0.09 0.01 0.07 0.28 0.02 Prob training 119 0.38 0.08 0.01 –0.05 0.24 0.02 10% Scen training 113 0.38 0.08 0.01 –0.06 0.23 0.02 11% Year 2 No training 194 0.39 0.08 0.01 0.05 0.25 0.02 Training 205 0.34 0.09 0.01 –0.10 0.25 0.02 12% Year 3 No training 116 0.34 0.01 0.09 0.00 0.28 0.03 Training 97 0.32 0.01 0.09 –0.09 0.27 0.03 6% Year 4 No training 131 0.38 0.01 0.10 –0.01 0.26 0.02 Training 102 0.35 0.01 0.10 –0.08 0.24 0.02 7%
Table 5: Summary statistics (standardized) of reasoning principles in forecast explanations.
n SD Probabilistic reasoning principle Comparison classes 580 0.17 0.003 Hunt for the right information 2,992 0.38 0.000 Adjust and update forecasts when appropriate 1,239 0.44 0.001 Mathematical and statistical models 453 0.26 0.004 Post-mortem analysis 88 1.04 0.020 Select the right questions to answer 330 0.26 0.006 Political Reasoning Principle Know the power players and their preferences 1,506 0.36 0.001 Norms and protocols of institutions 847 0.44 0.002 Other perspectives should inform forecasts 531 0.63 0.003 Wildcards, accidents, and black swans 400 0.40 0.004 Categorized* 4,627 0.42 0.000 No Category Self-Reported 2,087 0.37 0.001 Control condition 6,622 0.49 0.000 * This row describes all forecast explanations. It is not the sum of the n of the ten principles because explanations can contain reasoning based on more than one CHAMPS KNOW principle.
Training yielded significant improvements in Brier score across all four tournament years (Figure 1). In year 1, both probability-trained forecasters (n = 119, MStd Brier Score = -0.05, SD = 0.24) and scenario-trained forecasters (n = 113, MStd Brier Score = -0.06, SD = 0.23) outperformed control forecasters (n = 152, M Std Brier Score = +0.07, SD = 0.28), F(2, 381) = 12.1, p < .001. Accuracy did not differ between probability-trained and scenario-trained forecasters. The improvement in mean Brier scores from probability-training and scenario-training was 10% and 11%, respectively, relative to control forecasters.
In year 2, training increased accuracy, with probability-trained individuals (n = 205, MStd Brier Score = –0.10, SD Std = 0.25) outperforming control individuals (n = 194, M Std Brier Score = +0.05, SD Std = 0.25), t(395) = 5.95, p < .001, a 12% score improvement. In year 3, training was associated with better performance (trained n = 97, MStd Brier Score = –0.08, SD Std = 0.27, control n = 116, MStd Brier Score = 0.00, SD Std = 0.28), t(207) = 2.32, p = .021, with trained individuals again achieving greater accuracy than controls, a 6% score improvement. Finally, in year 4, training was also significant, (trained n = 131, M Std Brier Score = –0.01, SD Std = 0.26, control n = 102, MStdBrierScore = –0.08, SD Std = 0.24), t(225) = 2.20, p = .028, a 7% score improvement. Additionally, as reported elsewhere, training improved the calibration and resolution of forecasters by reducing overconfidence (Mellers et al., 2014; Moore et al., 2016). Overall, the individual forecasters with probability-training consistently outperformed controls across all four years (Table 4).
Analysis of which reasoning principles were associated with greater accuracy revealed that self-reported use of comparison classes was correlated with lower Brier scores. In year 4, trained forecasters were asked to state which of the CHAMPS KNOW principles they used to explain their forecasts to others. A new check-box elicitation feature was introduced for all trained forecasters (see the Supplement for a screenshot. These check boxes augmented the text-box forecast-explanation elicitation system that had been in place since the beginning of the tournament.4 In the trained condition, we asked subjects to categorize the reasoning behind their forecasts by selecting one or more of the ten reasoning principles (signified by letters). Subjects in the control condition were also encouraged to explain their forecasts, but were given no check boxes with reference to the principles.
We elicited 6,622 explanations in the control condition (submitted by 75% of forecasters) and 6,714 explanations from trained forecasters (submitted by 76% of forecasters). On average, the two conditions reported no significant difference in total time spent on forecasting and writing arguments (4.1 and 3.7 hours/week for control and trained, respectively).
Table 6: ANOVA of reasoning principles.
MS F (1 df) P value Probabilistic reasoning principle 39.34 12.28 <0.001 9.08 2.83 0.092 0.01 0.00 0.948 7.53 2.35 0.125 30.05 9.38 0.002 3.53 1.10 0.294 Political reasoning principle 0.54 0.17 0.682 9.02 2.82 0.093 34.97 10.92 <0.001 0.89 0.28 0.598
In the trained condition, 69% of forecast explanations were self-classified as one of the ten principles of CHAMPS KNOW, yielding forecast explanations associated with CHAMPS KNOW principles alongside probability estimates. With this information, we could score each explanation and correlate CHAMPS KNOW principles with Brier scores.5 Table 5 shows the number of forecast explanations and the mean standardized Brier scores of categorized (e.g., any explanation of a forecast that had a CHAMPS KNOW box checked) and non-categorized explanations of forecasts. Trained forecasters whose explanations invoked principles C, M and S were more accurate than those whose explanations invoked no self-reported CHAMPS KNOW principles. Explanations invoking C, M, and S principles were also linked to more accurate forecasts than were explanations invoking any of the other CHAMPS KNOW principles and more accurate than explanations of forecasts offered by control forecasters.
Table 6 shows an analysis of variance (ANOVA) of CHAMPS KNOW principles (based on associated scored forecasts) that reveals only three principles were significantly associated with mean standardized Brier scores: C was associated with better performance, whereas P and O were associated with worse performance.6 The P principle likely increased Brier scores because post-mortems are normally conducted after inaccurate forecasts. Removing the cases associated with principles P and O before conducting a second ANOVA allowed us to directly compare the effects of the remaining probabilistic reasoning principles (CHAMS) to the remaining political reasoning principles (KNW). Results showed that probabilistic reasoning principles were associated with improvement but political reasoning training was not (Table 7). Although the use of the C principle was associated with increased accuracy, CHAMPS KNOW was designed holistically. In effect, the debiasing effect of the principles build on each other and relational impact among principles is not measured (and likely not measurable within the current research design). So, although the C principle was the most significant contributor to accuracy, it would be going too far to say that the other principles played no role.
Table 7: ANOVA comparing probabilistic reasoning with political reasoning training.
MS F (1 df) P value 38.51 11.96 <0.001 0.24 0.08 0.783
Table 8: Forecasts per subject, years 1–4.
Condition Average forecasts/subject Year 1 No training 86.76 Prob training 84.29 Scen training 73.15 Year 2 No training 139.03 Training 127.81 Year 3 No training 118.21 Training 113.09 Year 4 No training 149.02 Training 141.84
Was training associated with greater practice, as measured by the number of forecasts per user within conditions? There was virtually no difference between the total number of forecasts made by trained and control subjects in years 1, 2, 3, or 4 (Table 8).
Table 9: Comparison of performance between new forecasters and veteran forecasters. BScore is mean Brier score; Imp1 is % improvement comparing without training conditions; Imp2 is % improvement comparing no training to training; SD is standard deviaion; SE is standard error
Standardized Condition N Year 2 New No training 46 Training 52 Veterans No training 148 Training 153 Year 3 New No training 60 Training 44 Veterans No training 56 Training 53 Year 4 New No training 119 Training 88
From year 2 onwards, subjects who previously participated were encouraged to return and forecast during additional years of the tournament. These veteran forecasters would, like new subjects, encounter a different set of questions but the same experimental condition. Forecasters who were previously assigned to the control condition were reassigned to that condition and likewise for those previously assigned to the trained condition. We used a two-factor fixed-effects analysis of variance (ANOVA) each year to look for a main effect of experience and an interaction between experience and training. The effects of training were consistently significant, but a subject merely having prior experience in a year of the tournament did not yield significant improvements in Brier score (results from year 4 shown in Table 9).
Table 10: Forecasts per question per user by year.
No training Training Year 1 1.35 1.58 Year 2 1.47 1.56 Year 3 1.90 4.27 Year 4 2.53 3.11
Figure 2: Year 1 training mediation model: Regression coefficients for the relationship between training and accuracy as mediated by forecasts per question. The regression coefficient between training and accuracy, controlling for forecasts per question, is in parentheses. (p < .001, ** p < 0.01, * p < 0.05.) 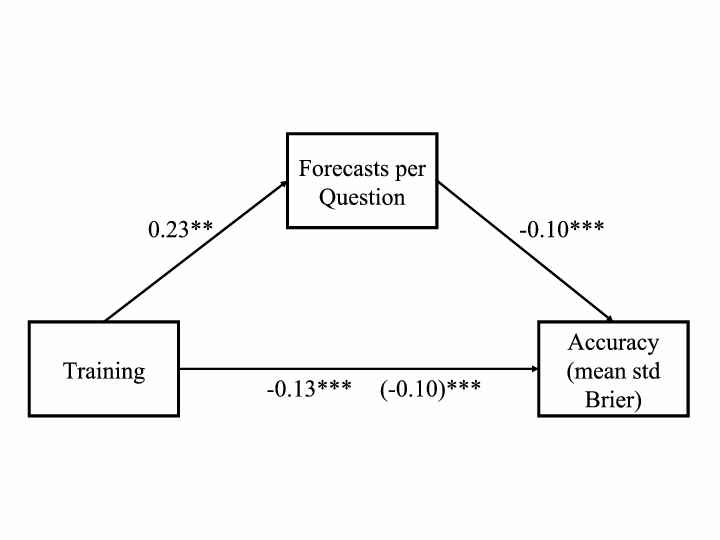
We defined targeted practice as the average number of forecasts per question by each forecaster because the theoretical foundation underlying practice effects requires targeted effort (Table 10). As shown earlier, simply doing the minimum possible to remain in the experiment was not enough to boost accuracy. A mediation analysis (Figure 2) showed that the relationship between training and accuracy was mediated by targeted practice. The results also held when targeted practice was defined as the total number of forecasts per individual. Training was a significant predictor of average number of forecasts per question for year 1 and the number of forecasts per question was also significant predictor of accuracy (measured as mean standardized Brier score). We tested the significance of the indirect effect using bootstrapping procedures with 10,000 bootstrapped samples. The indirect effect was –0.02, and the 95% confidence interval was –0.04 to –0.01 (p = 0.01).
Figure 3: Year 2 training mediation model: Regression coefficients for the relationship between training and accuracy as mediated by forecasts per question. The regression coefficient between training and accuracy, controlling for forecasts per question, is in parentheses. (p < .001, ** p < 0.01, * p < 0.05.) 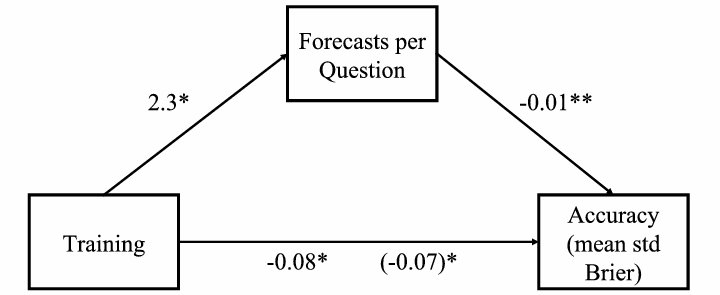
For year 2, the coefficient between training and average number of forecasts per question was not significant, but the coefficient between forecasts per question and accuracy was (n = 399). The bootstrapped indirect effect for year 2 was not significant (Figure 3).
Figure 4: Year 3 training mediation model: Regression coefficients for the relationship between training and accuracy as mediated by forecasts per question. The regression coefficient between training and accuracy, controlling for forecasts per question, is in parentheses. (p < .001, ** p < 0.01, * p < 0.05.) 
For year 3, the coefficient between training and forecasts per question was almost significant (p = 0.06), and the coefficient between average number of forecasts per question and accuracy was significant (p = 0.001, n = 213). We tested the indirect effect using the same bootstrapping procedures. The indirect effect of practice was –0.02, and the 95% confidence interval was –0.04 to –0.01 (p = 0.05) (Figure 4).
Figure 5: Year 4 training mediation model: Regression coefficients for the relationship between training and accuracy as mediated by forecasts per question. The regression coefficient between training and accuracy, controlling for forecasts per question, is in parentheses. (p < .001, ** p < 0.01, * p < 0.05.) 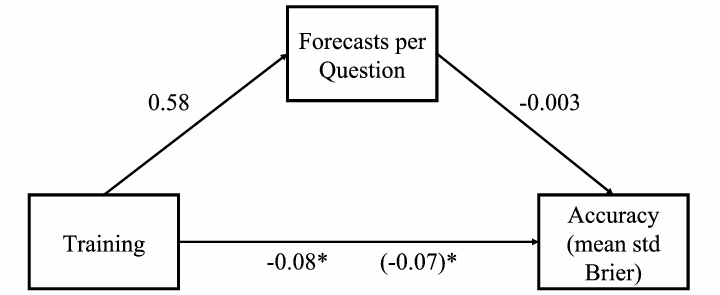
For year 4, neither the coefficient between training and forecasts per question nor the coefficient between forecasts per question and accuracy was significant (p = 0.20) (n = 221). The indirect effect was not significant (Figure 5).
Figure 6: Years 1–4 practice over time within training conditions. The points in the graphs depict the average condition’s Brier score on each day of the tournament. The regression lines were fitted with a span of two days. 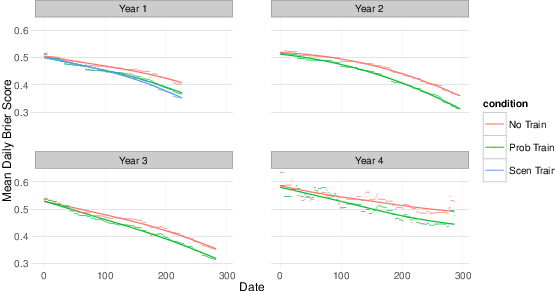
To examine forecaster accuracy over time, we calculated the daily Brier scores for each forecaster. Daily Brier scores measure accuracy on a specific day if all of the open questions for a forecaster were to suddenly “resolve” as they eventually did. We averaged daily Brier scores within each condition and plotted them over time. We expected trained forecasters to be significantly better than control forecasters across the year, and that forecasters in both trained and control conditions would improve. Figure 6 shows that year 1 forecasters in the trained condition were significantly more accurate than control forecasters at the beginning and at the end of the year. The same pattern holds in years 2–4.
Table 11: Individual differences univariate regression coefficients (standardized): Dependent variable is mean standardized Brier Score.
Variable Year 1 Year 2 Year 3 Year 4 AOMT -0.02 -0.04. -0.05. 0.00 Grit 0.03* 0.00 0.03. N/A Raven’s -0.02*** -0.01* 0.00 -0.01. Numeracy -0.05*** -0.05* -0.06*** -0.06*** CRT -0.07*** -0.04** -0.02*** -0.02*** Training -0.10*** -0.14*** -0.09* -0.16*** ***, p < .001; **, p < .01; *, p < .05.
How do individual differences in cognitive ability and motivation relate to forecasting accuracy? As mentioned earlier, two schools of thought provide diverging predictions. To test them, we focused on numeracy, cognitive reflectiveness (CRT), spatial reasoning (via Raven’s Progressive Matrices (RPM)), actively open-minded thinking (AOMT), and grit. The first three measures tapped cognitive ability (Frederick, 2005) and the latter two measure cognitive motivation.
Table 12: Individual differences regression models year 1: Dependent is mean standardized Brier Score. Coefficients are standardized.
Model 1 Model 2 Model 3 Model 4 Model 5 Constant 0.14 0.09*** 0.01 0.07 0.16*** AOMT -0.04 0.00 Grit 0.02 0.02* Cognitive Ability -0.03*** -0.03*** -0.03*** -0.04*** Training (Prob) -0.11*** -0.11*** Training (Scen) -0.10*** -0.10*** CA * Training (Prob) 0.02 CSA * Training (Scen) 0.03* R2 0.02 0.06 0.07 0.10 0.10 F 3.43** 38.9*** 14.5*** 13.5*** 13.7*** n = 348. ***, p < .001; **, p < .01; *, p < .05.
We conducted the same analyses each year by looking for effects of motivation, cognitive ability, motivation and ability, and finally motivation, ability, and training. We also looked for interaction effects. Accuracy was again operationalized as mean standardized Brier score to control for the effects of question difficulty.
Table 13: Individual differences regression models year 2: Dependent Variable is mean standardized Brier Score. Coefficients are standaridzed.
Model 1 Model 2 Model 3 Model 4 Model 5 Constant 0.14 -0.03* 0.07. 0.17 0.05** AOMT -0.03 -0.01 -0.01 Grit -0.01 -0.01 -0.01 Cognitive Ability -0.02*** -0.02*** -0.03*** -0.03*** Training -0.17*** -0.15*** CA * Training 0.00 R2 0 0.04 0.04 0.14 0.12 F 0.516 14.7*** 4.82* 12.6*** 18.2*** n = 317. ***, p < .001; **, p < .01; *, p < .05.
We conducted univariate regressions for each of the variables, with mean standardized Brier score as the dependent variable (Table 11). The most consistent predictors of accuracy were numeracy, training and CRT. Because Raven’s, numeracy and CRT were correlated, we created a composite “cognitive ability” variable by calculating the z-scores for each of the three cognitive ability variables and adding them together.
Table 14: Individual differences regression models year 3: Dependent Variable is mean standardized Brier Score. Coefficients are standaridzed.
Model 1 Model 2 Model 3 Model 4 Model 5 Constant 0.03 -0.05** 0.00 0.02 0.00 AOMT -0.03 -0.02 -0.01 Grit 0.03 0.01 0.01 Cognitive Ability -0.03*** -0.02* -0.02* -0.03** Training -0.10* -0.09* CA * Training 0.01 R2 0.02 0.06 0.05 0.08 0.09 F 1.42 11.9*** 3.2* 4.0** 6.2*** n = 182. ***, p < .001; **, p < .01; *, p < .05.
None of the motivational variables was significant, and there were no significant interactions after year 1. In year 1, there was a significant effect of cognitive ability and training (both scenario and probabilistic reasoning) on accuracy (Table 12). Cognitive ability scores moderated the effects of training, likely reflecting an accuracy ceiling for even the most skilled of the trained individuals. This interaction effect was not significant in later years.
Table 15: Individual differences regression models year 4: Dependent Variable is mean standardized Brier Score. Coefficients are standaridzed.
Model 1 Model 2 Model 3 Model 4 Model 5 Constant -0.15 0.15*** 0.05 0.11 0.23*** AOMT 0.02 0.02 0.02 Cognitive Ability -0.03*** -0.03*** -0.03*** -0.03* Training -0.15*** -0.15*** CA * Training 0.00 R2 0.01 0.05 0.05 0.10 0.10 F 1.21 12.4*** 6.59** 9.16*** 8.76*** n = 224. ***, p < .001; **, p < .01; *, p < .05.
Year 2 individual differences results were consistent with those from year 1. Again, those with high cognitive ability or who received training were significantly more accurate (Table 13).
Year 3 individual differences results were consistent with year 2 results (Table 14). Cognitive ability was a consistently significant predictor, along with training, of accuracy. The results consistently show the value of cognitive ability and training over motivation within the realm of political forecasting.
Finally, cognitive ability was a significant predictor of year 4 results (Table 15). Training was also significant in the full model. The cognitive ability and training interaction term was not significant.
Table 16: Full model regression results (all years): Dependent variable is mean standardized Brier Score. Coefficients are standardized.
Year 1 Year 2 Year 3 Year 4 0.19 0.24 0.00 0.16 0.00 -0.01 -0.01 0.03 0.02* -0.01 0.02 -0.03*** -0.02** -0.02** -0.03* -0.10*** -0.16*** -0.08* -0.15* -0.08** -0.08*** -0.07*** -0.01** -0.01* 0.15 0.20 0.13 0.10 16.6*** 16.0*** 5.22*** 7.71* ***, p < .001; **, p < .01; *, p < .05.
We propose an integrative framework to explain observed probabilistic-reasoning training effects, which includes targeted practice, cognitive ability (aggregated individual z-scores of CRT score, Berlin numeracy results, and Raven’s score), cognitive motivation (grit and active open-mindedness), and training. Across all years, these predictors collectively explained 10–20% of the variance in forecasting accuracy (Table 16). Cognitive ability was the most consistent individual difference measure, significant in all four years, and training was also significant in all four years. Consistent with the individual differences analysis in the previous section, no significant interactions among training, targeted practice, and individual differences measures were observed. Training consistently had the highest explanatory power for accuracy, followed by targeted practice, and cognitive ability. No interactions were significant. For sake of table clarity and concision, we have not included the non-significant results from the tested interactions.
Across all four years of the tournament, probabilistic reasoning training boosted forecasting accuracy, supporting H1. The CHAMPS KNOW principle most associated with boosts in accuracy was the use of comparison classes and base-rates, thus underscoring the benefits of adopting the outside view even in forecasting events that some skeptics argue were unique or sui generis (i.e., we cannot rerun history and determine how often Greece leaves the Eurozone in 2014 or how often Russia refrains from intervening in the Syrian civil war in 2015). These findings also suggest that probabilistic reasoning training need not be overly long and drawn out and that exposure to CHAMPS KNOW concepts that boost accuracy can be accomplished efficiently, as the modules we developed were designed to be completed within an hour. These findings are also consistent with previous research on education and cognitive debiasing, which showed improvements in judgmental accuracy from training in statistics.
Individual forecasters in the training and control conditions differed in how much they engaged in targeted practice (i.e., the average number of forecasts per person per question). A model in which targeted practice mediated the relationship between training and accuracy was supported in three of the four years. Trained and control forecasters both became better over the course of the year, but trained forecasters maintained their performance edge over control forecasters. These findings support H2 and point to the value of targeted practice as defined by forecasts per question. Concentrated attention on a smaller number of questions yielded better practice results than sporadic participation. It is also possible that focusing on specific questions led to the use of multiple perspectives, critically appraising first guesses, and tapping into different knowledge sources, mechanisms suggested by Herzog and Hertwig (2009) and Vul and Pashler (2008). The relationship between accuracy and average number of predictions per question also suggests that forecasting is a learned skill when questions are associated with correlated cues. Accuracy is associated with concentrated effort, not simply random chance.
The most consistent correlates of accuracy were cognitive abilities and targeted practice, which supports H3a (higher cognitive ability predicts accuracy) but not H3b (cognitive motivation predicts accuracy). And even H3a received only has partial support because two of our measures of cognitive ability, numeracy and spatial reasoning, were not predictive. H4, H5 and H6 were unsupported due to the lack of significant interactions among individual differences, practice, and training. Taken together, the results suggest that: (a) pre-existing cognitive abilities matter and (b) targeted practice and probability training promote greater accuracy. Our results also suggest that the combination of cognitive debiasing training (specifically, using comparison classes) and making concentrated, targeted use of that knowledge can improve analytic performance. Although the other debiasing principles did not prove useful here, it would be premature to say that only training in comparison classes matters. Additionally, for organizations trying to improve the judgment of their employees, screening applicants based on cognitive ability and giving them the opportunity to train and practice are potential avenues to explore.
The training in this study was created to win a geopolitical forecasting tournament sponsored by the U.S. government, and we drew eclectically on different lines of work on good judgment to create the CHAMPS KNOW principles. As such, the aim of training was solely outcome focused — find what works in order to win — and not specifically about identifying and isolating each probabilistic reasoning principle to determine its incremental effectiveness. One avenue for future research is to determine which of the CHAMPS KNOW principles drive accuracy on which problem domains. Ideally, each of these principles would be tested in a longitudinal tournament format, similar to the geopolitical forecasting tournament that generated the principles in the first place, or at least in laboratory settings where the effect of each principle can be isolated. In addition, natural language processing techniques could be used on the forecast explanations provided by the trained forecasters to understand how they practiced the principles of forecasting on which they were trained. By identifying the most and least effective reasoning principles, it should be possible to improve training modules for organizations where making probabilistic judgments and forecasts are a core duty for employees. Testing training principles in this format might also yield results that indicate which principles are most efficient for debiasing. One debiasing method, which went untested in the tournament, was the use of visualizations and alternative presentations of data. Further research should test these methods in tandem with and against the Bayesian reasoning principles in CHAMPS.
CHAMPS KNOW is not the upper limit for improving accuracy via training and the current analysis is not exhaustive. Another research avenue is to perform textual analyses and debriefings of the most successful forecasters to determine whether they used reasoning principles beyond CHAMPS KNOW. More advanced techniques could be developed from looking bottom-up at previously aggregated forecasting data.
A third avenue of future research involves understanding how trained forecasters differ in thinking from control forecasters. Additional research into how forecasters are operationalizing the training concepts is required. Such research could include investigating whether trained forecasters are likelier to be more scope sensitive and likelier to employ cognitive triage or make granular assessments of uncertainty. Other future research includes training the best forecasters, so-called superforecasters (Mellers et al., 2015) with more advanced cognitive debiasing modules to see if training can push the upper limit of forecasting performance even further. Each avenue could sharpen the results from this current study and help organizations avoid making costly forecasting errors.
Anderson, C. A. (1982). Inoculation and counterexplanation: Debiasing techniques in the perseverance of social theories. Social Cognition, 1(2), 126–139.
Arkes, H. R. (1981). Impediments to accurate clinical judgment and possible ways to minimize their impact. Journal of Consulting and Clinical Psychology, 49(3), 323–330.
Arkes, H. R. (1991). Costs and benefits of judgment errors: Implications for debiasing. Psychological Bulletin, 110(3), 486–498.
Arkes, H. R., Faust, D., Guilmette, T. J., & Hart, K. (1988). Eliminating the hindsight bias. Journal of Applied Psychology, 73(2), 305–307.
Atkins, R. (2015, July 2). Why Grexit odds are probably 99% wrong. Financial Times. Retrieved March 25, 2016 from http://www.ft.com/cms/s/0/bb18e6e6-1ff8-11e5-aa5a-398b2169cf79.html\#axzz4IbPgbxMm.
Bar-Hillel, M. (1980). The base-rate fallacy in probability judgments. Acta Psychologica, 44(3), 211–233.
Barbey, A. K., & Sloman, S. A. (2007). Base-rate respect: From ecological rationality to dual processes. Behavioral and Brain Sciences, 30(03), 241–254.
Benson, P. G., & Önkal, D. (1992). The effects of feedback and training on the performance of probability forecasters. International Journal of Forecasting, 8(4), 559–573.
Bilmes, L. J. (2014). The financial legacy of Afghanistan and Iraq: How wartime spending decisions will constrain future US national security budgets. The Economics of Peace and Security Journal, 9(1), 5-17. http://dx.doi.org/10.15355/epsj.9.1.5.
Bourgeois-Gironde, S., & Van Der Henst, J.-B. (2009). How to open the door to system 2: Debiasing the bat-and- ball problem. In S. Watanabe, A. P. Bloisdell, L. Hu- ber, & A. Young (Eds.), Rational Animals, Irrational Humans (p. 235-252). Tokyo: Keio University Press.
Brier, G. W. (1950). Verification of forecasts expressed in terms of probability. Monthly Weather Review, 78(1), 1–3.
De Mesquita, B. B., Smith, A., Siverson, R.M., & Morrow, J.D. (2005). The logic of political survival. MIT press.
Büyükkurt, B. K., & Büyükkurt, M. D. (1991). An Experimental Study of the Effectiveness of Three Debiasing Techniques*. Decision Sciences, 22(1), 60–73.
Cacioppo, J. T., Petty, R. E., Feinstein, J. A., & Jarvis, W. B. G. (1996). Dispositional differences in cognitive motivation: The life and times of individuals varying in need for cognition. Psychological Bulletin, 119, 197–253.
Case, D. A., Fantino, E. & Goodie, A. S. (1999). Baserate-training without case cues reduces base-rate neglect. Psychonomic Bulletin and Review, 6, 319–327.
Cheng, F.-F., & Wu, C.-S. (2010). Debiasing the framing effect: The effect of warning and involvement. Decision Support Systems, 49(3), 328–334.
Cirincione, J. (2014). Repairing the regime: Preventing the spread of Weapons of Mass Destruction. New York, NY: Routledge.
Cokely, E. T., Galesic, M., Schulz, E., Ghazal, S., & Garcia-Retamero, R. (2012). Measuring risk literacy: The Berlin Numeracy Test. Judgment and Decision Making, 7(1), 25–47.
Croskerry, P. (2003). Cognitive forcing strategies in clinical decision making. Annals of Emergency Medicine, 41(1), 110–120.
Croskerry, P., Singhal, G., & Mamede, S. (2013a). Cognitive debiasing 1: Origins of bias and theory of debiasing. BMJ Quality & Safety, 22(Suppl 2), ii58–ii64.
Croskerry, P., Singhal, G., & Mamede, S. (2013b). Cognitive debiasing 2: Impediments to and strategies for change. BMJ Quality & Safety, 22(Suppl 2), ii65–ii72.
Deary, I. J. (2000). Looking down on human intelligence: From psychometrics to the brain. Oxford, England: Oxford University Press.
Duckworth, A. L., Peterson, C., Matthews, M. D., & Kelly, D. R. (2007). Grit: perseverance and passion for long-term goals. Journal of Personality and Social Psychology, 92(6), 1087–1101.
Duckworth, A. L., & Quinn, P. D. (2009). Development and validation of the Short Grit Scale (GRIT–S). Journal of Personality Assessment, 91(2), 166–174.
Ericsson, K. A. (2002). Attaining excellence through deliberate practice: Insights from the study of expert performance. In M. Ferrari (Ed.), The pursuit of excellence in education (pp. 21–55). Hillsdale, N.J.: Erlbaum.
Ericsson, K. A. (2006). The influence of experience and deliberate practice on the development of superior expert performance. In K.A. Ericksson, et al. (Eds.), The Cambridge handbook of expertise and expert performance (pp. 683–703). Cambridge: Cambridge University Press.
Ericsson, K. A. (2007). Deliberate practice and the modifiability of body and mind: Toward a science of the structure and acquisition of expert and elite performance. International Journal of Sport Psychology, 38(1), 4–34.
Ericsson, K. A. (2008). Deliberate practice and acquisition of expert performance: a general overview. Academic Emergency Medicine, 15(11), 988–994.
Ericsson, K. A., Krampe, R. T., & Tesch-Römer, C. (1993). The role of deliberate practice in the acquisition of expert performance. Psychological review, 100(3), 363–406.
Ericsson, K. A., & Lehmann, A. C. (1996). Expert and exceptional performance: Evidence of maximal adaptation to task constraints. Annual Review of Psychology, 47(1), 273–305.
Finnemore, M., & Sikkink, K. (1998). International norm dynamics and political change. International Organization, 52(04), 887–917.
Fischbein, E., & Gazit, A. (1984). Does the teaching of probability improve probabilistic intuitions? Educational Studies in Mathematics, 15(1), 1–24.
Fischhoff, B. (1982). Debiasing. In D. Kahneman, et al., (Eds.), Judgment under uncertainty: Heuristics and biases (pp. 422–444). New York, NY: Cambridge University Press.
Fischhoff, B., & Bar-Hillel, M. (1984). Focusing techniques: A shortcut to improving probability judgments? Organizational Behavior and Human Performance, 34(2), 175–191.
Flavell, J. H. (1979). Metacognition and cognitive monitoring: A new area of cognitive–developmental inquiry. American Psychologist, 34(10), 906–911.
Flyvbjerg, B. (2008). Curbing optimism bias and strategic misrepresentation in planning: Reference class forecasting in practice. European Planning Studies, 16(1), 3–21.
Fong, G. T., Krantz, D. H., & Nisbett, R. E. (1986). The effects of statistical training on thinking about everyday problems. Cognitive Psychology, 18(3), 253–292.
Frederick, S. (2005). Cognitive reflection and decision making. Journal of Economic Perspectives, 19(4), 25–42.
Gigerenzer, G. (1991). How to make cognitive illusions disappear: Beyond “heuristics and biases”. In W. Stroebe, & M. Hewstone (Eds.), European review of social psychology, (pp. 83–115). Chichester: Wiley.
Gigerenzer, G., & Hoffrage, U. (1995). How to improve Bayesian reasoning without instruction: Frequency formats. Psychological Review, 102(4), 684–704.
Gigerenzer, G., Todd, P.M., & the ABC Research Group. (1999). Simple Heuristics That Make Us Smart. New York, NY: Oxford University Press.
Graber, M. L. (2003). Metacognitive training to reduce diagnostic errors: ready for prime time? Academic Medicine, 78(8), 781.
Graber, M. L., Kissam, S., Payne, V. L., Meyer, A. N., Sorensen, A., Lenfestey, N., . . . Singh, H. (2012). Cognitive interventions to reduce diagnostic error: a narrative review. BMJ Quality & Safety, 21(7), 535–57.
Hafenbrack, A. C., Kinias, Z., & Barsade, S. G. (2014). Debiasing the mind through meditation mindfulness and the sunk-cost bias. Psychological Science, 25(2), 369–376.
Haran, U., Ritov, I., & Mellers, B. A. (2013). The role of actively open-minded thinking in information acquisition, accuracy, and calibration. Judgment and Decision Making, 8(3), 188–201.
Herzog, S. M., & Hertwig, R. (2009). The wisdom of many in one mind improving individual judgments with dialectical bootstrapping. Psychological Science, 20(2), 231–237.
Jolls, C., & Sunstein, C. R. (2005). Debiasing through law. Journal of Legal Studies, 35(1), 199–241
Kahneman, D., & Tversky, A. (1973). On the psychology of prediction. Psychological Review, 80(4), 237–251.
Kahneman, D., & Tversky, A. (1979). Intuitive prediction: Biases and corrective procedures. Management Science, 12, 313–327.
Kahneman, D., & Tversky, A. (1982). On the study of statistical intuitions. Cognition, 11(2), 123–141.
Kahneman, D., & Tversky, A. (1984). Choices, values, and frames. American Psychologist, 39(4), 341–350.
Kardes, F. R., Posavac, S. S., Silvera, D., Cronley, M. L., Sanbonmatsu, D. M., Schertzer, S., . . . Chandrashekaran, M. (2006). Debiasing omission neglect. Journal of Business Research, 59(6), 786-792.
Keohane, R. O. (2005). After hegemony: Cooperation and discord in the world political economy. Princeton, NJ: Princeton University Press.
Keren, G. (1990). Cognitive aids and debiasing methods: Can cognitive pills cure cognitive ills? Advances in Psychology, 68, 523-552.
Koriat, A., Lichtenstein, S., & Fischhoff, B. (1980). Reasons for confidence. Journal of Experimental Psychology: Human Learning and Memory, 6(2), 107–118.
Larrick, R. P., Morgan, J. N., & Nisbett, R. E. (1990). Teaching the use of cost-benefit reasoning in everyday life. Psychological Science, 1(6), 362–370.
Lehman, D. R., Lempert, R. O., & Nisbett, R. E. (1988). The effects of graduate training on reasoning: Formal discipline and thinking about everyday-life events. American Psychologist, 43(6), 431–442.
Lehman, D. R., & Nisbett, R. E. (1990). A longitudinal study of the effects of undergraduate training on reasoning. Developmental Psychology, 26(6), 952–960.
Lichtenstein, S., & Fischhoff, B. (1980). Training for calibration. Organizational Behavior and Human Performance, 26(2), 149–171.
Lichtenstein, S., Slovic, P., Fischhoff, B., Layman, M., & Combs, B. (1978). Judged frequency of lethal events. Journal of Experimental Psychology: Human Learning and Memory, 4(6), 551–578.
Lilienfeld, S. O., Ammirati, R., & Landfield, K. (2009). Giving debiasing away: Can psychological research on correcting cognitive errors promote human welfare? Perspectives on Psychological Science, 4(4), 390–398.
Lovallo, D., Clarke, C., & Camerer, C. (2012). Robust analogizing and the outside view: two empirical tests of case-based decision making. Strategic Management Journal, 33(5), 496–512.
Macchi, L. (2000). Partitive formulation of information in probabilistic problems: Beyond heuristics and frequency format explanations. Organizational Behavior and Human Decision Processes, 82(2), 217-236.
Mandel, D. R., & Navarrete, G. (2015). Introduction to Improving Bayesian Reasoning: What Works and Why? Frontiers in Psychology, 6, 6–8. http://dx.doi.org/10.3389/fpsyg.2015.01872.
Mellers, B., & McGraw, A. P. (1999). How to improve Bayesian reasoning: Comment on Gigerenzer and Hoffrage. Psychological Review, 106, 417-424.
Mellers, B., Stone, E., Murray, T., Minster, A., Rohrbaugh, N., Bishop, M., …& Horowitz, M. (2015). Identifying and Cultivating Superforecasters as a Method of Improving Probabilistic Predictions. Perspectives on Psychological Science, 10(3), 267–281.
Mellers, B., Ungar, L., Baron, J., Ramos, J., Gurcay, B., Fincher, K., …& Swift, S. A. (2014). Psychological strategies for winning a geopolitical forecasting tournament. Psychological Science, 25(5), 1106–1115.
Miller, G. A. (1969). Psychology as a means of promoting human welfare. American Psychologist, 24(12), 1063–1075.
Moore, D. A., Swift, S. A., Minster, A., Mellers, B., Ungar, L., Tetlock, P., . . . Tenney, E. R. (2016). Confidence Calibration in a Multi-Year Geopolitical Forecasting Competition: Supplementary Materials. Management Science, Published Online: August 22, 2016, http://dx.doi.org/10.1287/mnsc.2016.2525
Morewedge, C. K., & Kahneman, D. (2010). Associative processes in intuitive judgment. Trends in Cognitive Sciences, 14(10), 435-440.
Neilens, H. L., Handley, S. J., & Newstead, S. E. (2009). Effects of training and instruction on analytic and belief-based reasoning processes. Thinking & Reasoning, 15(1), 37–68.
Nelson, T. O., & Narens, L. (1994). Why investigate metacognition?. In J. Metcalfe, & A. P. Shimamura, (Eds.), Metacognition: Knowing About Knowing (pp. 1-25). Cambridge, MA: MIT press.
Nisbett, R. E., Krantz, D. H., Jepson, C., & Kunda, Z. (1983). The use of statistical heuristics in everyday inductive reasoning. Psychological Review, 90(4), 339–363.
Petty, R. E., & Cacioppo, J. T. (1984). Source factors and the elaboration likelihood model of persuasion. Advances in Consumer Research, 11(1), 668–672.
Radecki, R. P., & Medow, M. A. (2007). Cognitive debiasing through sparklines in clinical data displays. Paper presented at the AMIA Annual Symposium, Chicago, IL, 11, 1085.
Raven, J., & Raven, J. (2003). Raven progressive matrices. In R. S. McCallum (Ed.), Handbook of nonverbal assessment (pp. 223–237). New York, NY: Kluwer Academic/ Plenum Publishers.
Ross, L., Lepper, M. R., & Hubbard, M. (1975). Perseverance in self-perception and social perception: biased attributional processes in the debriefing paradigm. Journal of Personality and Social Psychology, 32(5), 880–892.
Roy, M. C., & Lerch, F. J. (1996). Overcoming ineffective mental representations in base-rate problems. Information Systems Research, 7(2), 233–247.
Salas, E., & Cannon-Bowers, J. A. (2001). The science of training: A decade of progress. Annual Review of Psychology, 52(1), 471-499.
Schmidt, F. L., & Hunter, J. E. 2000. Select on intelligence. In E. Locke (Ed.), The Blackwell handbook of principles of organizational behavior (pp. 3-14). Oxford, UK: Blackwell.
Sears, D. O. (1986). College sophomores in the laboratory: Influences of a narrow data base on social psychology’s view of human nature. Journal of Personality and Social Psychology, 51(3), 515–530.
Sedlmeier, P., & Gigerenzer, G. (2001). Teaching Bayesian reasoning in less than two hours. Journal of Experimental Psychology: General, 130(3), 380–400.
Slovic, P., & Fischhoff, B. (1977). On the psychology of experimental surprises. Journal of Experimental Psychology: Human Perception and Performance, 3(4), 544–551.
Stanovich, K. E., & West, R. F. (1998a). Individual differences in framing and conjunction effects. Thinking & Reasoning, 4(4), 289-317.
Stanovich, K. E., & West, R. F. (1998b). Individual differences in rational thought. Journal of Experimental Psychology: General, 127(2), 161–188.
Stewart, T. R. (2001). Improving reliability of judgmental forecasts. In S. J. Armstrong (Ed). Principles of Forecasting (pp. 81–106). Norwell, MA: Kluwer Academic Publisher.
Stone, E. R., & Opel, R. B. (2000). Training to improve calibration and discrimination: The effects of performance and environmental feedback. Organizational Behavior and Human Decision Processes, 83(2), 282-309.
Surowiecki, J. (2005). The wisdom of crowds. New York, NY: Anchor.
Taleb, N., & Blyth, M. (2011). The black swan of Cairo: How suppressing volatility makes the world less predictable and more dangerous. Foreign Affairs (May/June). Retrieved from http://www.poslovni.hr/media/PostAttachments/1241349/ForeignAffairs.pdf.
Taleb, N. N. (2010). The black swan: the impact of the highly improbable (2nd ed). New York, NY: Random House.
Tetlock, P. E. (2005). Expert political judgment: How good is it? How can we know? Princeton, NJ: Princeton University Press.
Tetlock, P. E., Mellers, B. A., Rohrbaugh, N., & Chen, E. (2014). Forecasting Tournaments Tools for Increasing Transparency and Improving the Quality of Debate. Current Directions in Psychological Science, 23(4), 290–295.
Tversky, A., & Kahneman, D. (1974). Judgment under uncertainty: Heuristics and biases. science, 185(4157), 1124–1131.
Tversky, A., &Kahneman, D. (1982). Evidential impact of base rates. In D. Kahneman, P. Slovic, & A. Tversky (Eds.),Judgment under uncertainty: Heuristics and biases (pp. 153–162). New York, NY: Cambridge University Press.
Vul, E., & Pashler, H. (2008). Measuring the crowd within probabilistic representations within individuals. Psychological Science, 19(7), 645–647.
Waltz, K. N. (2001). Man, the state, and war: A theoretical analysis (Revised ed.). New York, NY: Columbia University Press.
Wegener, D. T., & Petty, R. E. (1997). The flexible correction model: The role of naive theories of bias in bias correction. In M. P. Zanna (Ed.), Advances in Experimental Social Psychology (pp. 141–208). Mahwah, NJ: Erlbaum.
Weinstein, N. D., & Klein, W. M. (1995). Resistance of personal risk perceptions to debiasing interventions. Health Psychology, 14(2), 132–140.
Whitecotton, S. M., Sanders, D. E., & Norris, K. B. (1998). Improving predictive accuracy with a combination of human intuition and mechanical decision aids. Organizational Behavior and Human Decision Processes, 76(3), 325–348.
Yamagishi, K. (2003). Facilitating normative judgments of conditional probability: Frequency or nested sets? Experimental Psychology, 50(2), 97–106.
The authors thank Lyle Ungar and Angela Duckworth for their comments as well as Pavel Atanasov, Philip Rescober and Angela Minster for their help with data analysis. Pavel Atanasov, Terry Murray and Katrina Fincher were instrumental in helping us develop the training materials as well. This research was supported by the Intelligence Advanced Research Projects Activity (IARPA) via the Department of Interior National Business Center contract number D11PC20061. The U.S. Government is authorized to reproduce and distribute reprints for Government purposes notwithstanding any copyright annotation thereon.
Disclaimer: The views and conclusions expressed herein are those of the authors and should not be interpreted as necessarily representing the official policies or endorsements, either expressed or implied, of IARPA, DoI/NBC, or the U.S. Government.
Copyright: © 2016. The authors license this article under the terms of the Creative Commons Attribution 3.0 License.
This document was translated from LATEX by HEVEA.