| Figure 1: Bar charts for information nudges: Government campaigns, total support in % (unweighted). |
Judgment and Decision Making, Vol. 11, No. 4, July 2016, pp. 310-325.
Do Europeans like nudges?Lucia A. Reisch* Cass R. Sunstein# |
In recent years, many governments have shown a keen interest in “nudges” — approaches to law and policy that maintain freedom of choice, but that steer people in certain directions. Yet to date, there has been little evidence on whether citizens of various societies support nudges and nudging. We report the results of nationally representative surveys in six European nations: Denmark, France, Germany, Hungary, Italy, and the United Kingdom. We find strong majority support for nudges of the sort that have been adopted, or under serious consideration, in democratic nations. Despite the general European consensus, we find markedly lower levels of support for nudges in two nations: Hungary and Denmark. We are not, in general, able to connect support for nudges with distinct party affiliations.
Keywords: nudges, Europe, law, policy, default rules
In recent years, many governments have shown a keen interest in “nudges” — approaches to law and policy that maintain freedom of choice, but that steer people in certain directions (Halpern, 2015; Thaler & Sunstein, 2008). In 2010, the United Kingdom established a Behavioural Insights Team, which now has an extensive track record (Halpern, 2015). In 2014, the United States created a Social and Behavioral Sciences Team of its own (SBST, 2015), and President Obama formally embraced the approach with an important Executive Order in 2015 (Obama, 2015). Both Australia and Germany established their own behavioral science teams in 2015. Uses of behavioral science, with particular emphasis on nudges, have attracted increasing interest all over the world (Ly & Soman, 2013; Sunstein, 2016a), and perhaps especially in Europe (Whitehead et al., 2014).
To date, there is little information about whether citizens of various nations actually endorse nudges, and more particularly, about the line between those that they would endorse and those that they would reject. To be sure, some valuable studies have explored public attitudes toward nudges. Surveying 952 people in Sweden and the United States, Hagman et al. (2015) find that strong majorities of both Swedes and Americans support a wide variety of nudges. Felsen et al. (2013), surveying 2,775 people in Canada and the United States, find that people are favorably disposed to “System 2 nudges”, understood as those that promote reflection and deliberation, and generally also to “System 1 nudges”, targeting or enlisting more automatic processing — but with stronger support for the former. In the most comprehensive study to date, Jung and Mellers (2016) find broad American support for nudges, but similarly find that System 2 nudges are more popular. They also find that certain personality characteristics (such as a tendency to be empathetic) are associated with support for nudges and that other characteristics (such as a tendency to be individualistic or reactant) are associated with rejection of nudges (ibid.).
Tannenbaum, Fox and Rogers (2015) find that if participants are informed about particular nudges that have been supported by particular leaders or parties, their general views about nudging can be greatly affected, suggesting wha they call a “partisan nudge bias”. In the realm of eating and health behaviour — standard areas for the application of nudges — recent survey studies find positive attitudes towards nudging strategies (Diepeveen et al., 2013; Junghans, Cheung & de Ridder, 2015; Junghans, Marchiori & de Ritter, 2016). Junghans et al. (2015, 2016) find that approval is contingent on the source of the nudge, with approval rates growing if experts are the source and if the source is perceived as having good intentions. Moreover, there is some evidence that people might display a degree of psychological reactance to being nudged (Arad & Rubinstein, 2015).
Within democratic nations, we could easily imagine nudges that would likely obtain widespread approval — for example, a general injunction from public officials that citizens should vote in a coming election. We could also imagine nudges that would likely provoke widespread alarm — for example, a default rule to the effect that, unless people say otherwise, they are presumed to be members of the political party of the nation’s current leader. But is it possible to develop principles to distinguish nudges that people approve from those they reject? Are there differences across time? Across nations? And within nations, to what extent do party affiliations explain people’s views with respect to nudges?
We do not contend that the views of citizens should dispose of the policy questions, whether they are economic, scientific, or ethical. People might oppose a nudge on the ground that it “sounds bad”, even though it would have benefits far in excess of costs and offend no relevant moral principle. They might support a nudge on the ground that it “sounds good”, and does not offend any evident principle, even though that nudge would turn out, on reflection, to be ineffective or counterproductive. Many nudges require careful thinking about consequences, and those who answer survey questions cannot be expected to engage in that thinking.
Nonetheless, survey responses provide relevant information, not least because public officials are inevitably responsive to what people think. If an intervention would trigger widespread public alarm, officials will be less likely to support it. By contrast, public approval can serve as a kind of permission slip. And if we believe in some version of the “wisdom of crowds”, widespread approval or disapproval might have a degree of epistemic value.
We report here the results of surveys in six nations in Europe: Denmark, France, Germany, Hungary, Italy, and the United Kingdom.1 The countries were chosen to represent different cultural and geographic regions of Europe as well as different socio-economic regimes and political traditions: a Nordic welfare state (Denmark); a social market economy with a deep, historically grounded distrust of paternalism (Germany); a Central European post-socialist country (Hungary); two Southern European countries with different political regimes, problems, strengths, and experience with nudging (France and Italy); and the UK, the country that has spearheaded nudging as a policy tool worldwide since 2010 (Halpern, 2015), and hence had several years of debate on the pros and cons of nudging.
Our major finding is simple: In general, there is broad support, throughout the six nations, for twelve of the 15 nudges that we tested — and broad opposition, throughout those nations, to the remaining three nudges. In that respect, we find a substantial consensus among disparate nations. The simplest lesson is that, if people believe that a nudge has legitimate goals and think that it fits with the interests or values of most people, they are overwhelmingly likely to favor it. This finding fits with other studies strongly suggesting that people do not oppose nudges as such (Hagman, Andersson, Västfjäll & Tinghög, 2015; Jung & Mellers, 2016; Tannenbaum et al., 2015). Their judgments usually depend on whether the particular nudge is likely to be well-motivated and to have good consequences (from the standpoint of most people whom they affect).
Two of the three rejected nudges run afoul of a principle on which there is apparently a European consensus: The government should not take people’s money without their affirmative consent, even for a good cause. With respect to both charitable donations and carbon offsets, a default rule is unacceptable because it offends that principle. We suspect that this finding reflects a broadly held commitment to the idea that by default, people are entitled to keep their own resources; without a clear statement of their own intentions, those resources should remain theirs. (There is an evident connection between this finding and the well-known phenomenon of loss aversion.) Europeans also reject a nudge that is unambiguously manipulative: a subliminal advertising campaign in movie theaters, designed to convince people not to smoke and overeat. Subliminal advertising can be seen as a defining example of manipulation, because it appeals to people’s unconscious processing (Barnhill, 2014).
Notwithstanding the general consensus, we find a noteworthy division among nations: while majorities in both Denmark and Hungary are supportive of many nudges, citizens of those nations show significantly2 lower levels of receptivity to them than do citizens of France, Germany, Italy, and the United Kingdom. Interestingly, however, we do not find, within Europe, consistent and clear associations between party affiliations and approval or disapproval of nudges.
Table 1: Samples and sampling in the different countries: Types of representativeness and methodology.
Country Italy UK France Germany Hungary Denmark Notes: “f2f (face to face) representative” means representative for the resident population. “Online representative” means representative for private Internet users. “Rim weighting” is used when a) you want to weight according to various characteristics, but do not know the relationship of the intersection of those characteristics; or b) you do not have enough respondents to fill all the possible cells of the table if you were to weight the data using the multidimensional technique described above. For example, you may want to weight by age, sex and marital status and may know the weights for each category of those characteristics (e.g. people aged 25 to 30; men; single people). However, you may not know the weights for, say, single men aged between 25 and 30, married women aged between 31 and 40, and so on. “Target weights” may be used when you know the exact number of respondents you want to appear in each cell of the weighted table. For example, in a table of age by sex, you may know the exact number of men under 21, women under 21, and so on, to appear in the table once it has been weighted. The weights that you define in your matrix are therefore the values to appear in the weighted table rather than the weights to be applied to each respondent of a given age and sex.
We employed nationally representative online surveys in six European nations: Denmark, France, Germany, Hungary, Italy, with about 1000 respondents each, and the United Kingdom, with about 2000 respondents. Because the respective nation’s online population nearly equals full population in all six countries, and because a stratified sample was used, we can assume almost full representativeness of the surveys (Blasius & Brandt, 2010). At the same time, we are aware of the limitation that online representativeness does not fully equal ad hoc representativeness.
All questionnaires were filled out as part of a CAWI (Computer Assisted Web Interview) omnibus survey, except in the case of Hungary, where no omnibus survey was available and hence a CAWI ad hoc survey was employed. The advantages of omnibus surveys include cost savings (because the sampling and screening costs are shared across multiple clients) and timeliness (because omnibus samples are large and interviewing is ongoing); the drawbacks are uncontrollable framing issues (produced by earlier questions), which cannot be fully ruled out in practice.
In each country, quota samples were used, i.e., data collection was done following quotas for specific socio-demographic characteristics, and then the observations were weighted according to their frequency in the population.3 There were no screening questions; the entire sample of males and females, aged according to the country-specific age range, was interviewed. There was no significant difference between using unweighted and weighted data. An overview of the sampling method is provided in Table 1.
Table 2: Overview on the approval of the 15 nudges in the six surveyed countries.
Note: total support in percentages; unweighted results.
The survey questionnaire built on prior work limited to the United States (Sunstein, in press a). The original scale included 34 items. To adjust to the European setting (some of the US nudges are already imposed in Europe) and also to be able to attain a representative sample in six countries, the number of items was reduced to 15. We picked 13 from the US survey and added two additional interventions that had been recently discussed in European politics: (1) requiring supermarket chains to keep cashiers free of sweets (Nudge 14) and (2) requiring canteens in public institutions to have one meat-free day per week (what we call Nudge 15, acknowledging that it goes beyond a nudge).
The selection covered a wide range of types of nudges: educative nudges, such as information campaigns, and defaults (i.e., different levels of intrusion); nudges targeting automatic System 1 and deliberative System 2; nudges covering different areas such as health/food, energy/climate, sustainability, organ donation, and online contracts (see Table 2).4 We emphasize that these nudges were deliberately skeletal — for example, we did not identify them with any particular source (e.g., a leader or a party), and we did not specify the process from which the nudges emerged (e.g., with or without democratic support). While it would be valuable to test whether and to what extent such characteristics affect people’s judgments, our goal here was to examine those judgments without any knowledge of them.
The questionnaire was fully structured and questions were randomized. Respondents were required to follow the questions in the given order and wording. Each item was shown on a single screen. Respondents were asked: “Do you approve or disapprove of the following hypothetical policy?” The two possible answers were displayed in a column (“approve” first, “disapprove” second). An overview of the assessment of all nudges in all countries is provided in Table 3.
The English version was taken as a reference point for the translations and re-translations into the respective languages. In the Danish and Hungarian questionnaire as well as the one for the UK, the currencies were adapted: Euros were replaced by the equivalent amount in Danish kroners, Hungarian forints and British pounds respectively.
Table 3: The 15 items of the survey master.
1. 2. 3. 4. 5. 6. 7. 8. 9. 10. 11. 12. 13. 14. 15.
The final English (UK) version was used as a blueprint. It was translated by the GFK local offices into the respective languages, and then back translated by native speakers of our research group, all knowledgeable about the concept and applications of nudging. The questionnaires were copy-tested in the six countries between June and August 2015. The survey was prepared by the authors and conducted online by GFK (Gesellschaft für Konsumforschung), the fourth largest market research organization in the world with operations in all our survey countries. GFK assumes that the respondents in all countries are widely, and similarly, familiar with online surveys.
In all six countries, the field phase took place during the first two weeks in September 2015, just before European countries were struck by the so-called “refugee crisis”. This crisis has had an immense yet thus far undocumented impact on the public’s views on politics and government policies in general and also in our six countries.
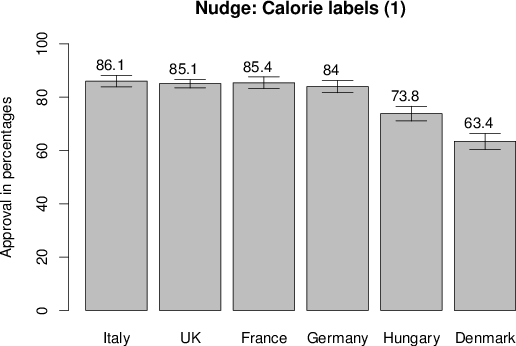
As noted, 15 interventions were investigated. For analyses and exposition here, we categorize them in terms of increasing intrusiveness, resulting in five groups: 1) purely government campaigns to educate people about childhood obesity, distracted driving, and smoking and overeating; 2) mandatory information nudges, imposed by government on the private sector, requiring disclosure of nutritional value and health risks of food (calorie labels, high levels of salt, nutritional traffic lights); 3) mandatory default rules, imposed by government on the private sector, involving green energy provision, carbon emissions charges, and donations to the Red Cross, along with mandatory choice architecture for retailers to support healthy foods, and mandatory active choice on organ donation; 4) mandatory subliminal advertising, imposed by government on movie theaters, to discourage people from smoking and overeating; 5) mandatory choice architecture involving supermarkets (sweet-free cashier zones) and also choice editing that goes beyond mere nudging (meat-free days in public cafeterias). We present the results of the five groups of interventions in terms of mean approval in percent.
Figure 1: Bar charts for information nudges: Government campaigns, total support in % (unweighted).
A number of sociodemographic variables were collected in all six countries. Due to the limited comparability across countries of the variables region, income, education, work status on the one hand and the high demands of the chosen statistical analysis regarding comparability in all countries on the other hand, we report in this cross-country analysis on only two robust sociodemographic variables, age (coded in twelve categories from 1 “16–19 years” to 12 “>70 years”) and gender (coded as dummy: 0 “female”, 1 “male”), and also on political preference. Political preference was measured by asking for whom the respondent voted in the last national elections (“When you think about the last national election, which party did you vote for?”). Appendix Table A1 shows the political parties in the six countries.
On the basis of parliamentary groups represented in the European Parliament as well as expert advice, we grouped the political parties into six clusters, namely: conservative/Christian democratic; left wing/socialist/communist; liberal; green; populist and “other”, and “don’t know/did not vote” (Appendix Table A2). These clusters were recoded as individual dummy variables. The assignment to six clusters was cross-checked and adapted by our national experts. While it was obvious that this instrument is rather rough and quite difficult to apply for some countries and parties, we assumed that if they exist, distinct partisan differences would be traceable.
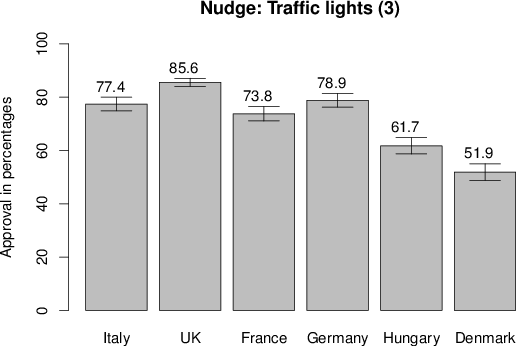
Figure 2: Bar charts for information nudges, governmentally mandated; total support in % (unweighted).
In a first step, we focused on the main results, involving approval/disapproval for individual nudges by country. Approval rates are presented in Figures 1–5. In a next step, we checked for significant differences in approval rates depending on sociodemographic variables and political preferences within countries. As the data has a nested structure, we ran a multi-level regression analysis with the specification of a 2-level random intercept model where the first level is country and the second is the individual respondent. In samples like ours, individual observations are generally not independent in the sense that individuals within one country tend to be more similar to each other than individuals from different countries.
We estimated the multi-level regression for each level of intrusion (starting with the weakest) with the approval rates being the dependent variables. For this, we calculated the mean approval in percentages by the level of intrusiveness. As outlined above, we categorize the 15 nudges in terms of increasing intrusiveness, resulting in five groups. As independent variables we use age, gender, and political attitude on the individual level, and country on the country level.
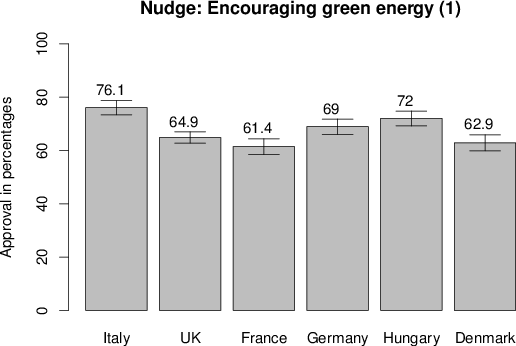
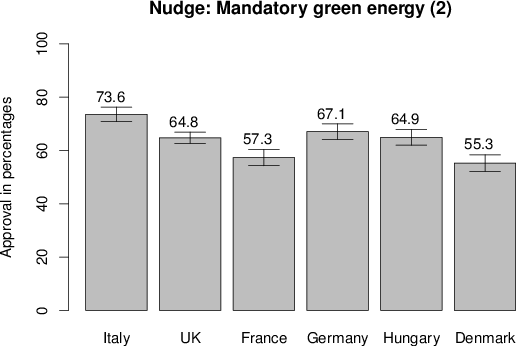
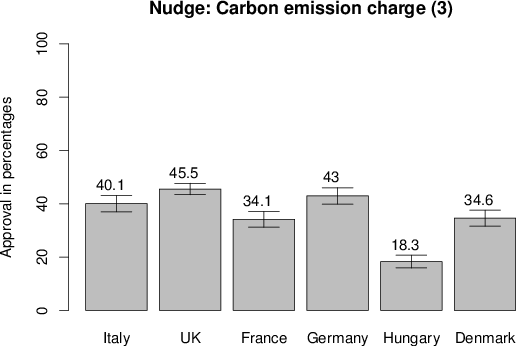
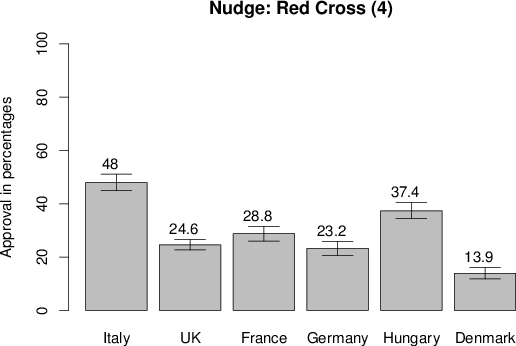
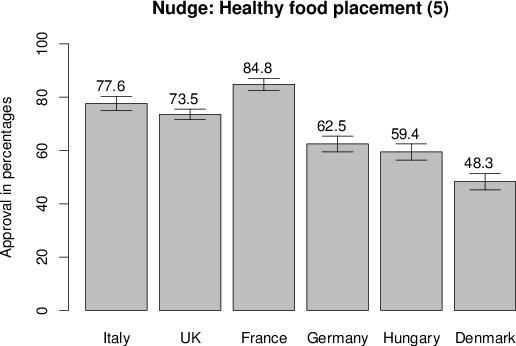
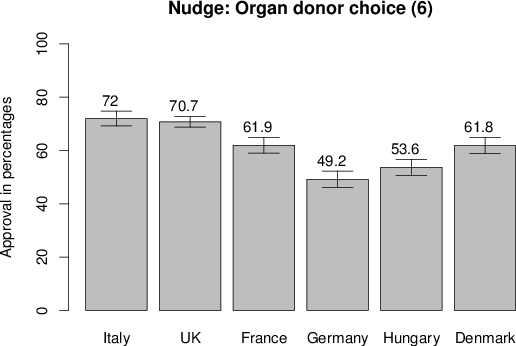
Figure 3: Bar charts for default rules, total support in % (unweighted).
Figure 4: Bar chart for subliminal ads, total support in % (unweighted). 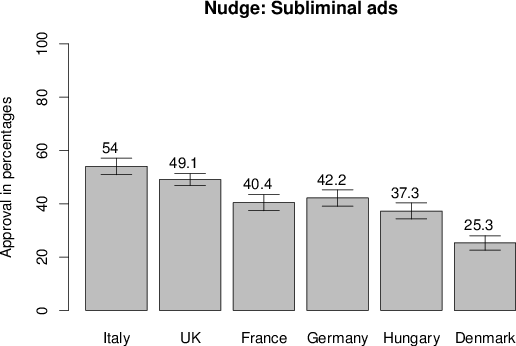
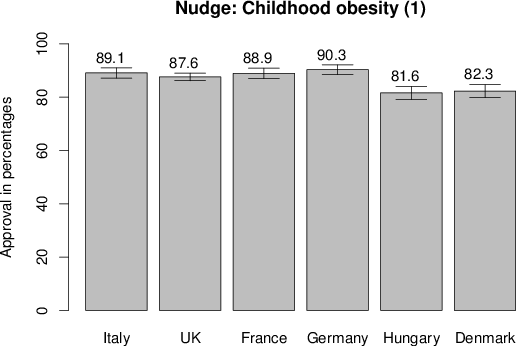
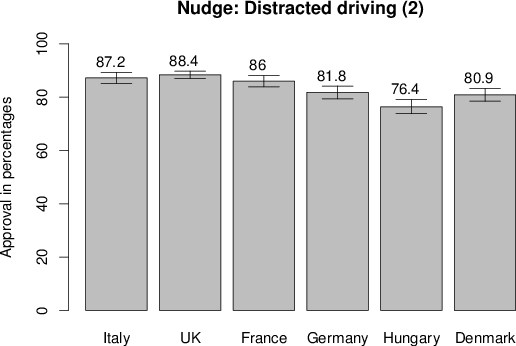
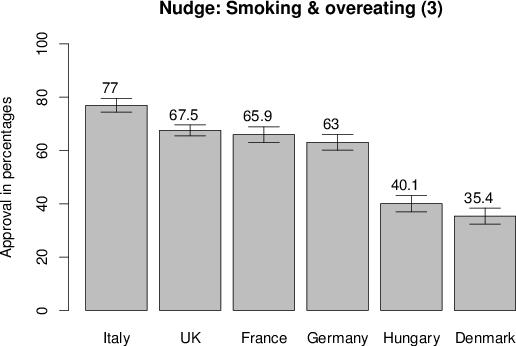
We tested three nudges that seem minimally intrusive, in the sense that they involve the mere provision of information by the government. The nudges involved (1) public education campaigns to reduce childhood obesity, (2) similar campaigns to reduce deaths and injuries from distracted driving, and (3) similar campaigns, in movie theaters, to discourage people from smoking and overeating.
Over all countries, the average approval rate for the three nudges is 76.9%. In all six nations, both (1) and (2) received overwhelming support (see Figure 1). We expected (3) to be more controversial, and it was. It did receive majority support in France, Germany, Italy, and the United Kingdom, but the levels were lower than for (1) and (2), and in Denmark and Hungary, majorities disapproved (significant difference between the two groups of countries confirmed).
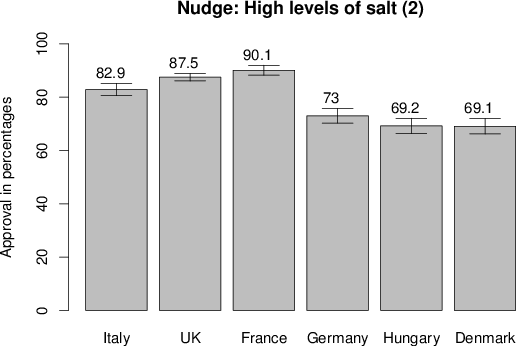
We tested three informational nudges that took the form of mandates on the private sector, designed to promote healthy eating: (1) calorie labels, (2) salt labels (for products with particularly high levels); and (3) a “traffic lights” system for more or less healthy food. Because such nudges require action by private institutions (companies), they might seem more intrusive than educational campaigns by the government itself; but all three obtained majority support, with an average approval of 78.0% across all six nations (see Figure 2). The most noteworthy division here is again between Denmark and Hungary on the one hand and France, Germany, Italy, and the United Kingdom on the other; the first two showed significantly lower levels of support (but nonetheless majorities approved).
Default rules are often the most prominent and effective nudges. We asked respondents about five potentially controversial kinds: (1) government encouragement (without a mandate) of automatic enrollment in green energy; (2) governmentally mandated green energy defaults; (3) defaulting air travelers into the payment of carbon offsets; (4) defaulting taxpayers into a 50 EURO (or equivalent) payment to the Red Cross; (5) requiring large grocery stores to place healthy foods in a prominent, accessible location. We also asked respondents about (6) requiring people to say, when they receive a drivers’ license, whether they wanted to be organ donors. Active choosing is not a default rule, but because it is a form of choice architecture designed to elicit people’s preferences, we group it with default rules here.
Figure 5: Bar charts for other mandates 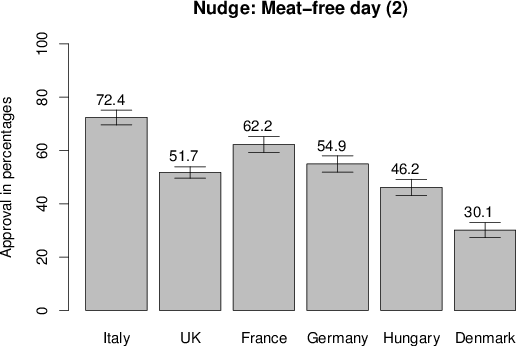
On average, 54.8% approved default rules across the six countries. In all nations, (1) and (2) received strong majority support (see Figure 3). Majorities in all nations except Denmark favored (5). In all nations, both (3) and (4) were rejected by substantial majorities (see Figure 3), which helps account for the relatively small margin of majority support for all interventions in this category. Interestingly, the nudge “encouragement of green energy” (1) is the only one without a significant difference between the two groups of countries. (Recall that we placed Hungary and Denmark in a different “group” because of their usually lower levels of support.) There was majority approval of (6) in all countries, with the interesting exception of Germany.
Finally, we asked respondents about an intervention that might be expected to be widely rejected as a defining example of manipulation: compulsory subliminal advertising in movie theaters, designed to discourage smoking and overeating. And indeed, it was widely rejected with an average approval rate of 42.5%, with the puzzling qualification that in Italy and the United Kingdom, we find majority or near-majority support (see Figure 4).
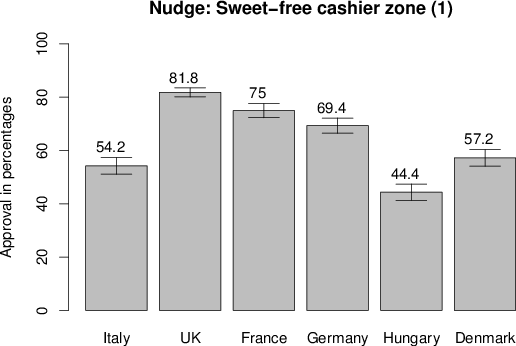
Requiring (1) sweets-free cashier areas and (2) meat-free days in cafeterias in public institutions are relatively strong government interventions. Both ideas have produced controversy in European politics; to our knowledge, they have not been tested in representative European surveys before. Sweets-free cashier areas can be regarded as a nudge for consumers; meat-free days go far beyond a nudge.
The average approval rate across countries is 59.6%. Results in Figure 5 show approval for sweets-free cashier zones in supermarkets by majorities in all countries, except for Hungary. Somewhat surprisingly, even a meat-free day in cafeterias in public institutions is approved by majorities, except for Hungary and Denmark.
We found broad support for most of the 15 nudges that we tested, notwithstanding some striking differences across the six countries (as shown in Figures 1–5). At the same time, we explored whether there might be differences in approval across demographic categories and among groups with different political preferences within countries or groups of countries. Table 4 presents the multilevel regression estimates.
Table 4: Estimates of demographics and political attitude on nudge approval.
Political attitude
& others
did not voteNote: * p≤.05; ** p≤.01; *** p≤.001; Estimates of a 2-level random intercept model. Standard errors (Confidence intervals) in parentheses. Dependent variables are the average nudge groups by intrusiveness (Min: 0; Max: 100). The intraclass correlation coefficient (ICC) is the proportion of total variance that is attributed to the cluster “country”.
The basic picture is that except for gender (females are slightly more positive), socioeconomic characteristics do not significantly influence peoples’ attitude towards the nudges in the six countries. We do see a tendency for older respondents to be more in favor of information nudges and defaults, but the effect is not a strong one and not the same in all six countries. Our results suggest that it is the aim that the government wants to achieve with the nudge that determines approval (consistent with other studies, see Jung & Mellers, 2016; Tannenbaum et al., 2015), and that as the cases of Denmark and Hungary show, country differences can matter a great deal.
As we have noted, we asked 13 of the 15 questions in a nationally representative survey of Americans (Sunstein, in press a). The results are broadly similar to what we observe in Europe (see Table 5):
Table 5: Results of the survey in the U.S., total support in % (unweighted).
Nudge Total support in the U.S. Information nudge: Government campaigns Childhood obesity 82 Distracted driving 85 Smoking and overeating 53 Information nudge: Governmentally mandated Calorie labels 87 High levels of salt 73 Traffic lights 64 Default rules Encouragement: Green energy 72 Mandate: Green energy 67 Carbon emissions charge 36 Red cross 27 Healthy food placement 56 Organ donor choice 70 Manipulation Subliminal advertisements 41
What is perhaps most striking is that the U.S. results look far more like those in Italy, France, Germany, and the United Kingdom than those in Hungary and Denmark. Notwithstanding their vaunted historical skepticism about government, Americans show majority support for nudges, closely akin to what is found in the four European nations. American disapproval — of charitable contributions by default, carbon emissions charges by default, and subliminal advertising — also track what we find in Europe.
The most noteworthy difference is that Americans are often divided along partisan lines. While most Republicans approve of most nudges (Sunstein, in press a), the level of support is often significantly higher among Democrats — demonstrating partisan disagreement that we do not clearly and consistently observe in Europe.
The best explanation for the overall pattern of results is straightforward. When Europeans believe that a nudge has legitimate purposes and is consistent with the interests or values of most people, majorities are likely to support it. At least if nudges are presented in the simple form used here, there is no opposition to nudging as such, even if it takes the form of default rules or other arguably aggressive forms of choice architecture.
It would be reasonable to speculate that people might have some kind of informal hierarchy in mind, corresponding to their intuitions about intrusiveness — with, perhaps, government educational campaigns being the weakest kind of nudge, and default rules the strongest, while mandatory information disclosure from the private sector might be found in the middle. But our results suggest that any informal hierarchy — even if it exists — is not the principal driver of people’s judgments. What most matters is what the nudge is trying to achieve (see also Jung & Mellers, 2016; Tannenbaum et al., 2015). Most of the nudges we tested were designed to promote health, safety, and clean energy, and people generally approve of them, because they endorse those goals.
Importantly, our survey did not provide people with information about benefits and costs, and their responses probably reflect intuitive (and potentially inaccurate) judgments about likely consequences. Suppose, for example, that people were informed that a certain educational campaign was expensive to implement and would have little or no effect. If so, people would be unlikely to support it. That is of course an extreme case. It would be interesting to test whether the high levels of support would increase with favorable benefit-cost ratios and if they would fall with less favorable ones. Our claim about high levels of European support for nudging depends, of course, on how Europeans respond without being given relevant information. In our view, it is relevant and important to find levels of receptivity to identifiable policy initiatives in the abstract, not least because people’s judgments will inevitably be affected by their own priors about effectiveness.
One of our most noteworthy findings is that most Europeans, like most Americans, reject nudges that take people’s money without their affirmative consent, even if the underlying cause is appealing. Apparently they do not want choice architects to produce economic or other losses by using people’s inertia or inattention against them. There appears to be a general moral principle here, one that imposes a presumptive barrier to certain nudges: If people are to give up some part of their existing holdings, it must be because they have affirmatively indicated their willingness to do so. We have evidence that this is a widely shared moral principle. It might anchor a range of ethical judgments and may even lie at the root of contract law, which often calls for explicit consent before certain losses can occur (Barnett, 1986).
At the same time, this principle leaves many open questions; it is also subject to qualifications. Our own findings suggest that it applies to money (and also bodily parts). Would it apply to any form of property (for example, real property or copyright)? We suspect so. Would it also apply to time? Again we suspect so. But if government is taking money from people’s current selves for the benefit of their future selves, they appear not to object (Sunstein, in press a). And if the point of the default rule is to compensate victims of wrongdoing, the principle is unlikely to be violated at all; people would not complain if thieves were required to return stolen money. Nor is this principle meant as a general attack on the tax system. But our evidence suggests that in any stylized case in which the government is presuming something like a donation — as when a default rule requires such a donation without explicit consent — most people will react unfavorably. Perhaps they believe that donations, as such, require personal responsibility. Far more work remains to be done on these questions, above all to identify the boundary conditions of what we have described as a general moral principle.
In philosophical circles, there is an extensive literature on the subject of manipulation (Barnhill, 2014; Sunstein, 2016b). In ordinary language, the term is one of opprobrium, which raises two distinct questions: What, exactly, is manipulation, and what is wrong with it (Barnhill, 2014)? We do not yet have anything like a “map” to people’s answers to those questions. But subliminal advertising can be taken as a defining example of unacceptable manipulation, because it influences people without engaging their conscious or deliberative capacities. The influence occurs surreptitiously (see also the finding of disapproval of visual illusions to promote safe driving in Jung & Mellers, 2016). If the government engages in subliminal advertising, people will not approve, because the use of such advertising seems unambiguously manipulative.
Some of the nudges that we tested might be thought to involve System 1, whereas others might be thought to involve System 2 (Kahneman, 2011). For example, automatic enrollment might be effective because of inertia (involving System 1), whereas education might be effective as a result of learning. We did not ask respondents to make comparisons or choices between different kinds of nudges; in that sense, we asked for approval or not in isolation. Separate evaluations can of course produce different assessments from joint evaluations (Hsee, 1996). It is fully imaginable that people would approve of a nudge (or other intervention) in isolation even if they would reject it if they were presented with alternatives, allowing for comparisons. We did not test that possibility here, though other research suggests that it is probably correct (Jung & Mellers, 2016; Sunstein, in press c).
Of the six nations, Italy and the United Kingtom are most favorably disposed toward the nudges that we tested. In Italy, only one nudge (N 14: sweets-free cashier zones in supermarkets) is less popular than in most of the other countries. Similarly, the UK is in the top rank of approval eleven out of 15 times. (France and Germany cannot be so clearly ranked.5) It is reasonable to ask why Italy and the UK are comparatively receptive. We do not have an answer to that question, but it is worthwhile to note that Italy is not known to have a tradition or recent history of antipathy to paternalistic interventions, and perhaps the recent experience of the UK, involving many uses of behavioral science (Halpern, 2015), has influenced public opinion.
Both Hungary and Denmark are consistently less favorably disposed toward nudges in general. The case of Hungary is not so puzzling. In that nation, there is widespread distrust of social institutions, which has been below the Organisation for Economic Co-operation and Development (OECD) average for a long time (OECD, 2011b).6 The legacy of Communism may lead Hungarians to disapprove of government in general. At the same time, Hungary is the country (from our subset) with the highest corruption index (OECD, 2011b). Moreover, it is below the average OECD level in voting in national elections (OECD, 2011a).7 It is safe to hypothesize that this lack of confidence has not improved with the Orban government. The Hungarian findings also cast light on differences, within nations, with respect to nudges: Citizens who distrust their government, or government in general, will be less likely to approve of nudges, even if they approve of the particular ends that those nudges would promote (for a related finding, see Tannenbaum et al., 2015).
With respect to Denmark, our findings are far more difficult to explain. That nation is not exactly known for its distrust of government, or for its firm opposition to anything that smacks of paternalism. Traditionally, Denmark has one of the highest levels of trust in government from all OECD countries (OECD, 2011b; EU, 2015). However, while trust in politicians on communal and regional levels has remained high, there has been a decline in trust in national politicians and government over the last years.8 The results of a national survey show that the trust in Danish politicians fell from 54% in 2007 to 37% in 2015.9 In particular, our results might be related to distrust in the new conservative policy landscape after the federal elections in 2015. The new government had just started its term a few months before the survey was executed. But overall, trust in government is still comparatively high in Denmark, as the latest surveys have shown (Thøgersen, 2015). Some controversial health-related interventions in Denmark (including a tax on foods with high levels of saturated fats) might have contributed to our findings.
Prior research has found that while there is bipartisan approval for a wide range of nudges in the United States (Sunstein, in press a), somewhat larger percentages of Democrats than Republicans support many recent nudges. The best explanation is not that Democrats are more supportive of nudges as such; indeed, they appear not to be (Tannenbaum et al., 2015). It is that in the domains in which public officials have adopted recent nudges, Democrats tend to be more supportive of the particular policy goals. We could easily imagine a series of nudges that would attract stronger support from Republicans than from Democrats (Tannenbaum et al., 2015).
Notably, the present survey did not produce clear differences across party lines within Europe. One of our main findings, and among the most surprising, is that party affiliations are not correlated in any systematic way with support for the nudges we tested. Within countries, however, there are some weak correlations, and there are two overall patterns. (1) In France, Green party and left-wing supporters are more favorably disposed toward the tested nudges. (2) In the United Kingdom, people who have voted for populist parties are particularly skeptical toward information nudges. (3) Over all countries, European liberals are somewhat less inclined to favor health nudges. (4) Over all countries, Green Party voters are somewhat more inclined to favor environmental nudges (not surprisingly). We suggest, however, that these findings should be taken with some caution, in light of our rough measurement of political preferences (most recent vote) and the clustering of political parties in Europe.
With respect to demographic differences, only one characteristic seems to be correlated with people’s attitudes towards the nudges we tested: gender. Women favor such nudges more than men do, with a less pronounced (but still significant) gender divide in France and Denmark. In a perhaps related finding, Jung and Mellers (2016) find that “empathetic” people are more likely to approve of nudges of the same general kind that we tested here. (We emphasize that the greater levels of female approval, and the finding with respect to “empathetic” people, occurred in the context of specific nudges; we are confident that women and empathetic people would be especially inclined to disapprove of some particular nudges, and we are far from certain that women or empathetic people would approve of nudges as such.) In general, we did not otherwise find statistically significant differences.
In Europe, there is strong majority support for nudges of the sort that have been adopted, or under serious consideration, in democratic nations. If respondents believe that a nudge has legitimate goals, and that it fits with the interests and values of most people, they are likely to favor it. At the same time, the citizens of six nations reject nudges that offend two principles that command a consensus: first, government should not take people’s money without their explicit consent and second, government should not manipulate people (at least in the defining case of subliminal advertising).
Despite the general European consensus, we find markedly lower levels of support for nudges in two nations: Hungary and Denmark. In Hungary, this finding is best explained by reference to reduced levels of trust in government — a point that confirms the intuition that when distrust of the competence or the motivation of public officials is high, even choice-preserving interventions will be unwelcome. Lower levels of support in Denmark are more challenging to explain.
In Europe, we have generally been unable to link political affiliations or demographic variables to support for (or opposition to) nudges. Among the few exceptions are somewhat stronger female approval for the tested nudges; a tendency (unsurprisingly) for Green Party voters to support environmental nudges; and lower levels of support among European liberals for health nudges.
We do not doubt that people with certain political convictions are a bit like the citizens of Hungary and Denmark, and therefore suspicious of any government action, whether it consists of nudges, taxes, subsidies, or mandates. But notably, we have been unable to find clear and consistent evidence to this effect for any political party within Europe. It is also true that some nudges seem to split Europeans along political lines. But when this is so, it is because of the particular direction in which people are being nudged — not because they are being nudged as such.
Barnett, R. (1986). A consent theory of contract. Columbia Law Review, 86(March), 269–311.
Barnhill, J. (2014). What is manipulation? In Manipulation: theory and practice (51–72). New York, NY: Oxford University Press.
Blasius, J. & Brandt, M. (2010). Representativeness in online surveys through stratified samples. Bulletin de Méthodologie Sociologique, 107(1), 5–21.
Diepeveen, S., Ling, T., Suhrcke, M., Roland, M., & Marteu, T. M. (2013). Public acceptability of government intervention to change health-related behaviours: a systematic review and narrative analysis. BMC Public Health, 13, 756.
EU - European Commission (2014). Public opinion in the European Union. Standard Eurobarometer No. 83. Brussels: EC.
Felsen, G., Castelo, N., & Reiner, P. B. (2013). Decisional enhancement and autonomy: Public attitudes towards overt and covert nudges. Judgment and Decision Making, 8(3), 202–213.
Hagman, W., Andersson, D., Västfjäll, D., & Tinghög, G. (2015). Public views on policies involving nudges. Review of Philosophy and Psychology, 6(3), 439–453.
Halpern, D. (2015). Inside the nudge unit: How small changes can make a big difference. London, UK: WH Allen.
Hsee, C. (1996). The evaluability hypothesis: An explanation for preference reversals between joint and separate evaluations of alternatives. Organizational Behavior and Decision Making Processes, 67(3), 247–257.
Jung, J. Y. & Mellers, B. A. (2016). American attitudes toward nudges. Judgment and Decision Making, 11(1), 62–74.
Junghans, A. F., Cheung, T. T. L., & de Ridder, D. D. T. D. (2015). Under consumers’ scrutiny — an investigation into consumers’ attitudes and concerns about nudging in the realm of health behaviour. BMC Public Health, 15, 336.
Junghans, A. F., Marchiori, D., de Ridder, D. (2016). The who and how of nudging: Cross-national perspectives on consumer approval in eating behaviour. Manuscript submitted for publication.
Kahneman, D. (2011). Thinking, fast and slow. New York, NY: Farrar, Strauss, and Giroux.
Ly, K., & Soman, D. (2013). Nudging around the world (Research Report Series). Retrieved from the Rotman School of Management, University of Toronto: (link).
Obama, B. (2015). Executive order — Using behavioral science insights to better serve the American people (Executive Order 13707). Washington, DC: The White House. Retrieved from the White House: (link).
Organisation for Economic Co-operation and Development (OECD). (2011a). Voting. In Society at a Glance 2011: OECD Social Indicators. Paris, FR: OECD Publishing.
Organisation for Economic Co-operation and Development (2011b). Confidence in social institutions. In Society at a Glance 2011: OECD Social Indicators. Paris, FR: OECD Publishing.
Social and Behavioral Sciences Team (2015). Social and behavioral sciences team 2015 annual report. Washington, DC: National Science and Technology Council, Executive Office of the President. Retrieved from the Social and Behavioral Sciences Team: https://sbst.gov/assets/files/2015-annual-report.pdf.
Sunstein, C. R. (2016a). The council of psychological advisers. Annual Review of Psychology, 67, 713–737.
Sunstein, C. R. (2016b). Fifty shades of manipulation. Journal of Marketing Behavior, 1(3–4), 213–244.
Sunstein, C. R. (in press a). Do people like nudges? Administrative Law Review.
Sunstein, C. R. (in press b). The ethics of influence: Government in the age of behavioral science. New York, NY: Cambridge University Press.
Sunstein, C. R. (in press c). People prefer system 2 nudges (kind of). Duke Law Journal, 66.
Tannenbaum, D., Fox, C. R., & Rogers, T. (2015). On the misplaced politics of behavioral policy interventions. Working Paper, University of Chicago. (link).
Thaler, R. H., & Sunstein, C. R. (2008). Nudge: Improving decisions about health, wealth, and happiness. New Haven, CT: Yale University Press.
The Behavioural Insights Team (2015). The behavioural insights team update report 2013–2015. London, UK: Behavioural Insights Ltd., in partnership with the UK Cabinet Office. Retrieved from The Behavioral Insights Team: (link).
Thøgersen, J. (in press). A European survey concerning sustainability lifestyles and user sustainability innovation framework (EU-InnovatE Working Paper). Aarhus, DK: Aarhus University Press.
Whitehead, M., Jones, R., Howell, R., Lilley, R., & Pykett, J. (2014). (2014). Nudging all over the world: Assessing the global impact of the behavioural sciences on public policy. Economic Social & Research Council Report. Swindon, UK.
Table A1: Overview of political parties in the six countries.
Table A2: Clusters of the political parties in the surveyed countries.
Stelle
Lega Nord
Fratelli d’Italia
Others
Plaid Cymru (Wales)
UK Independence
Others
Union des démocrates et indépendants
Radical, républicain, démocrate et progressiste
Gauche démocrate et républicaine
Others
Die Linke
AfD
Freie Wähler
Others
Demokratikus Koalíció (DK)
Együtt 2014
Párbeszéd Magyarországért (PM)
Others
Enhedslisten
Socialistisk Folkeparti
Liberal Alliance
Det Radikale Venstre (social-liberal)
OthersNote: reflects the political spectrum in 2015 for national elections.
Copyright: © 2016. The authors license this article under the terms of the Creative Commons Attribution 3.0 License.
This document was translated from LATEX by HEVEA.