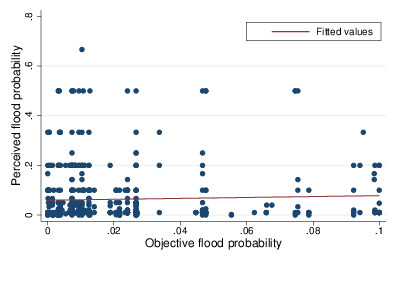
| Figure 1: Scatter plot of the combinations of the perceived flood probability and objective probability. |
Judgment and Decision Making, Vol. 10, No. 4, July 2015, pp. 365–385
Divergence between individual perceptions and objective indicators of tail risks: Evidence from floodplain residents in New York CityW. J. Wouter Botzen* Howard Kunreuther# Erwann Michel-Kerjan$ |
This study provides the first comprehensive analysis of individual perceptions of tail risks. It focuses not only on the probability, as has been studied by Nicholas Barberis and others, but also on anticipation of damage. We examine how those perceptions relate to experts’ estimates and publicly available risk information. Behavioural factors—availability bias, threshold models of choice, worry and trust—are found to have a significant impact on risk perceptions. The probability of tail events is overestimated, which is consistent with probability weighting in prospect theory. Potential damage is underestimated, one reason why individuals do not invest in protective measures.
Keywords: tail risk perceptions, bounded rationality, expected utility
theory, intuitive thinking, low-probability/high-consequence risks, risk
communication, threshold model.
There is a growing interest among researchers and policy makers on behaviour with respect to low-probability/high-consequence (LP-HC) events, or tail events, given the recent spate of catastrophes that include financial crises, terrorist attacks, pandemics, technological accidents and natural disasters and the recent popularization of the topic in best-selling books (e.g., Taleb, 2007). Individuals are often unprepared for such events due to systematic biases and use of simplified decision rules, rather than undertaking systematic analyses in determining whether or not to take on protective measures (Kunreuther, Pauly & McMorrow, 2013). It is also well known that laypersons’ perceptions of the risk often deviate significantly from experts’ risk judgments (Slovic, 1987, 2000; Slovic & Weber, 2015).
Earlier research on tail events analysed how individuals’ beliefs about the likelihood of such events differ from experts’ assessments. A general finding from the literature is that people tend to overestimate the probability of rare events. Mortality risk—an extreme case of a tail event for an individual—highlights this point: people significantly overestimate the frequency of rare causes of death (Lichtenstein et al., 1978). Recently the theoretical and empirical literature has focused more on whether individual decisions are consistent with the probability-weighting function of prospect theory, with mixed results (for instance, see Tversky & Kahneman, 1992; Bordalo, Gennaioli & Shleifer, 2012; Fehr-Duda & Epper, 2012; Barberis, 2013b; Barseghyan et al., 2013a,b; Carman & Kooreman, 2014).
What is absent in this literature is how people estimate the outcome associated with such tail events before making their decisions, except for research on medical decisions where several studies showed that perceived disease severity is related to whether or not a person wants to be vaccinated (Brewer et al., 2007). Surprisingly there have been very few studies on individuals’ perception (or belief) of what the monetary losses would be if a negative outcome occurred (Erev, Glozman & Hertwig, 2008). Recently, Barberis (2013a) provided a comprehensive literature review highlighting the absence of research on how a person’s estimate of the probability of a disaster and the resulting damage deviate from expert assessments. This paper focuses on both components of the risk and examines what factors cause laypersons’ estimates to deviate from those of the experts. We use flood risk in New York City as our case of a tail event. We believe this to be the first empirical analysis in the literature examining this question.
Our finding that individuals typically underestimate the loss they will suffer from such events is important. It means that many people might decide not to prepare for disasters, not solely as a result of a probability weighting process aligned with their preferences, but also because they make a mistake in their loss estimate. This distinction between individual perceptions of risk (loss and probability) and weighting of probability in decisions is key (Barberis, 2013b).
Expected utility theory (EUT), the dominant normative economic model of individual decision making (von Neumann & Morgenstern, 1947; Savage, 1954), has been used as a benchmark for comparing behaviour under risk and uncertainty. EUT uses formal algorithms and risk assessments to determine an optimal course of action. Empirical data reveal that individuals often behave in ways that deviate from this model, possibly as a result of intuitive thinking (Conlisk, 1996; Starmer, 2000; Kahneman, 2003; Slovic et al., 2004).1 Intuitive thinking can be characterized as fast and automatic, and is guided by past experience and emotional reactions. Individuals are likely to make errors in risk judgments for low-probability/high-consequence events.
Intuitive thinking can be related to systematic biases such as availability where individuals judge events as high risk if they find it easy to imagine or recall, often because of past experience or media attention (Tversky & Kahneman, 1973; Viscusi & Hamilton, 1999). Moreover, emotions or feelings with respect to risk such as fear, anxiety, or worry have been found to be related to individual judgments and decision making under risk (see Finucane et al., 2000; Baron et al., 2000, Loewenstein et al., 2001; Weinstein et al., 2007).
The objective of our study is to improve the understanding of how individual perceptions of low-probability/high-consequence risks are shaped, in order to provide insights for improving risk management policy. In particular, we examine how individual perceptions of the likelihood of flooding and resulting damage relate to risk assessments, and how these perceptions are related to emotionally driven variables (stemming from intuitive thinking) and perhaps modified by more deliberative thinking.
We use New York City (NYC) as a case study as it was affected by flooding from Hurricane Irene in 2011 and again in 2012 by Hurricane Sandy. The latter flooding caused 43 deaths and about $19 billion of damage to the city alone (NYC, 2013). Only 20 percent of NYC households in the area inundated by Sandy had flood insurance at the time of the disaster (NYC, 2013). Their decision not to purchase coverage may be due to their misperception of the probability and/or damage of flooding from hurricanes.
A challenge in an in-depth comparison of perceived and objective risks is how to obtain estimates of flood damage and probability at an individual level. We address this issue by utilizing detailed probabilistic flood risk estimates for NYC at a census block level based on 549 storm surge simulations that we built in a companion paper (Aerts et al., 2014). Since these risk assessments are currently not available to the general public, we also use Geographical Information System (GIS) analyses of individual locations to derive how flood risk perceptions relate to official flood maps in NYC developed by the U.S. Federal Emergency Management Agency (FEMA). Those living in NYC can determine in what FEMA flood zone they reside using the FEMA website.
To complement expert estimates and FEMA maps we collected risk perception data via a detailed survey in 2013 of more than 1,000 homeowners who all live in flood-prone areas in NYC. Based on the survey data, we estimate how individual risk perceptions relate to risk indicators by experts by examining the degree to which people over- or underestimate the likelihood of being flooded and the resulting damage, and the factors that appear to drive their risk perceptions.
We estimate statistical models of (a) individuals’ awareness of living in a flood-prone area, (b) their percieved flood probability, and (c) their percieved flood damage. We find that these three risk perception variables are only weakly related to expert risk assessments and publicly available FEMA flood zone categorization. Expanding these models reveals that variables characterized by intuitive thinking have a significant impact on characterizing risk perception. In particular our indicators of flood risk perceptions are related to the availability bias, threshold models of choice, worry and trust. A detailed comparison of the perceived flood probability, damage and flood risk defined as (probability × damage) with expert assessments shows that a minority of individuals have accurate perceptions of their flood probability, damage and risk. We find that most people overestimate probability and underestimate damage. Overestimation of the flood probability is triggered by the aforementioned variables that characterize intuitive thinking, namely past flood experience, high worry, and perception of the probability falling above a threshold level of concern. Underestimation of flood damage is related to experiencing low levels of flood damage in the past, low worry about the danger of a flood to their home, perception of the flood probability falling below a threshold level of concern, and high trust in local flood risk management capability.
We discuss several policy implications to assist individuals in their risk assessments and suggest how they can better prepare for disasters. Risk communication can be improved by lengthening the time frame in which probabilities are presented to make these more salient. Moreover, government risk communication should focus on the likelihood of a disaster as well as more detailed information about potential damages. Enforcing stricter purchase requirements for flood insurance coupled with well-enforced land-use regulations and building codes could avoid large public-sector expenditures following flood events.
The remainder of this paper is structured as follows. Section 2 provides a review of the literature on individual flood risk perceptions that provides a basis for the hypotheses to be tested. Section 3 describes the research methodology. Section 4 presents the results, which are discussed in Section 5. Section 6 provides policy recommendations and concludes.
This section discusses several drivers expected to shape individual flood risk perceptions based on existing literature, which form the rationale for the hypotheses we will test.
Little research has been conducted on how objective estimates of flood risk relate to flood and hurricane risk perceptions of individuals. Siegrist and Gutscher (2006) analyse how 1,306 Swiss households’ flood risk perceptions relate to the riskiness of the households’ location derived from flood maps that characterize four flood hazard zones and the likelihood of flooding in each region. Flood risk perceptions were elicited using a qualitative estimate of the perceived flood probability with answer categories that range from very low to high. Household perceptions of the flood probability were significantly correlated with the categorization of the risk on the flood hazard maps. Nevertheless, many residents of high flood hazard areas report low perceived flood probabilities, and many residents of areas with no flood hazard have a high perceived flood probability.
Ruin, Gaillard and Lutoff (2007) conducted interviews of 200 French households to examine how perceptions of flash floods occurring at certain road sections relate to geographical maps indicating whether or not these sections were prone to flash flooding. They found that drivers were more likely to under- than overestimate the risk of flash floods.
While the previous studies examined qualitative indicators of perceived flood risk, Brilly and Polic (2005) study perceptions of flood probability of 365 survey respondents in a town in Slovenia. Answers to an open-ended question asking for the perceived flood probability were lower in an area safe to flooding than in a more flood-prone area. Similarly, Botzen, Aerts and van den Bergh (2009) estimate how quantitative variables of the perceived flood probability and damage of about 1,000 households in the Netherlands relate to geographical indicators of objective flood risk. They find that individuals who live in the vicinity of a main river and in low-lying areas generally have higher perceptions of the flood probability and damage. Nevertheless, the Netherlands study shows that individuals may be insufficiently aware of the flood protection infrastructure that is in place, since perceptions of the flood probability and damage are lower in areas near rivers that are not well protected by dikes. The expert estimates of the flood risk are available to the public there, but apparently few people have obtained and studied these data.
While the aforementioned existing studies examine how indicators of perceived risks correlate with relevant geographical characteristics, we provide a more in-depth comparison of quantitative estimates of perceived and objective probability, and damage estimates, as a function of the location of the property. Existing studies found that, even though individuals have difficulties assessing their flood risk, statistically significant relations were observed between individual flood risk perceptions and geographical indicators of the flood risk. We thus hypothesize that individuals’ awareness of living in a flood-prone area in NYC and their perceptions of the flood probability and damage are positively, but weakly, related to objective estimates of flood risks (H1).
Unlike some risk assessment indicators in previous studies (Siegrist & Gutscher, 2006; Botzen, Aerts & van den Bergh, 2009), our estimates of flood risk obtained from the flood risk model are not publicly available and have not been communicated to our sample of households. In this case the perceived flood probability may be more closely related to the flood probabilities shown on publicly available FEMA maps. This does not mean that respondents actually looked at these maps; however, homeowners with a mortgage from a federally-backed lending institution are required to purchase flood insurance if they live in the FEMA 1/100 year flood zone and these respondents therefore should be aware that they are located in a flood hazard area. We thus hypothesize that FEMA flood maps will be more closely related to perceived risk than the estimates from the flood risk model (H2).
The literature on decision-making suggests that individuals underestimate the likelihood of a low-probability event if they have not experienced it (Hertwig et al., 2004; Fox & Hadar, 2006) and overestimate its likelihood if they have experienced the event (Brilly & Polic, 2005; Ruin, Gaillard & Lutoff, 2007; Siegrist & Gutscher, 2006; Viscusi & Zeckhauser, 2006). This behaviour can be explained by an availability bias as shown by Tversky and Kahneman (1973; 1974).2 For example, individuals who have recently experienced a flood may find it easier to imagine that a flood will occur again in the future and, therefore, perceive its likelihood as higher than individuals without flood experience. An opposite effect could occur if people are subject to the gambler’s fallacy, assuming that if a flood just occurred it will not happen soon again (Camerer & Kunreuther, 1989). To our knowledge there are no formal empirical studies revealing this behaviour by individuals. Given the recent destruction that Hurricane Sandy caused in NYC, we expect that the effect of availability bias explains people’s risk perception and hypothesize that flood experience has a strong positive impact on flood awareness and perceptions of the flood probability and damage (H3).
Individuals may ignore risks whose subjective odds are perceived to be below their threshold level of concern (Slovic et al., 1977, 1982; McClelland, Schulze & Coursey, 1993). To our knowledge no one has investigated this behaviour using field data. In the case of flooding, we hypothesize that individual flood risk awareness and perceptions of the flood probability and damage are significantly lower if individuals think that their flood probability is below their threshold level of concern, and the person will not be interested in acquiring information about flood risks (H4).
Affective feelings toward risk, such as worry, may also affect decision making under risk, as has been argued by Loewenstein et al. (2001) and Slovic (2010). We hypothesize that high degrees of worry about flooding are related to higher levels of flood risk awareness and high perceptions of the flood probability and damage (H5).
Slovic (2000) highlights the importance of trust in shaping individual risk perceptions by summarizing the extensive empirical research that he and his colleagues have undertaken on this topic. An interesting example is the fierce resistance of residents in the United States against locating hazardous facilities, such as nuclear waste repositories, in their neighbourhood. Survey research by Slovic, Layman and Flynn (1991) shows that individuals perceive the risk of hazardous facilities to be high if they distrust the ability of U.S. government agencies to adequately manage these risks. Similar effects of trust have been found on individual flood risk perceptions by Terpstra (2011), who points out that individual flood risk perceptions are based on their degree of trust in the responsible risk managers when people lack knowledge about a hazard. He provides evidence that individuals who trust local government’s risk management capability feel comfortable living in a floodplain without undertaking protective measures, because they believe that they have a low likelihood of flooding. We measure trust as the ability of NYC officials to limit flood impacts on houses through building code and zoning regulations. We hypothesize that individuals with a high level of trust in local flood risk management capability have lower perceptions of the flood damage (H6).
Table 1: Summary of hypotheses
# H1 H2 H3 H4 H5 H6 H7
Several studies have found that perceptions of risks by laypersons can substantially diverge from expert assessments of risk for a wide variety of hazards (Rowe & Wright, 2001; Siegrist & Gutscher, 2006 for literature reviews). None of these studies provides a comprehensive analysis of such divergences of quantitative estimates of both probability and damage. This is true for flood risk as well (Kellens, Terpstra & De Maeyer, 2013). In general, individuals have difficulties with assessing low-probability/high-consequence risks (Barberis, 2013a; Carman & Kooreman, 2014) and several studies show that this also applies to natural disasters (e.g., Kunreuther, Novemsky & Kahneman, 2001). We thus expect that few of our respondents have correct perceptions of the flood probability, flood damage and expected flood risks. We hypothesize that (under-) overestimation of the flood probability and damage is related to (no) past flood experience, individuals perceiving the likelihood of a flood to be (below) above their threshold level of concern, (low) high worry about flooding, and (high) low trust in the government to address the flood issue (H7). The seven hypotheses are summarized in Table 1.
We selected New York City (NYC) as a case study for several reasons. First, it is one of the world’s largest coastal megacities with close to 10 million people. Second, flooding is a major problem in NYC as reflected by the threat of Hurricane Irene in 2011 and severe flood damage by Hurricane Sandy in 2012. Third, due to its location on the Atlantic Ocean and its topography, NYC is concerned about the possible impact of sea level rise and stronger storm surge on potential damage in the coming decades if adaptation measures are not undertaken. These combined factors have led city and state governments to focus on improving flood risk awareness to encourage residents in the floodplain to undertake protective measures today so as to be adequately protected financially against future flood-related losses (NYC, 2013).
Indicators of flood risk faced by the respondents have been derived from a probabilistic flood risk model developed for NYC. A detailed description of this model and all flood modelling results can be found in Aerts et al. (2014, including online material). Our flood risk model uses a large set of 549 simulated hurricanes from a coupled hurricane-hydrodynamic model (Lin et al., 2012) to derive flood inundation maps with different return periods for NYC, integrating storm surge. The model calculates flood damage based on the so called HAZUS-MH4 methodology (HAZUS stands for Hazards United States) using a typical approach of depth-damage curves, which represent the fraction of damage to a building and its content based on the flood water level present in the census block (Aerts et al., 2014).
The generic HAZUS model has been fine-tuned using specific building type information provided by the NYC Office of Emergency Management. Inundation depths, their probability of occurrence, flood damage and flood risk are calculated for individual census blocks. One can then determine the probability that the property of each survey respondent will experience inundation from a flood in a given year. The potential inundation level from a flood (i.e., the potential height of the floodwaters at a respondent’s location) is an important indicator of flood severity. The many storm simulations generated by the flood risk model allow for the derivation of a distribution of water levels for each respondent’s property from which the maximum inundation is used as an explanatory variable in our regression models of risk perceptions.
An indicator of flood damage was calculated for each respondent based on the median inundation level at the respondent’s location that is input to the HAZUS depth-damage function for each specific building category. Combining the output of the depth damage function with the property value of the respondent provides an estimate of the expected total annual damage from a flood. This figure will be compared with the respondent’s perceived expected flood damage.
Table 2 shows the average values of the key variables from the flood risk model by the publicly available FEMA flood zone classification. FEMA states that inundation in the 1/100 year flood zone has a chance that is equal to, or higher than, 1 percent (or 0.01), this chance is 0.2 percent in the 1/500 year flood zone, and lower than that in the X zone. However, several flood risk modelling studies have revealed that these FEMA maps are often outdated and incorrect, and that large variations of flood risk exist within FEMA flood zones, as Aerts et al. (2013) show for NYC. FEMA does not provide any information on the potential severity of flooding per flood zone, meaning that the relationship between the FEMA maps and anticipated flood damage may not be strong. Table 2 shows that maximum inundation depths are higher in the 1/100 FEMA flood zone than the 1/500 FEMA flood zone, because the former are generally lower lying lands closer to the water. As a consequence, percentages of building and contents values lost are slightly higher if a flood would occur in the high risk flood zones. Although average flood model probabilities of the property of our respondents are higher than the FEMA map probabilities for the 1/100 and 1/500 year zones as shown in Table 2 they are in the expected direction.
Table 2: Key variables (average) from the flood damage model classified by FEMA flood zone.
X zone
The flood risk perception questions are part of a larger survey about flood experiences and flood preparedness of homeowners in flood-prone areas in NYC. We designed the survey before Hurricane Sandy flooded parts of NYC on 29 October 2012, and we planned to implement it by the end of that year. Because of the destruction that Sandy caused in NYC floodplains, the implementation of the survey was postponed until six months after the storm.
The questions used to elicit flood risk perceptions were designed along the four main variables that a review of 57 studies on flood risk perceptions by Kellens et al. (2013) identified as risk perception indicators: awareness, affect (worry), likelihood and impact (see Appendix A for the full list of survey questions). Flood risk awareness is measured using two questions. The first relates to current flood risk and asks whether the respondent thinks (or is certain about) whether s/he does, or does not live, in a flood-prone area. The second question relates to awareness about the influence of climate change on future flood risk and asks whether climate change will increase, decrease or have no impact on the risk of the respondent’s home flooding. We also ask respondents to indicate the degree to which s/he agrees or disagrees with a statement that s/he is worried about the danger of a flood at her/his current residence.
Eliciting a quantitative estimate of the perceived flood probability is a challenge because individuals have, in general, difficulties with probabilistic concepts (e.g., Alberini et al., 2004; Goldstein & Rothschild, 2014). Based on studies that examined the performance of scales or questions used to obtain perceived probabilities (See Appendix A), we adopted an elicitation format for the likelihood of flooding that provides respondents with an anchor point of the 1-in-100 annual flood probability; this is how FEMA delineates high flood risk areas (also called Special Flood Hazard Areas).
We asked respondents whether they think that a flood at their home will occur on average, as often, more, or less often than 1-in-100 years. Respondents who respond by indicating that they expect a flood to occur more often than 1-in-100 are asked a follow-up question as to whether they expect a flood to occur more or less often than with a 1-in-10 frequency; respondents who expect that a flood will occur less often receive a follow up question that asks whether they expect a flood to occur more or less often than with a frequency of 1-in-1,000. This question format enables us to locate the respondent’s perceived flood probability on a logarithmic scale with end points of 1/10 (or higher) and 1/1,000 (or lower). Next, the interviewer explains to the respondent where on this scale the respondent is located (e.g., between 1/10 and 1/100 years) and asks her/him to provide a best estimate of the flood frequency (on average once in X years).
Next, respondents are asked whether they think that the flood probability is too low to be concerned about it, that is, whether it is below their threshold level of concern. The final risk perception question asks respondents to give a monetary estimate of the costs of repairing their home and contents in case their home would flood. We then asked a question that elicits the degree of trust in NYC flood risk management (see Appendix A).
A question was asked how often the respondent had previously been affected by floods caused by natural disasters. If the respondent responded that s/he had been affected at least once, a follow-up question elicited, for the most recent flood in NYC s/he experienced, the total costs of flood damage to the respondent’s residence and contents. The questionnaire concluded with socio-demographic questions. The survey was pre-tested before it was finally implemented by phone. The sample consists of homeowners in NYC floodplains with a ground floor. The survey’s response rate was 73 percent. See Appendix A for a description of our survey approach.
To test the hypotheses summarized in Table 1, we estimate four different models for the dependent variable of risk perception (y), which is either (a) individual’s awareness of living in a flood-prone area, (b) the perceived flood probability, or (c) the perceived flood damage. An ordered probit model is employed for the ordinal variable of awareness of living in a flood-prone area, and OLS regression models are used for variables of the perceived flood probability and expected flood loss.
Model I includes only the objective flood risk indicators (r) as explanatory variables (i.e., generated by the flood catastrophe model by experts) to test H1. Model II combines both catastrophe model results and the publicly available risk information from FEMA maps (p) to test H2. We define here the variables included in Models I and II as deliberative (System 2) factors: they examine how risk perceptions are influenced by objective and publicly available information about risk. Model III adds to the previous model the variables which we define here as intuitive (System 1) factors (h), including flood experience which is related to the availability bias to test H3, a variable representing individuals who think that the flood probability is below her/his threshold level of concern to test H4, and worry about flooding to test H5. Model III hence includes both intuitive and deliberative thinking. It should be noted that our estimated relations do not necessarily imply causality. For example, a positive coefficient for the variable worry may mean that concern about flooding increases individual assessments of probability and damage, while it can also be due to high perceptions of flood probability and damage leading a person to worry about flooding. Model IV includes the significant variables identified by the previous models as well as socio-demographic characteristics (x) that are statistically significant. In other words, Model IV includes only statistically significant variables and can be interpreted as the best explaining model.
Formally,
| y = |
| + ε | ||||||||||||||||||||||||||||||||||||||||||||||||||||||||||||||||||||||||||||||
Appendix B provides a description of the variables and how we coded them. Categorical explanatory variables are coded as dummy variables.
In this section we present the descriptive statistics of answers to questions that elicited flood risk perceptions in the survey and the results of the statistical models of the factors of influence on these perceptions. These statistical models test our hypotheses as just described. The model results are first presented in this section, first for general flood risk awareness, then for quantitative perceptions of the likelihood and impact of flooding—the two variables influencing flood preparedness decisions according to expected utility theory. A more detailed analysis of the accuracy of perceptions of the flood probability and damage is presented in Section 4.2. The general findings for each hypothesis are discussed in Section 5.1.
Table 3: Ordered probit model results (unstandardized coefficients) of the degree of individual awareness of living in a flood-prone area.
Maximum inundation 0.0541^** 0.0399^* 0.0265 n.s. Flood probability -0.9228 -1.2841 -0.1715 n.s. FEMA 1/100 n.a. 0.2862^* 0.1802 0.2105^** FEMA 1/500 n.a. 0.0717 -0.0198 n.s. Experienced flooding n.a. n.a. 0.2058^** 0.1950^* Below threshold of concern n.a. n.a. -0.3047^** -0.3212^*** Worry about flooding n.a. n.a. 0.4406^*** 0.4897^*** High worry about flooding n.a. n.a. 0.7636^*** 0.7725^*** Female n.a. n.a. n.a. 0.2035^** Age n.a. n.a. n.a. 0.0082^** Income n.a. n.a. n.a. 0.0027^** Chi-square 8.49^** 15.48^*** 90.17^*** 80.79^*** N 1007 1007 949 709 Notes: *, **, *** indicates significance at the 10%, 5%, and 1% level, respectively. n.a. stands for not applicable and n.s. stands for not significant.
Most respondents are aware that they live in an area that can be flooded. Only 3 percent of the respondents did not know whether they live in a flood-prone area. 74 percent are certain that they live in a flood-prone area and 12 percent think that they live in a flood-prone area. Only 7 percent and 4 percent, respectively, think that they do not live in a flood-prone area or are certain about this. All homeowners in this group—consisting of 11 percent (N=110) of the survey participants—were flooded at least once during the 549 storm simulations in our flood risk model. This shows that these respondents are unaware of the flood risk that they face. Of these 110 respondents, 44 and 48 live in the FEMA 1/100 and 1/500 year flood zones respectively. These respondents could have known that they reside in a flood-prone area since this information is publicly available. Individuals who are certain that they do not live in a flood-prone area have on average a perceived flood probability that is about three times lower than individuals who are certain that they live in a flood prone area (significant at the 1 percent level).3
To assess awareness of future flooding, a question elicited individual expectations of the effects of climate change on the risk of their home flooding. Among all respondents, 59 percent answered that they expected climate change to increase the risk of flooding,4 16 percent believe that climate change will have no impact, and 2 percent do not believe in climate change. 21 percent were not sure and 1 percent of the respondents believe that climate change will decrease flood risk. Even though the majority of respondents have expectations in line with the general scientific consensus that climate change will increase future flood risk in NYC, it is noteworthy that this is not the case for 41 percent of the people surveyed. Weber and Stern (2011) discuss several insights from psychology that can explain why scientists’ and the general public’s understandings of climate change differ.
Table 3 presents results of ordered probit models of the individual degree of flood risk awareness. These models include a (ordinal) dependent variable reflecting the degree of awareness coded from 1=respondent is certain that s/he does not live in a flood-prone area to 4=respondent is certain that s/he lives in a flood-prone area. Model I shows that awareness of flood risk is partly related to objective risk indicators in that it is positively and significantly related to the maximum flood inundation level providing some support for H1. Model II shows that respondents in the 1/100 year flood zone have a higher awareness of living in a flood-prone area than respondents in FEMA X zones, but this effect is insignificant for homeowners in the 1/500 year flood zone.5
Model III shows that flood experience6 has additional explanatory power, providing confirming evidence for H3. Moreover, there appears to be a threshold model effect (H4) in that individuals who state that their flood probability is below their threshold level of concern (true for 28 percent of the total respondents) have lower flood risk awareness.7 H5 is confirmed since flood risk awareness is positively associated with high worry about flooding.8 In fact, 3 out of 4 respondents agree or very strongly agree with the statement: “I am worried about the danger of a flood at my current residence.”9 Expert risk information becomes insignificant in Model III meaning that the initial support found for H1 was confounded with flood experience. The FEMA 1/100 flood zone classification does influence awareness significantly in the best model with socioeconomic variables, providing support for H2. Model IV shows that awareness relates positively to age, income and being female. The education level of the respondent (not shown in Table 3) was statistically insignificant with respect to flood awareness.10
Table 4: Perceptions of living in the 1/100 year flood zone in relation to the FEMA flood zone in which the respondent lives.
Perceived flood probability
X zone
The perceived flood probability is elicited using a series of related questions. First, respondents are asked whether they think that a flood at their home will occur as often as 1 in 100 years, more often, or less often. Most respondents (46 percent) answered that they thought that a flood would occur more often, 26 percent that a flood would occur as often, and 17 percent expected that a flood would occur less often than 1/100 years, while the remaining 12 percent of respondents were not sure.
Table 4 shows that these answers hardly differ by FEMA flood zone in which the respondent resides. This is an important finding as it suggests that the official probabilities that FEMA uses to categorize flood zones have very little influence on perceptions of the flood probability by floodplain inhabitants. For example, 44 and 49 percent of the respondents in the FEMA 1/500 and X zone, respectively, think that their flood probability is higher than 1/100, while FEMA flood maps classify these same people as facing a flood probability of 1/500 or lower. The high perceived likelihood of flooding may be partially explained by the fact that about 70 percent of the respondents experienced flood damage from Hurricane Sandy. Moreover, on average, the objective flood probability in the 1/500 year flood zone is higher than FEMA indicates (Table 2).
Table 5: Regression results (unstandardized coefficients) of models of the (ln) perceived flood probability.
-2.6115^*** -2.7077^*** -2.7603^*** -1.5323^** -0.3154^** -0.3298^** -0.4116^*** -0.4172^*** 0.1165^** 0.1097^* 0.1409^** 0.1259^** n.a. 0.1131 0.1154 n.s. n.a. 0.0830 0.1318 n.s. n.a. n.a. 0.0943^*** 0.0659^* n.a. n.a. -0.2223^* -0.2551^* n.a. n.a. 0.2555^* n.s. n.a. n.a. 0.4938^*** 0.4558^*** n.a. n.a. n.a. -0.2705^** n.a. n.a. n.a. -0.2257^** n.a. n.a. n.a. 0.3079^** 0.01 0.005 0.04 0.06 3.16^** 1.65 3.88^*** 4.37^*** 538 538 506 394 Notes: *, **, *** indicates significance at the 10%, 5%, and 1% level, respectively. n.a. stands for not applicable and n.s. stands for not significant.
Figure 1: Scatter plot of the combinations of the perceived flood probability and objective probability.
Two follow-up questions provided more detailed insights into the perceived flood probability. First, the respondents who expect that their flood probability is higher than 1/100 were asked whether they think that a flood occurs more, or less, often than 1 in 10 years, with 54 percent answering that the flood probability is higher than 1/10 and 33 percent perceiving it to be lower. The perceived high probability of future flooding by a majority of this group of respondents is likely due to the impact of Hurricane Sandy on risk perceptions. The homeowners who expect their flood probability to be lower than 1/100 were asked whether they think that a flood occurs more, or less, often than 1 in 1,000 years, with 45 percent answering that the flood probability it is higher than 1/1,000 and 34 percent responding that it is lower. This latter group can be characterized as having an extremely low perception of flood probability.
We then asked respondents to provide their best estimate of how often they think a flood occurs at their home (once every X years). On average, respondents answered that a flood occurs once in 72 years. The average flood probability of the respondents according to the objective risk model is about once in 50 years, a figure that is reasonably close to the average perceived flood probability. Using the FEMA flood zone in which respondents live, the average return period is once in 65 years for those in the FEMA 1/100 year flood zone, once in 78 years for homeowners in the FEMA 1/500 year flood zone, and once in 84 years in homeowners in the FEMA X flood zone. These average estimates are in the expected direction but significantly higher than FEMA’s estimates. Using the estimated return period of each homeowner to derive a distribution of probability estimates,11 Figure 1 clearly shows that the relationship between this perceived flood probability and the objective flood probability each respondent faces is actually very weak. It should be realized that the scale of the axes in Figure 1 differ because while the perceived flood probability differs widely and ranges between 0 and about 0.7, the objective flood probability is never higher than 0.1.
As in Baron et al. (2000), the natural logarithm of the perceived flood probability serves as the dependent variable in the regression models reported in Table 5. Model I shows that the perceived flood probability is positively related to the probability estimate from the flood model. The coefficient of the flood probability shows that a 1 percent higher flood model probability is translated into a higher perceived flood probability of about 0.1 percent, suggesting that this relation is not very strong and providing support for H1. The perceived flood probability is negatively related to the maximum inundation level, which may be because high inundation levels signify severe flood conditions that are unlikely to occur.
The overall explanatory power of the model is very low (as is reflected by the adjusted-R2), which means that a large variance in the perceived flood probability remains unexplained. This result is not surprising given that the results of the probabilistic flood risk model developed for NYC are not known to the public. However, Model II shows that the FEMA public flood risk information does not significantly influence the perceived flood probability. In fact, including these variables reduces the model fit indicating that H2 does not hold.
Table 6: Regressions results (unstandardized coefficients) of the (ln) of anticipated flood damage by respondents.
0.3027^*** 0.3030^*** 0.2402^*** 0.2330^*** -0.0623^** -0.0847^** -0.1270^*** -0.0989^*** n.a. 0.1910 0.0935 n.s. n.a. 0.0251 -0.0499 n.s. n.a. n.a. -1.0329 n.s.
ln model flood damagen.a. n.a. 0.3154^*** 0.2432^*** n.a. n.a. 0.2504^*** 0.2719^*** n.a. n.a. -0.1849^** -0.1634^* n.a. n.a. 0.2776^*** 0.2602^** n.a. n.a. 0.2948^*** 0.2726^** n.a. n.a. -0.2564^* -0.3184^** n.a. n.a. n.a. -0.7669^*** n.a. n.a. n.a. 0.2227^*** 7.3586^*** 7.1349^*** 4.9449^*** 4.0508^*** 0.06 0.06 0.15 0.19 22.38^*** 12.17^*** 11.95^*** 14.66^*** 732 729 681 566 Notes: *, **, *** indicates significance at the 10%, 5%, and 1% level, respectively. n.a. stands for not applicable and n.s. stands for not significant.
Model III in Table 5 shows that the perceived flood probability is positively influenced by the number of times the respondent was flooded in the past, which supports H3 about the availability heuristic.12 The perceived flood probability is almost significantly lower if individuals think that the probability is below her/his level of concern, providing some support for H4. Moreover, the perceived flood probability relates positively with worry, which confirms H5. Model IV shows that it is mainly high worry that is related with the perceived flood probability since the (lower) worry variable becomes insignificant. The coefficient of high worry shows that this variable has a large effect; perceptions of the flood probability are about 45 percent higher among this group (Table 5).
Adding socio-demographic variables in Model IV reveals that the perceived flood probability is lower for females and households with a high income, while having a college major in math, science or technology fields is related with a higher perceived flood probability. The latter effect is interesting since we found that overall the respondent’s education level is not statistically significant.13 This result suggests that it is necessary to test for specific education that may help the respondents better understand risk and probability, not just general education level as is typically done. Age was insignificant and, therefore, not included in Model IV.
An indicator of perceived flood damage is the cost to repair a victim’s home and contents if they suffered damage from a flood. The median answer is $72,000.14 Normalizing the anticipated flood damage by the respondent’s house value results in a median of 0.16.
Figure 2: Scatter plot of the combinations of perceived flood damage and objective flood damage. 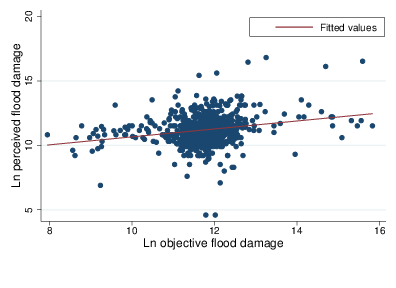
Table 6 shows the results of OLS regressions models of the natural logarithm of anticipated flood damage. Model I shows that anticipated flood damage relates significantly and positively with the logarithm of flood damage predicted by the flood risk model. A higher objective flood damage of 1 percent is related with a 0.3 percent higher perceived flood damage, which supports H1.15 Figure 2 shows a scatter plot of the relation between these variables, which is much stronger than the relation between the perceived and objective flood probability that was shown in Figure 1. The coefficient of the logarithm of the flood probability is negative and significant; areas with a high flood probability are frequently flooded but generally experience low water levels which could explain the negative sign. Model II shows that the FEMA flood zones are insignificant, meaning that H2 is not supported here.
The variables characterizing flood experience are statistically significant in Model III. Perceived flood damage by respondents who experienced flood losses in the past is significantly related to the past level of damages, thus supporting H3. Interestingly, the dummy variable for respondents who never experienced flood damage is insignificant, but its interaction with objective flood damage is positive and significant. These results suggest that respondents who have not experienced flood damage are better able to estimate flood damage than respondents who have experienced flood damage and base their perceptions on past damage. To illustrate this point, the regression coefficients of ln flood damage indicates that a 1 percent increase in objective flood damage for the inexperienced flood group implies higher perceived flood damage of about 0.5 percent and 0.25 percent increased perceived flood damage for the experienced flood group.
Perceived flood damage has a negative relationship to the variable characterizing individuals who consider the flood probability to be below their threshold level of concern (H4) and a positive relationship to worry (H5). Anticipated flood damage is negatively related to a high trust in flood risk management by NYC that supports H6. In addition, Model IV shows that having a low education level has a negative significant effect on perceived flood damage, while (the logarithm of) income influences perceived damage positively. Age and gender appear to be statistically insignificant.16
Although the regression models in Section 4.1 reveal statistically significant relationships between the perceived and flood model probability (Table 5) and perceived and flood model damage (Table 6) they explain only a small variance of these perceptions. It is, therefore, of interest to examine in more detail the accuracy of individual perceptions of the flood probability and flood damage. To do this we compare individual perceptions of the flood probability, flood damage, and expected flood risk (constructed as perceived flood probability × perceived flood damage) with objective levels of these variables derived from the flood risk model conducted by experts (Aerts et al. 2014). We compare an individual’s best estimate of the flood probability with the objective probability from the flood risk model rather than the FEMA flood zone probability. The reason is that our regression results (Table 5) show that the latter variable does not significantly relate with the perceived flood probability, while there is a significant relation with the objective probability.
We consider the perceived flood probability, damage or expected risk (PR, for perceived risk) as being a correct perception of the objective measurement of this variable (OR, for objective risk) if: OR (1−EM) ≤ PR ≤ OR (1+EM , where the error margin (EM) takes on the values 0.25, 0.5, or 0.75 (i.e., 25 percent, 50 percent and 75 percent). Note that PR is an underestimation if PR < OR(1−EM) and an overestimation if PR > OR(1+EM). As an illustration, if we allow for an error of 50% (EM=0.5) and the objective flood probability is 0.01 then we count an individual’s perception of the flood probability as correct if it falls between 0.005 and 0.015, while the perception is an underestimation if it is smaller than 0.005 and an overestimation if it is larger than 0.015.
Table 7: The percent of respondents who correctly, under- or over-, estimate the flood probability, flood damage, and expected flood damage (probability × damage), based on the allowance of different error margins.
Perceived vs. objective flood probability Perceived vs. objective flood damage
Table 7 presents the results of this analysis. Only 14 percent and 24 percent of the respondents perceive their flood probability correctly in relation to the objective probability with an error margin (EM) of 25 percent and 50 percent, respectively. This increases to only 36 percent if EM = 75 percent. The majority of respondents overestimate their flood probability, while between 13 percent and 28 percent underestimate their flood probability.
Individuals appear to be more accurate in estimating the damage that their residence would suffer if flooded. Slightly more people correctly estimate flood damage if a 25 percent error margin is allowed for, but this group increases substantially to 33 percent and 63 percent when EM = 50 percent and 75 percent respectively. This increased accuracy could be partially due to the wider interval for flood damage than probability of a flood for a given EM. More people underestimate than overestimate their flood damage.
In estimating the expected damage from flooding (i.e., probability of flood damage × anticipated damage), fewer individuals have correct expectations (between 9 percent and 31 percent depending on the error margin we allow) than for the probability and damage estimates looked at separately, as shown in Table 7. The overall overestimation of the flood probability outweighs the overall underestimation of flood damage when computing expected damage given that more individuals overestimate than underestimate their expected flood damage.
Table 8: Summary of results of hypotheses.
# H1 H2 H3 H4 H5 H6 H7
Table 8 summarizes how our hypotheses fared. There is some support for H1 since there are several statistically significant but weak relationships between perceived and objective risk: in particular, the perceived flood probability and damage relate significantly to their objective counterparts (p-value < 0.01). While only experts know the results of the flood risk model, laypersons can gain insight into their own risk by examining official FEMA flood maps of NYC to determine whether they reside in a high risk 1/100 year flood zone or lower risk 1/500 or X zone. Our models reveal that, apart from creating general flood awareness, the publicly available FEMA flood zone classification has little influence on how people perceive their flood probability and damage. This means that there is limited support for H2.
We examined whether intuitive (System 1) thinking guided by availability, the threshold model, or emotions like worry and trust is related to risk perception. Indeed we find that adding these variables to the regression analyses significantly improves the model fit. More specifically, the dominant role of the availability bias in the shaping of risk perceptions is confirmed (H3) with individual flood risk awareness significantly related to whether the respondent experienced flooding in the past, the perceived flood probability related to the number of times the respondent has been flooded, and anticipated flood damage related significantly to the level of experienced flood damage.
Overall, 86 percent of the respondents are certain or think that they live in a flood-prone area. A majority of homeowners are worried about experiencing future flood damage and their average perceived flood frequency of 1-in-72 years is slightly lower than the average objective estimate of the risk. It is an open question as to the extent that Hurricane Irene in 2011 and Hurricane Sandy in 2012 drive these statistics. We are not aware of a household flood risk perception survey conducted in New York before 2011 that could serve as a basis for comparison. Nevertheless, given the destructive impact of Hurricane Sandy, it is not surprising that 62 percent of the respondents indicated that this disaster had indeed increased their perceptions of flood risks (one of our survey questions). Our finding that many people overestimate their flood probability may be caused by the recent experience of Hurricanes Irene and Sandy in two consecutive years. The absence of such flood events over a longer period of time may result in people reducing their estimate of the likelihood of a flood.
Some individuals appear to use a threshold model in judging risks with 28 percent of our respondents thinking that the flood probability is below their threshold levels of concern. Flood risk awareness is lower for individuals who think that the flood probability is below their threshold level of concern, and such individuals have lower perceptions of the flood probability and anticipate lower flood damage. These findings support H4. It should be noted that whether individuals think that the flood probability is below their threshold level of concern is not significantly related to the objective risk data.17
In addition, emotions such as worry and trust appear to be related to individual risk perceptions. We find that worry relates positively and highly significantly to flood risk awareness, the perceived flood probability and anticipated flood damage, confirming H5. Moreover, high trust in the capacity of NYC government officials to limit flood impacts is negatively related to anticipated flood damage (H6).
A more detailed analysis of the relationship between perceived and objective probability and damage reveals that a minority of individuals have correct perceptions. One can debate where to draw the line as to what constitutes a correct perception, which is why we allowed for error margins ranging from 25 percent to 75 percent. The midpoint of 50 percent may be most intuitive to use for this discussion since this would fall within the 95 percent confidence interval of the uncertainty about the objective risk indicators derived from the probabilistic flood damage model (Aerts et al., 2014). With this error margin, 24 percent have a correct perceived flood probability and 33 percent anticipate flood damage correctly.
The largest group of respondents overestimates their flood probability (51 percent). This is consistent with findings of other studies showing that individuals overestimate the likelihood of tail events (Barberis, 2013a). The regression results in Table 5 show that the availability bias and worry contribute to overestimation (H7). As an illustration, the perceived flood probability is 7 percent higher for each flood that has been experienced, an individual who highly worries about flooding has a 46 percent higher perceived flood probability, and an individual who thinks that the flood probability is above her/his threshold level of concern has a 26 percent higher perceived flood probability.
More people underestimate (47 percent) than overestimate (19 percent) their flood damage. The regression results in Table 6 show that not experiencing flood damage (availability), thinking that the flood probability is below their threshold level of concern, low worry and high trust contribute to this underestimation.
We did not expect to find that the largest groups of people overestimate their flood probability and underestimate flood damage. Overestimation of flood probability may be related to the occurrence of two low-probability hurricanes in consecutive years before the survey was undertaken, as discussed above. While we find that several variables are related to both flood probability and damage perceptions in Tables 5 and 6, a variable that is negatively related to perceptions of damage is trust in NYC flood management to help prepare houses so as to withstand losses from a future flood.
Improving resilience to floods and other disasters is becoming an important policy issue (National Research Council, 2012). It is thus relevant to suggest ways of improving individuals’ perception of the risks they face—both the probability and the consequences—and encourage them to prepare for flooding, such as by purchasing flood insurance. The latter is especially of concern since many homeowners in high-risk flood zones in the U.S. do not have flood insurance coverage or cancel their flood policy if they have not experienced a flood for several years (Michel-Kerjan, Lemoyne de Forges & Kunreuther, 2012).
Our principal recommendation is to provide individuals with objective data on the flood risk that they face so they can appreciate what these estimates imply for the future safety of their property and what it may mean to their household if they experience another severe hurricane or flood. Currently, the only information that inhabitants of most U.S. floodplains can collect is whether they live in a designated FEMA flood zone. This flood zone information is incomplete since it offers only partial information on the flood probability, that is, the flood zones represent probabilities of 1/100, 1/500 or lower, while no information is provided about potential flood damages—a key piece of information residents would need in order to make decision about protecting their house and/or purchasing insurance coverage. It is the responsibility of FEMA to develop better flood risk maps and to communicate this information to the public.
The importance of helping individuals better understand their flood risk is highlighted by our results showing that very few individuals have correct expectations of flood risks, in line with other studies (Kunreuther, Novemsky & Kahneman, 2001; Botzen, Aerts & van den Bergh, 2009). People tend to overestimate their flood probability but underestimate their potential flood damage. The latter is especially troubling because individuals who incorrectly perceive that flood damage will be minor are likely to believe that insurance coverage and damage mitigation measures are not cost-effective (Botzen & van den Bergh, 2012). Self-insurance will likely be ineffective if households have insufficient savings to repair damage after a flood occurs. It is also important that residents in flood-prone areas are more actively provided with information on objective flood damage, including worst-case scenarios.
With respect to the probability dimension, a challenge is how to frame information about low-probability/high-consequence risks in such a way that individuals do not treat these as falling below their threshold level of concern. Research shows that simply lengthening the time frame about the likelihood of a hazard can have a significant impact on the perception of the risk (Slovic, Fischhoff & Lichtenstein, 1978; Keller, Siegrist & Gutscher, 2006). Property owners in a flood-prone area are more likely to take flood risk seriously if, instead of being told the chance of a flood is 1 in 100 in any given year, they are informed that they have a greater than 1-in-5 chance of flooding in the next 25 years. This reframing could assist those who tend to disregard the consequences of flooding because they underestimate its likelihood or think that it is below their threshold level of concern. Insurers, real estate brokers, and/or local, state, and federal organizations concerned with reducing losses from disasters should provide such reframed risk information.
Even when individuals have access to adequately framed information about their objective flood risk, it may be difficult to convince them to purchase insurance coverage if they perceive the likelihood and financial consequences of a future disaster to be sufficiently low that it is not worthwhile to incur the search costs of collecting the relevant data required to make this decision (Kunreuther & Pauly, 2004). Pointing out that individuals would have to pay flood losses from their own pocket if they are uninsured may encourage them to purchase flood insurance (Kunreuther, Pauly & McMorrow, 2013).
It may also be appropriate to require all homeowners in flood-prone areas to purchase insurance. Current regulations require homeowners in 1/100 year flood zones with federally-backed mortgages to buy flood insurance to protect banks and the federal government from mortgage default. Expanding this requirement, coupled with well-enforced land-use regulations and minimum building code standards could avoid large public sector expenditures following these types of events (Michel-Kerjan & Kunreuther, 2011). Individuals who have a high flood risk can be motivated to invest in mitigation measures that exceed building code standards if they are given long-term home improvement loans coupled with insurance premium reductions that reflect the reduced damage and hence lower insurance claims following the next flood (Kunreuther, Michel-Kerjan & Pauly, 2013). Such a program would require flood insurance premiums to reflect risk which is not true for many policies today. A movement toward risk based pricing was part of the Biggert-Waters Flood Insurance Reform Act that was enacted in 2012, which has been partly repealed in 2014 by the Homeowner Flood Insurance Affordability Act. The reason is that risk-based pricing raises issues of affordability that need to be considered. Recent studies have proposed support for low-income households in floodplains by means of flood insurance vouchers to address affordability and equity concerns with risk based insurance pricing (Kousky & Kunreuther, 2014).
Improving our understanding of how individuals perceive and respond to low-probability/high-consequence risks is of considerable interest given the destructive experiences with such events in recent years. In particular, improved insights into how perceptions of probabilities and damage of such events relate to the objective probability and damage can guide the design of policies to help people make better risk assessments and precautionary decisions.
While most studies have examined perceptions of loss probabilities and/or examined relations between crude indicators of perceived and objective risk, our study examines perceptions of both damage and probability and how these relate to detailed estimates of their objective counterparts. Moreover, we also examine how these perceptions relate to intuitive (System 1) thinking. This provides insights into mechanisms behind individual over- or underestimation of probability and damage, which has not received sufficient study.
We make use of survey data about flood risk perceptions of more than 1,000 homeowners living in floodplains in New York City (NYC). This provides a unique comparison with objective flood risk data from a probabilistic spatially detailed flood damage model developed for NYC as well as from FEMA maps. We find that flood risk awareness and perceptions of the flood probability and damage relate weakly to objective flood risk indicators but that variables such as past experiences with flooding have a large influence on flood risk awareness, and perceptions of the flood probability and damage. Individuals appear to use a threshold model in judging risks since these perceptions are significantly lower for individuals who perceive the flood probability as falling below their threshold level of concern. High trust in the flood management capacity of government officials lowers anticipated flood damage. Few people accurately assess their flood probability and damage, and most people underestimate damage and overestimate probability. Overestimation (underestimation) is triggered by the aforementioned intuitive (System 1) variables, namely (no) past flood experience, (low) worry, perception of the probability falling (below) above a threshold level of concern, and (high) low trust.
Several policy recommendations have been discussed to overcome the effects of these intuitive (System 1) variables on individual flood risk assessments and decisions about preparing for floods. These include providing individuals with adequately framed information about both their objective flood probability and damage, enforcing and strengthening mandatory flood insurance purchase requirements, setting minimum building code standards, and encouraging individuals to go beyond these by charging risk-based flood insurance premiums. This set of measures should help people make better decisions with regard to flood risk, and reduce the bill that society pays for future floods.
Aerts, J. C. J. H., Botzen, W. J. W., Emanuel, K., Lin, N., De Moel, H., & Michel-Kerjan, E. (2014). Evaluating flood resilience strategies for coastal mega-cities. Science, 344, 473–475.
Aerts, J. C. J. H., Lin, N., Botzen, W. J. W., Emanuel, K., & de Moel, H. (2013). Low probability flood-risk modeling for New York City. Risk Analysis, 33(5), 772–788.
Alberini, A., Cropper, M., Krupnick, A., & Simon, N. B. (2004). Does the value of a statistical life vary with age and health status? Evidence from the US and Canada. Journal of Environmental Economics and Management, 48(1), 769–792.
Barberis, N. C. (2013a). The psychology of tail events: Progress and challenges. American Economic Review, 103(3), 611–616.
Barberis, N. C. (2013b). Thirty years of prospect theory in economics: A review and assessment. Journal of Economic Perspectives, 27(1), 173–96.
Baron, J., Hershey, J. C., & Kunreuther, H. (2000). Determinants of priority for risk reduction: the role of worry. Risk Analysis, 20, 413–428.
Barseghyan, L., Molinari, F., O’Donoghue, T., & Teitelbaum, J. (2013a). Distinguishing probability weighting from risk perceptions in field data. American Economic Review: Papers and Proceedings, 103(3), 580–585.
Barseghyan, L., Molinari, F., O’Donoghue, T., & Teitelbaum, J. (2013b). The nature of risk preferences: Evidence from insurance choices. American Economic Review, 103(6), 2499–2529.
Bordalo, P., Gennaioli, N., & Shleifer, A. (2012). Salience theory of choice under risk. Quarterly Journal of Economics, 127(3): 1243-85.
Botzen, W. J. W., Aerts, J. C. J. H., & van den Bergh, J. C. J. M. (2009). Dependence of flood risk perceptions on socio-economic and objective risk factors. Water Resources Research, 45, W10440.
Botzen, W. J. W., & van den Bergh, J. C. J. M. (2012). Monetary valuation of insurance against flood risk under climate change. International Economic Review, 53(3), 1005–1025.
Brewer, N. T., Chapman, G. B., Gibbons, F. X., Gerrard, M., McCaul, K. D., & Weinstein, N. D. (2007). Meta-analysis of the relationship between risk perception and health behavior: The example of vaccination. Health Psychology, 26(2), 136–145.
Brilly, M., & Polic, M. (2005). Public perceptions of flood risk, flood forecasting and mitigation. Natural Hazards and Earth System Sciences, 5, 345–355.
Camerer, C., & Kunreuther, H. (1989). Experimental markets for insurance. Journal of Risk and Uncertainty, 2, 265-300.
Carman, K. G., & Kooreman, P. (2014). Probability perceptions and preventive health care. Journal of Risk and Uncertainty, 49, 43–71.
Conlisk, J. (1996). Why bounded rationality? Journal of Economic Literature, 34(2): 669-700.
De Bruin, W. B., Parker, A. M., & Maurer, J. (2011). Assessing small non-zero perceptions of chance: The case of H1N1 (swine) flu risks. Journal of Risk and Uncertainty, 42, 145–159.
Erev, I., Glozman, I., & Hertwig, R. (2008). What impacts the impact of rare events. Journal of Risk and Uncertainty, 36(2), 153-177.
Fehr-Duda, H., & Epper, T. (2012). Probability and risk: Foundations and economic implications of probability-dependent risk preferences. Annual Review of Economics, 4(1), 567-93.
Finucane, M. L., Alhakami, A., Slovic, P. & Johnson, S. M. (2000). The affect heuristic in judgments of risks and benefits. Journal of Behavioral Decision Making, 13(1), 1–17.
Fischhoff, B., & de Bruin, W. B. (1999). Fifty-fifty=50%? Journal of Behavioral Decision Making, 12(21), 37–44.
Fox, C. R., & Hadar, L. (2006). “Decisions from experience” = sampling error + prospect theory: Reconsidering Hertwig, Barron, Weber & Erev (2004). Judgment and Decision Making, 1, 159–161.
Gigerenzer, G. (2004). Dread risk, September 11, and fatal traffic accidents. Psychological Science, 15(4), 286–287.
Gigerenzer, G., & Hoffrage, U. (1995). How to improve Bayesian reasoning without instruction: Frequency formats. Psychological Review, 102(68), 684–704.
Goldstein, D. G., & Rothschild, D. (2014). Lay understanding of probability distributions. Judgment and Decision Making, 9(1), 1–14.
Hertwig, R., Barron, G., Weber, E. U., & Erev, I. (2004). Decisions from experience and the effect of rare events in risky choice. Psychological Science, 15, 534–539.
Hoffrage, U., & Gigerenzer, G. (1998). Using natural frequencies to improve diagnostic inferences. Academic Medicine, 73, 538-540.
Kahneman, D. (2003). Maps of bounded rationality: Psychology for behavioral economics. The American Economic Review, 93(5), 1449–1475.
Kahneman, D. (2011). Thinking fast and slow. New York: Farrar, Straus and Giroux.
Kellens, W., Terpstra, T., & De Maeyer, P. (2013). Perception and communication of flood risks: A systematic review of empirical research. Risk Analysis, 33(1), 24–49.
Keller, C., Siegrist, M., & Gutscher, H. (2006). The role of the affect and availability heuristics in risk communication. Risk Analysis, 26(3), 631–639.
Kousky, C., & Kunreuther, H. (2014). Addressing affordability in the National Flood Insurance Program. Journal of Extreme Events, 1(1), 1–28.
Kunreuther, H., Michel-Kerjan, E., & Pauly, M. (2013). Making America more resilient toward natural disasters: A call for action. Environment, June.
Kunreuther, H. C., Novemsky, N., & Kahneman, D. (2001). Making low probabilities useful. Journal of Risk and Uncertainty, 23(2), 161–186.
Kunreuther, H. C., & Pauly, M. (2004). Neglecting disaster: Why don’t people insure against large losses? Journal of Risk and Uncertainty, 28(1), 5–21.
Kunreuther, H., Pauly, M., & McMorrow, S. (2013). Behavioral economics and insurance: Improving decisions in the most misunderstood industry. New York: Cambridge University Press.
Lichtenstein, S., Slovic, P., Fischhoff, B., Layman, M., & Combs, B. (1978). Judged frequency of lethal events. Journal of Experimental Psychology and Human Learning, 4(6), 551–578.
Lin, N., Emanuel, K., Oppenheimer, M., & Vanmarcke, E. (2012). Physically based assessment of hurricane surge threat under climate change. Nature Climate Change, 1389, 462–467.
Loewenstein, G. F., Hsee, C.K., Weber, E. U., & Welch, N. (2001). Risk as feelings. Psychological Bulletin, 127(2), 267–286.
McClelland, G., Schulze, W., & Coursey, D. (1993). Insurance for low-probability hazards: A bimodal response to unlikely events. Journal of Risk and Uncertainty, 7, 95–116.
Michel-Kerjan, E. O. (2010). Catastrophe economics: The National Flood Insurance Program. Journal of Economic Perspectives, 24(4), 165–186.
Michel-Kerjan, E., & Kunreuther, H. (2011). Redesigning flood insurance. Science, 433, 408–409.
Michel-Kerjan, E., Lemoyne de Forges, S., & Kunreuther, H. (2012). Policy tenure under the U.S. National Flood Insurance Program. Risk Analysis, 32(4), 644–658.
National Research Council (2012). Disaster reslience: a national imperative. Washington, DC: The National Academies Press.
NYC (2013). PlaNYC: A stronger more resilient NYC. New York City, Mayor’s Office of Long Term Planning and Sustainability. http://www.nyc.gov/html/sirr/html/report/report.shtml
Rowe, G., & Wright, G. (2001). Differences in expert and lay judgments of risk: Myth or reality? Risk Analysis, 21, 341–356.
Ruin, I., Gaillard, J.-C., & Lutoff, C. (2007). How to get there? Assessing motorists’ flash flood risk perception on daily itineraries. Environmental Hazards, 7(3), 235–244.
Savage, L. J. (1954). The foundations of statistics. Wiley, New York.
Schapira, M. M., Davids, S. L., McAuliffe, T. L., & Nattinger, A. B. (2004). Agreement between scales in the measurement of breast cancer risk perceptions. Risk Analysis, 24(3), 665–673.
Schneider, Y., & Zweifel, P. (2004). How much internalization of nuclear risk through liability insurance? Journal of Risk and Uncertainty, 29(3), 219–240.
Siegrist, M., & Gutscher, H. (2006). Flooding risks: A comparison of lay people’s perceptions and expert’s assessments in Switzerland. Risk Analysis, 26(4), 971–979.
Slovic, P. (1987). Perception of risk. Science, 236(4799), 280–285.
Slovic, P. (2000). Perceptions of Risk. Earthscan, London.
Slovic, P. (2010). The feeling of risk: New perspectives on risk perception. London: Earthscan.
Slovic, P., Finucane, M. L., Peters, E., & MacGregor, D.G. (2004). Risk as analysis and risk as feelings: Some thoughts about affect, reason, risk, and rationality. Risk Analysis, 24(2), 311–322.
Slovic, P., Fischhoff, B., & Lichtenstein, S. (1978). Accident probabilities and seat belt usage: A psychological perspective. Accident Analysis and Prevention, 10, 281–285.
Slovic, P. Fischhoff, B., & Lichtenstein, S. (1982). Facts versus fears: Understanding perceived risk. In D. Kahneman, P. Slovic, A. Tversky (Eds.) Judgment under uncertainty: Heuristic and biases. Cambridge: Cambridge University Press.
Slovic, P., Fischhoff, B., Lichtenstein, S., Corrigan, B., & Combs, B. (1977). Preference for insuring against probable small losses: Insurance implications. Journal of Risk and Insurance, 44(2), 237–258.
Slovic, P., Layman, M., & Flynn, J. H. (1991). Risk perception, trust, and nuclear waste: Lessons from Yucca Mountain. Environment, 33(3), 7–30.
Slovic, P., Monahan, J., & MacGregor, D. G. (2000). Violence risk assessment and risk communication: The effect of using actual cases, providing instructions, and employing probability versus frequency formats. Law and Human Behavior, 24, 271–296.
Slovic, P., & Weber, E. U. (2015). Perception of risk posed by extreme events. In: Regulation of toxic substances and hazardous waste (2nd edition) (Applegate, Gabba, Laitos, & Sachs, Editors), Foundation Press, in press. Available at SSRN: http://ssrn.com/abstract=2293086.
Starmer, C. (2000). Developments in non-expected utility theory: The hunt for a descriptive theory of choice under risk. Journal of Economic Literature, 38(2), 332–382.
Taleb, N. (2007). The black swan: The impact of the highly improbable. New York: Random House.
Terpstra, T. (2011). Emotions, trust, and perceived risk: Affective and cognitive routes to flood preparedness behavior. Risk Analysis, 31(10), 1658–1674.
Tversky, A., & Kahneman, D. (1973). Availability: A heuristic for judging frequency and probability. Cognitive Psychology, 5(2), 207–232.
Tversky, A., & Kahneman, D. (1974). Judgment under uncertainty: Heuristics and biases. Science, 185(4157), 1124–1131.
Tversky, A., & Kahneman, D. (1992). Advances in prospect theory: Cumulative representation of uncertainty. Journal of Risk and Uncertainty, 5(4), 297–323.
Viscusi, W. K., & Hamilton, J. T. (1999). Are risk regulators rational? Evidence from hazardous waste cleanup decisions. The American Economic Review, 89(4), 1010–1027.
Viscusi, W. K., & Zeckhauser, R.J. (2006). National survey evidence on disasters and relief: Risk beliefs, self-interest, and compassion. Journal of Risk and Uncertainty, 33(1-2), 13–36.
von Neumann, J., & Morgenstern, O. (1947). The theory of games and economic behavior. 2nd edition, Princeton University Press, Princeton.
Weber, E. U., & Stern, P. (2011). The American public’s understanding of climate change. American Psychologist, 66, 315–328.
Weinstein, N. D., Kwitel, A., McCaul, K. D., Magnan, R. E., Gerrard, M., & Gibbons, F. X. (2007). Risk perception: Assessment and relationship to influenza vaccination. Health Psychology, 26(2), 146–151.
Woloshin, S., Schwartz, L. M., Byram, S., Fischhoff, B., & Welch, H. G. (2000). A new scale for assessing perceptions of chance: A validation study. Medical Decision Making, 20(3), 298–307.
The sample consists of homeowners who live in flood-prone areas in NYC and own a house with a ground floor. The sample has been designed as follows. First, a selection was made of census blocks in NYC which fall inside the FEMA flood zones and are flooded at least once during the 549 storm simulations of our flood risk model. The reason for excluding areas which are located in the FEMA flood zones but are not flooded in our flood risk model is that the FEMA maps in 2012 were outdated, and were being revised by FEMA at that time. By using both the FEMA maps and the flood risk model for the selection of flood-prone areas we can be more confident that the respondents are from flood-prone areas.18
The survey was implemented over the phone. Applying the sample selection criteria resulted in 21,050 eligible landlines which could be used for contacting respondents. The survey was implemented by the survey company Kerr and Downs Research who are experienced in conducting phone surveys about natural disaster risks. The survey was pre-tested in several phases. Two focus groups with local experts were held with 22 NYC officials involved in flood risk management. These officials worked at a variety of departments that deal with flood risk issues; namely, the NYC Mayor’s Office, NYC Department of City Planning, and the NYC Buildings Department. The purpose of these meetings was to obtain feedback on the research questions and themes of the survey, the general set-up of the study, and sample selection. A focus group with 12 NYC homeowners was conducted. Part of this session was devoted to testing the understanding of the risk perception questions. Finally, 40 pre-tests of the phone survey were conducted. These pre-tests resulted in small changes in the wording of questions in order to clarify these for respondents.
Final interviews were held between March and April 2013. Thirty-five professional and trained interviewers conducted the phone interviews using computer assisted telephone interviewing (CATI). The survey started with questions that asked whether respondents owned their home and whether or not the home they lived in had a ground floor. Only respondents who answered positively to those questions were allowed to continue. Of the eligible respondents, 1,035 completed the survey which took on average about 20 minutes to complete. The completion rate of the survey was 73 percent. Few people from the Bronx (2 percent) and Manhattan (2 percent) completed the survey, compared with people from Queens (41 percent), Staten Island (28 percent), and Brooklyn (27 percent). This makes sense since there are few homeowners who live on a ground floor in flood-prone areas in the Bronx and Manhattan where many buildings are middle- and high-rises.
I will start with a few questions about flood risks. Please keep in mind that we are talking here about floods caused by natural disasters.
Which is true for you:
Will climate change increase or decrease the risk of your home flooding or will it have no impact?
Please tell me if you strongly agree, agree, neither agree nor disagree, disagree or strongly disagree with the following: I am worried about the danger of a flood at my current residence.
Few studies have examined the performance of risk assessment scales or other questions that elicit perceived hazard likelihoods (Woloshin et al., 2000; Schapira et al., 2004; de Bruin, Parker & Maurer, 2011). Probabilities may be elicited using a frequency or a percentage question format. Several studies have suggested that a frequency format is easier for respondents than a percentage format (Gigerenzer & Hoffrage, 1995; Fischhoff & de Bruin, 1999; Hoffrage & Gigerenzer, 1998; Schapira et al., 2004) and that the percentage format may result in an overestimation of perceived risk (Slovic, Monahan & MacGregor, 2000). Moreover, a disadvantage of the percentage scale is that many respondents use the anchor points 0 percent, 50 percent and 100 percent (Schapira et al., 2004). The peak of answers of 50 percent may be caused by “don’t know” responses by individuals who tend to answer that their risk is fifty-fifty if they are unsure about the probability (Fischhoff & de Bruin, 1999).
For these reasons, we adopted a frequency format. Providing a scale of
answer options may facilitate respondents in answering a probability
estimate. Woloshin et al. (2000) show that a logarithmic scale
outperforms a linear scale in eliciting perceptions of low-probability
health hazards. Moreover, de Bruin et al. (2011) show that eliciting
perceived probabilities of dying from swine flu using a logarithmic
scale improved the predictive power of this perceived probability in
describing attitudes and self-reported behaviours with respect to
swine flu. The logarithmic scale has been used in other studies that
elicit perceptions of the likelihood of a low-probability hazard. For
example, Schneider and Zweifel (2004) used such a scale to elicit the
subjective probability of a nuclear accident. They provided an expert
assessment of the likelihood as an anchor point. Answers to this
question significantly influenced demand for nuclear risk
insurance. Botzen et al. (2009) adopted a similar logarithmic scale to
elicit perceptions of the flood probability in the Netherlands, and
also provided an expert assessment of the likelihood as an anchor
point. Answers to this question significantly influenced demand for
flood insurance (Botzen & van den Bergh, 2012). The final question
format used below includes these recommendations following the
literature review about using a frequency format, proving an anchor
point, and adopting a logarithmic scale.
Experts have estimated that a flood in Special Flood Hazard Areas in New York occurs on average once in 100 years.
Do you think that a flood at your home will occur as often as once in 100 years, or more often or less often?
If the respondent has answered “more often than 100 years” then the following question is posed:
Do you think that a flood at your home will occur on average more often than once in 10 years?
If the respondent has answered “less often than 100 years” then the following question is posed:
Do you think that a flood at your home will occur on average more often than once in 1,000 years?
So you expect that a flood occurs on average [depending on previous answers] more than 1 in 10 years [or] between 1 in 10 years and 1 in 100 years [or] between 1 in 100 years and 1 in 1000 years [or] less often than 1 in 1000 years.
What is your best estimate of how often a flood would occur at your home? Once every …years?
Some people think that the flood probability is too low to be concerned about it. These people find that the flood probability is below their threshold level of concern. Does this apply to you?
What would it cost to repair the damage to your home and its contents if your home did flood?
If necessary, ask “Would it cost more or less than $25,000?” increase/decrease by $5,000 until the respondents gives the answer. The midpoint of the ranges offered to the respondent is recorded.
$…
This type of question and factors determining responses to this question are discussed in detail in Botzen et al. (2009) who applied this question in a survey on flood risk perceptions in the Netherlands.
How much do you trust the ability of NYC officials to help you and other residents prepare their houses to withstand a flood. Do you: trust them completely, trust them somewhat, not trust them very much, not trust them at all.
| Dependent variables | |
| Flood risk awareness | Ordinal variable, 1=respondent is certain that s/he does not live in a flood-prone area, 2=respondent thinks that s/he does not live in a flood-prone area, 3=respondent thinks that s/he lives in a flood-prone area, 4=respondent is certain that s/he lives in a flood-prone area |
| Perceived flood probability | Natural logarithm of 1/perceived flood frequency |
| Perceived flood damage | Natural logarithm of the damage that a respondent expects that a flood would cause on their home and contents (in $) |
| Explanatory variables | |
| Maximum inundation | Maximum inundation level of the census block of the respondent (in feet) |
| Flood probability | Probability that the census block of the respondent is flooded |
| Model flood damage | Flood damage predicted by the flood risk model based on the respondent’s house value, the median expected inundation level and the HAZUS model stage damage curves |
| FEMA 1/100 | 1=respondent is located in the FEMA 1/100 year flood zone, 0=otherwise |
| FEMA 1/500 | 1=respondent is located in the FEMA 1/500 year flood zone, 0=otherwise |
| Experienced flooding | 1=respondent has been flooded at least one time in the past, 0=otherwise |
| Number of times flooded | Number of times that the respondent has been flooded at his/her current home |
| Not experienced flood damage | 1=respondent has not experienced flood damage in the past, 0=otherwise |
| Level of experienced flood damage | Damage that the respondent experienced during his/her last flood in $ |
| Below threshold of concern | 1=respondent thinks that the flood probability is below her/his threshold level of concern, 0=it is above this threshold |
| Worry about flood | 1=respondent agrees with the statement “I am worried about the danger of a flood at my current residence”, 0=otherwise |
| High worry about flood | 1=respondent strongly agrees with the statement “I am worried about the danger of a flood at my current residence”, 0=otherwise |
| Complete trust in NYC flood management | 1=trust government’s flood risk management completely, 0=otherwise |
| Female | 1=female, 0=male |
| Age | Age in years |
| Income | Household income in thousand $ |
| Low education level | 1=respondent has not completed high school education, 0=otherwise |
| College major in math, science, technology fields | 1=respondent has a major in math, science or technology fields. 0=otherwise |
Copyright: © 2015. The authors license this article under the terms of the Creative Commons Attribution 3.0 License.
This document was translated from LATEX by HEVEA.