| Figure 1: Number frequencies in the Lotto game. |

Judgment and Decision Making, Vol. 11, No. 3, May 2016, pp. 243-259
Number preferences in lotteriesTong V. Wang* Rogier J.D. Potter van Loon* Martijn J. van den Assem# Dennie van Dolder$ |
We explore people’s preferences for numbers in large proprietary data sets from two different lottery games. We find that choice is far from uniform, and exhibits some familiar and some new tendencies and biases. Players favor personally meaningful and situationally available numbers, and are attracted towards numbers in the center of the choice form. Frequent players avoid winning numbers from recent draws, whereas infrequent players chase these. Combinations of numbers are formed with an eye for aesthetics, and players tend to spread their numbers relatively evenly across the possible range.
Keywords: lotteries, gambling, number preference, color preference, implicit egotism, availability, position effect, law of small numbers, representativeness, gambler’s fallacy, hot-hand fallacy.
Many choice situations involve numeric values. Numbers indicate quantities, prices, rankings, and they serve as arbitrary labels or identification codes. A recent literature related to the Chinese culture shows that tastes and distastes for particular numbers can influence decisions and affect market prices. Vehicle license plates with the lucky number eight are auctioned at relatively high prices, and vehicle plates with the unlucky number four are auctioned at relatively low prices (Woo & Kwok, 1994; Woo, Horowitz, Luk & Lai, 2008; Chong & Du, 2008; Ng, Chong & Du, 2010). In housing markets, houses with a number ending in eight are traded at a premium, whereas houses with a number ending in four are traded at a discount (Bourassa & Peng, 1999; Chau, Ma & Ho, 2001; Agarwal, He, Liu, Png, Sing & Wong, 2014; Fortin, Hill & Huang, 2014; Shum, Sun & Ye, 2014). In financial markets, culture-inspired number preferences cause particular limit-order and transaction prices to be more frequent than other ones (Brown, Chua & Mitchell, 2002; He & Wu, 2006; Cai, Cai & Keasey, 2007; Brown & Mitchell, 2008; Bhattacharya, Kuo, Lin & Zhao, 2016). Moreover, the shares of newly listed firms with lucky listing codes seem to be overvalued and underperform those with unlucky listing codes (Hirshleifer, Jian & Zhang, 2014).
Tradition or cultural background is just one possible determinant of tastes and distastes for particular numbers. In the present paper, we map a variety of other determinants in the context of two different lottery games. The first is the Dutch Lotto, a nationwide six-number lottery. For 175 consecutive draws that span a two-and-a-half year period, we have five million choices of combinations of six different numbers between 1 and 45. The second is a lottery that was organized as a promotional event by a large casino company in the Netherlands in 2013 and 2014. We have the complete collection of entries for each of the two years, for an aggregate of more than five hundred thousand choices of combinations of four numbers between 0 and 36.
The question whether people in these lottery games exhibit a systematic preference for particular numbers is interesting from multiple perspectives. First, our data provide a real-life test-bed for various behavioral regularities. The orientation of the games towards chance and prediction, the use of particular choice forms, the fact that people choose numbers in combinations, and the availability of specific numbers in the decision context, allow for the testing of a variety of psychological phenomena. Second, the preferences that we document here may also play a role in areas outside that of lotteries. Numerical labels and indicators abound in the environments of, for example, consumers, investors, entrepreneurs, and experimental subjects. If people have number preferences, these labels and indicators could influence their choices. The studies cited in the first paragraph above illustrate that the economic impact of such preferences is potentially significant. Last, understanding how people behave in lotteries is interesting in its own right. Many countries have one or more large lotteries in which people can choose the numbers they play with. Worldwide, households spend a significant portion of their income on lotteries, with total expenditures amounting to hundreds of billions of dollars (Kearney, Tufano, Guryan & Hurst, 2011; Beckert & Lutter, 2013).
Our results are surprisingly similar across the two games. Players have a tendency to play with the personally meaningful numbers in their birthdate, age, and postal code. They also more frequently choose numbers that are situationally available: there is a preference for numbers (i) in the current date, (ii) in the date of the draw, (iii) forming the jackpot size, (iv) representing the remaining time until the draw shown on the screen, and (v) on a voucher that players need in order to participate.
We also find evidence that the spatial position of numbers matters. The two lottery games employ a different range of numbers and tabulate these numbers in a different way. In both lotteries, players are attracted towards numbers in the center of the choice form and avoid numbers at the edges. Our final result for individual numbers is that frequent players avoid the winning numbers from recent draws, whereas infrequent players chase these.
For combinations of numbers we find that players care about aesthetics. With only a few exceptions, the most popular combinations all represent numeric sequences or spatial patterns. These combinations are selected extremely often in comparison with what would be expected if people choose randomly. Furthermore, players spread their numbers relatively evenly across the range of possible numbers.
Our study is not the first to investigate number preferences in lottery games, but it is distinct in terms of data and scope. Many earlier studies rely on indirect or aggregated data, analyzing the number of winners given particular draw results (Chernoff, 1981; Cook & Clotfelter, 1993; Terrell, 1994; Finkelstein, 1995; Scoggins, 1995; Haigh, 1997; Cox, Daniell & Nicole, 1998; Papachristou & Karamanis, 1998; Farrell, Hartley, Lanot & Walker, 2000; Roger & Broihanne, 2007) or the overall popularity of individual numbers or combinations (Joe, 1987; Halpern & Devereaux, 1989; Stern & Cover, 1989; Clotfelter & Cook, 1993; Henze, 1997; Simon, 1999; Ding, 2011; Lien, Yuan & Zheng, 2015; Lien & Yuan, 2015). To the best of our knowledge, only Suetens and Tyran (2012) and Suetens, Galbo-Jørgensen & Tyran (2015) use detailed individual-level data on lottery players and number choices. All these studies focus on a subset of the behavioral regularities that we consider in the present paper.
Figure 1: Number frequencies in the Lotto game.
Figure 2: Heat map for the Lotto game. 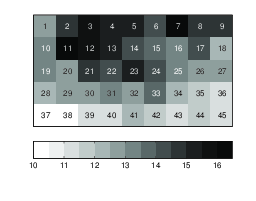
Generating €144 million in revenues in 2014, the Dutch Lotto is one of the largest nationwide lotteries in the Netherlands (annual report De Lotto, 2014). Draws take place every Saturday at 6pm CET. On the last Saturday of every month (“Super Saturday”) there are two draws. Players choose six numbers from the range of 1 to 45, and additionally one color from six. Bets cost €2 each, and prizes are awarded for matching at least two of the numbers drawn. The more numbers a player matches, the bigger the prize. During our sample period, the progressive jackpot had a minimum value of €7.5 million and increased by half a million each time it was not awarded. A player wins the jackpot if she matches all six numbers and the jackpot color. If there is more than one winner, the jackpot is shared. The chance of winning the jackpot or a share of it is roughly one-in-49-million. Table S1 in the Supplement displays the probabilities for the smaller prizes.
Our data consists solely of online transactions. When making an online transaction, a player is first asked how many combinations she wishes to bet on. Next, she chooses the numbers and color of each combination, and decides how many draws she wants to participate in (maximum of twelve). Our analyses ignore the number of chosen repetitions, because there is only one decision process underlying a string of automatically repeated bets. Figure S1 in the Supplement shows the online Lotto form.
By default, the computer system generates a random combination for each bet. A player can choose whether to play with this combination, to generate another random combination, to adjust one or more numbers manually, or to choose a combination from scratch. Unfortunately, we do not know when default combinations were used.
In our standard approach we weight each chosen combination equally, regardless of how many other combinations the same player bets on. As a robustness check, we also conduct analyses in which we weight observations by the reciprocal of the total number of combinations chosen by the player in our sample period.
Our anonymized data set consists of 2,590,919 online transactions for the Dutch Lotto between April 19, 2010 and December 31, 2012. A total of 175 draws took place in this time period. For the 5,108,343 chosen combinations in our data set we know the date of the transaction and the date of the draw. For the 131,407 (anonymous) players we know their gender, birthdate, and the four digits of their postal code.1 A majority of 73% of the players are male and 84% of the combinations are entered by males.
Figure 3: Number frequencies in the casino game. 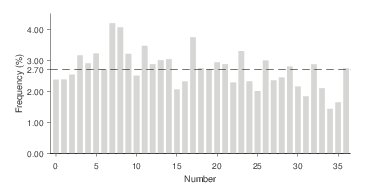
Figure 4: Heat map for the casino game. 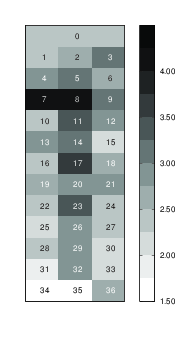
Our data for the casino game derive from two identical promotional events organized by Holland Casino in 2013 and 2014. Anyone who visited a casino of this Dutch state-owned company between May 2 and June 9, 2013 or May 6 and June 9, 2014 received a voucher with a login code. Via a terminal inside the casino and via the Internet this code granted access to a lottery where players had to predict the outcomes of four consecutive spins of a roulette wheel with pockets numbered from 0 to 36. Participants were competing for a guaranteed prize of €100,000, to be shared by those who predicted the correct numbers in the correct order. If nobody would win according to this criterion, then the prize would be shared by all players who predicted the correct numbers irrespective of order. If nobody would win on the basis of all four numbers, the prize would be awarded on the basis of the first three numbers alone. Unlike Lotto, players were not offered the possibility to use randomly generated numbers.
Our anonymized data consist of all 323,896 combinations of four numbers entered in 2013 and all 245,091 entered in 2014. For each combination we know the voucher code, the date of play, the player’s gender, and the player’s birthdate. The data set from 2014 also contains a unique number for each of the 112,473 players. For 2013 such a unique number is not available. The percentages of combinations entered by male players in 2013 and 2014 are 54.9 and 58.6, respectively.
If we analyze the two years separately, the results are strikingly similar. For example, as illustrated in Figure S2 in the Supplement, the correlation between the individual number frequencies is equal to 0.98 and the differences are small. In the subsequent sections we therefore present the results for the pooled data.
If players in the Lotto game pick their numbers randomly, each number is expected to be chosen 13.3% of the time (6/45). Figure 1 depicts the actual frequencies. The most popular number in the Lotto data is 11, picked in 16.5% of the combinations. The number 7 follows closely (16.3%). The least popular numbers are 37 and 38 (10.3% and 10.5%, respectively). Overall, we observe that players have a tendency to pick small numbers. Figure 2 presents the frequencies in a heat map, where the numbers are displayed in a matrix as they appear on the Lotto website.
Similar results emerge in the casino game. Figure 3 shows the selection frequencies for the 37 numbers. Under random number selection each number would be chosen 2.70% of the time (1/37). Again, we observe a preference for small numbers. The most popular number is 7, chosen 4.19% of the time, closely followed by 8 (4.05%). The most frequently picked number in the Lotto data, 11, is the fourth most popular number in the casino data (3.46%). The least popular numbers are 34 (1.43%) and 35 (1.64%). Figure 4 presents the frequencies in a heat map, with the numbers displayed as they appear on the roulette table. This presentation was also used on the vouchers and on the screen when players entered their predictions.
These results are in line with past research. Other lottery studies have similarly found that players have a preference for small numbers (Stern & Cover, 1989; Finkelstein, 1995; Cox et al., 1998; Papachristou & Karamanis, 1998; Farrell et al., 2000; Roger & Briohanne, 2007; Oyeleke & Otekunrin, 2014; Suetens et al., 2015). A possible explanation is that smaller numbers are more present in everyday life and easier to recall, and thus more likely to be personally relevant and prominently available in memory (Milikowski, 1995). The popularity of 7 seems to be a general phenomenon. Without exception, lottery studies find that 7 is among the most popular numbers. Experimental studies similarly document a preference for this number (Simon, 1971; Simon & Primavera, 1972; Heywood, 1972; Kubovy & Psotka, 1976; Teigen, 1983; Silver et al., 1988).2
Studies that looked at color preferences find that blue is the most frequently chosen color (Simon, 1971; Simon & Primavera, 1972; Trueman, 1979; Silver et al., 1988).3 ,4 Among our Lotto players, the most popular jackpot color is blue as well (22.2%), followed by red (18.9%), green (17.6%), yellow (14.6%), purple (13.4%), and orange (13.3%). In the game of roulette, half the numbers 1–36 are black and the other half are red (0 is green), and when the casino game players entered their predictions the numbers were displayed in these colors. The average selection frequency of red numbers is 2.75%, which is significantly higher than the average for black numbers of 2.68% (z-test; p < 0.001).
In both games, odd numbers are more popular than even numbers (Lotto: 13.5% vs. 13.1%; Casino: 2.77% vs. 2.63%); among the odd numbers, prime numbers are more popular than non-prime numbers (Lotto: 14.0% vs. 13.0%; Casino: 3.14% vs. 2.32%) and among the even numbers, non-round numbers are more popular than the “round” multiples of ten (Lotto: 13.2% vs. 12.7%; Casino: 2.68% vs. 2.48%). All these pairs of averages are significantly different (z-tests; all p < 0.001).
In other contexts, people tend to use round numbers more often than non-round numbers (Plug, 1977; Klesges, Debon & Ray, 1995; Bopp & Faeh, 2008; Pope & Simonsohn, 2011). One possible explanation for the difference is that lottery players may look for combinations that “look random”, and that non-round numbers appear more random than round numbers. Similarly, odd and prime numbers may appear more random than even and non-prime numbers, respectively.
People generally hold a favorable view towards the self (Greenwald & Banaji, 1995). This favorable view tends to spill over to things associated with the self (Beggan, 1992; Morewedge, Shu, Gilbert & Wilson, 2009; Nuttin, 1985, 1987). The resulting tendency of people to gravitate towards people, places, and things that resemble the self has been termed implicit egotism (Pelham, Carvallo & Jones, 2005). One example is the preference for the numbers in one’s own birthday (Kitayama & Karasawa, 1997; Jones, Pelham, Mirenberg & Hetts, 2002). In line with this, virtually all past Lotto studies show that the numbers in the range of 1–31 (days), and in particular 1–12 (days and months) are more popular than other numbers.
With our individual-level Lotto data we can directly investigate whether players have a preference for playing with the numbers of their day, month, and year of birth. We can also test whether they favor two other kinds of personally meaningful numbers, namely the number corresponding to their age and the numbers in their postal code.
For year of birth we consider the last two digits. Players need to be born between 1901 and 1945 to be able to use their birth year, which was true for 7.9% of the 5.1 million combinations. Selecting age as a number is only possible for people under the age of 46, which was true for 42.3% of the combinations. Dutch postal codes are alphanumeric, consisting of a number between 1000 and 9999 and two letters. We consider the first two digits and the last two digits. Players could select these numbers in 60.7 and 59.2% of the cases, respectively.
Table 1: Personally meaningful and situationally available numbers in the Lotto game.
Notes: The number of combinations reflects how often players were able to choose the particular number. For 29,442 (18,758) combinations we have no birthdate (postal code) information. All frequencies are significantly higher than 13.33% at the 0.1% level.
Table 2: Logit regression results for the Lotto game.
≤ 10 combs.
≥ 1,000 combs.Birthdate Day 6.88∗∗ 12.54∗∗ 12.51∗∗ 3.34∗∗ Month 2.91∗∗ 5.00∗∗ 5.15∗∗ 1.41∗∗ Year 7.28∗∗ 9.94∗∗ 11.18∗∗ 6.01∗ Age 3.70∗∗ 7.11∗∗ 6.80∗∗ 2.01∗∗ Postal code Left 2 digits 0.30∗∗ 0.27∗∗ 0.26∗ 0.12 Right 2 digits 0.24† 0.26∗∗ 0.24† 0.43 Current date Day 0.18∗∗ 0.30∗∗ 0.29∗∗ 0.01 Month 0.36∗∗ 0.44∗∗ 0.46∗∗ 0.23∗∗ Year 0.30∗∗ 0.39∗∗ 0.46∗∗ -0.01 Draw date Day 0.33∗∗ 0.44∗∗ 0.47∗∗ 0.23∗∗ Jackpot size Integer 0.30∗∗ 0.32∗∗ 0.32∗∗ 0.35∗∗ Decimal 0.22∗∗ 0.34∗∗ 0.39∗ 0.08 Remaining time First element 0.00 0.00 0.07 0.03 Second element 0.09∗∗ 0.06 0.03 0.08 Past draw j-1 -0.09∗∗ 0.17∗∗ 0.29∗∗ -0.21∗∗ Recent draws j-2 to j-6 Drawn once -0.04∗∗ 0.07∗∗ 0.10∗∗ -0.18∗∗ Drawn twice 0.01 0.16∗∗ 0.18∗∗ -0.16∗∗ Drawn trice 0.05† 0.30∗∗ 0.46∗∗ -0.28∗∗ Drawn four times 0.28∗∗ 0.45 0.72 -0.37 Number fixed effects included included included included Weighting no per player no no Pseudo R2 0.41% 0.87% 0.86% 0.22% No. observations 227,757,825 227,757,825 13,000,770 25,416,945 No. combinations 5,061,285 5,061,285 288,906 564,821 No. players 130,447 130,447 70,735 340 ∗∗ p<.001; ∗ p<.01; † p<.05.
Table 1, Panel A shows how frequently the personally meaningful numbers are chosen, conditional on the player being able to do so. Under the null hypothesis of random choice, numbers will be picked 13.3% of the time (6/45). This proportion is exceeded for all personally meaningful numbers (z-tests; all p < 0.001). Day of birth is the most popular one, followed by the year and month of birth, age, and the postal code numbers.
Personally meaningful numbers may also be popular due to the mere fact that people are frequently exposed to them. Even a short exposure to a number can make that number more available in short-term memory and affect subsequent responses (Kubovy, 1977). In the context of the Lotto game, numbers that are especially available to players are the current date, the numbers in the date of the upcoming draw, and the numbers prominently displayed on the website. Also, when making an online transaction, Lotto displays both the current jackpot size and the remaining time before the next scheduled draw.
For the jackpot size (expressed in millions of Euros), we consider the popularity of both the integer and the decimal number, where the latter could only take a value of zero or five during our sample period. The time until the draw is shown in days and hours (before the final 24 hours) or in hours and minutes (during the final 24 hours), and we examine whether a number is chosen more frequently when it appears on the screen as one of these elements. Selecting the numbers in the current date or draw date was always possible, as was selecting the integer of the jackpot size (range: 7–36). The decimal number, and the first and second element of the remaining time could be chosen in 46.8, 96.3, and 86.3% of the cases, respectively.
Table 1, Panel B shows the raw frequencies for these available numbers. All percentages significantly exceed 13.3 by approximately one or two percentage points (z-tests; all p < 0.001).
The raw percentages are, however, biased by a general preference for small numbers that may result from a preference for other (unobserved) meaningful or available numbers, or from other mechanisms. To control for differences in base rates and to also disentangle the effects of the different meaningful and available numbers we perform a logit regression. The dependent variable is the player’s decision to choose (1) or not choose (0) a given number. Hence, each chosen combination generates 45 observations, one for each number (1–45) that could be selected. As explanatory variables we use dummy variables that take the value of 1 for the number that corresponds to the personally meaningful or situationally available number (and 0 otherwise).5 To allow for differences in base rates we include number fixed effects. We follow the common approach of reporting average marginal effects, and correct the standard errors for clustering at the player-number level and the combination level (Cameron, Gelbach & Miller, 2011; Thompson, 2011).
Table 2, Model 1 displays the average marginal effects (in percentage points). All personally meaningful numbers are significantly more likely to be selected. The marginal effect sizes of the day and year of birth are roughly equal: players are approximately 7 percentage points more likely to pick these numbers. The effects for month of birth and age are about half as strong. Postal code numbers are considerably less important, with marginal effect sizes of 0.30 and 0.24 percentage points for the first and last two digits, respectively. The effects of the current date, draw date, and jackpot size are also significant and comparable in size to those of the postal code. The second element of the remaining time has a small but significant effect, whereas the first element is insignificant.
Table 2, Model 2 shows the logit regression results when observations are weighted by the reciprocal of a player’s total number of combinations. When all chosen combinations are weighted equally, as we have done so far, the results may be more representative for frequent players than for the cross-section of players. After weighting, the effects of birthdate, age, current date, draw date, and jackpot numbers are stronger. This implies that infrequent players make more use of these personally meaningful and situationally available numbers, possibly because they use the random number generator less frequently.
Similar patterns emerge in the casino data. The last two digits of the year of birth can be selected by people born between 1900 and 1936. Players in this category entered 4.2% of the combinations. Age can be only chosen by people under 37. This condition is met for 33.1% of all entries. Table 3, Panel A shows how often players pick these personal numbers. All frequencies significantly exceed 2.70% (z-tests; all p < 0.001).6 The results are especially pronounced for the day of birth; players select this number approximately three times as often.
Table 3: Personally meaningful and situationally available numbers in the casino game.
Notes: The number of observations reflects how often players were able to choose the particular number. All frequencies are significantly higher than 2.70% at the 0.1% level.
Table 4: Logit regression results for the casino game.
∗∗ p < .001.
The situationally available numbers that we consider here are the day and month of play, and the numeric values that appear in a player’s voucher code. In 2013, the voucher code was composed of three sets of three symbols that could be either letters or numbers. We extract all numbers between 0 and 36 from each set. For example, from XVH-M51-36Z we extract 5, 1, 3, 6, and 36. On average there are 2.05 such numbers in a voucher code. In 2014, the voucher code was composed of letters alone. Table 3, Panel B shows that whenever players are able to pick a number from the date of play or from the voucher code, they do this significantly more often than 2.70% of the time (z-tests; all p < 0.001).
We perform similar regression analyses as we did for the Lotto data. We correct standard errors for clustering at the player-number level and the level of individual predictions.7
Table 4, Model 1 displays the average marginal effects (in percentage points). The effects of the personally meaningful and situationally available numbers are all significant. Players are 4.7 and 3.3 percentage points more likely to pick their day and year of birth, respectively. Month of birth and age are somewhat less important, with effect sizes of 1.5 and 1.2 percentage points. The average marginal effects for the numbers from the current date are 0.15 percentage points, corresponding to roughly 5.6% of the probability under random selection. The numbers in the voucher codes also play a statistically significant role, but the effect size there is only 0.07 percentage point.
Table 4, Model 2 shows the logit regression results when observations are weighted by the reciprocal of a player’s total number of entries. The effect sizes for birthdate numbers and age are stronger after weighting, suggesting that personally meaningful numbers are more popular among infrequent players. The effect sizes for current date and voucher code are hardly affected.
Figure 5: Center effects in the Lotto game. Notes: Center definitions are indicated with bold rectangles. Differences are expressed in percentage points. Results after excluding number 23 (highlighted in grey) are within parentheses.
Figure 6: Center effects in the casino game. Notes: Center definitions are indicated with bold rectangles. Differences are expressed in percentage points. Results after excluding number 17 (highlighted in grey) are within parentheses.
Players in the Lotto game select their numbers from a given 5 by 9 matrix (Figure 2). In the casino game the set of numbers are presented as on a roulette table, with the numbers 1 through 36 depicted in a 12 by 3 matrix and 0 on top (Figure 4). Multiple studies have shown that people have a tendency to select choice options presented in the middle of a display and avoid the edges. This behavior has been observed with laboratory and field data, for both individual choice and strategic interaction (Christenfeld, 1995; Rubinstein, Tversky & Heller, 1997; Shaw, Bergen, Brown & Gallagher, 2000; Attali & Bar-Hillel, 2003; Raghubir & Valenzuela, 2006; Chandon, Hutchinson, Bradlow & Young, 2009; Atalay, Bodur & Rasolofoarison, 2012; Valenzuela, Raghubir & Mitakakis, 2013; Bar-Hillel, 2015). Closely related to our analyses for lottery games, Bar-Hillel and Zultan (2012) examine the distribution of gamblers’ bets on a roulette table and observe that numbers in the center are more popular.
There are several ways to define the central part of the Lotto form. Figure 5 compares the raw frequencies for numbers in and out of the center for eight definitions. Under each definition, the difference is positive and statistically significant. In relative terms, numbers in the center are 5–13% more likely to be selected than numbers out of the center. The difference is largest if the center region is confined to the number 23 alone. This number in the exact center does not determine the effect in full, as positive and significant differences remain when we exclude it (z-tests; all p < 0.001).
Figure 6 shows that the difference is also positive for all six possible definitions of the center region of the casino game (z-tests; all p < 0.001). In relative terms, numbers in the center are 22–40% more likely to be selected than numbers out of the center. As with Lotto, the center effect is strongest when the center is confined to the most centrally located number (17), but it is not solely driven by this single number.
Weighting observations by the reciprocal of a player’s total number of entries amplifies the center effects in the Lotto game (Figure S3 in the Supplement). In the casino game, however, the results hardly change (Figure S4 in the Supplement). A possible explanation for this difference is that frequent Lotto players are more likely to use the random number generator than infrequent Lotto players. In the casino game there is no such number generator available.8
Figure 7: Recent draw effects in the Lotto game. Notes: (A) displays the average selection frequency of a number that appeared in the previous draw and that of a number that did not appear in the previous draw. (B) displays the average selection frequency of a number conditional on whether it was drawn 0, 1, 2, 3, or 4 times in the preceding six draws. (C) and (D) display the results of similar analyses for the six jackpot colors.
Table 5: Thirty most popular combinations in the Lotto game.
Various lottery studies find that players tend to avoid numbers that were recently drawn (Clotfelter & Cook, 1993; Terrell, 1994; Ding, 2011; Suetens & Tyran, 2012).9 Suetens et al. (2015) document a similar response to the previous draw, but they also find that a number is popular if it appears in multiple recent draws.
The Lotto data comprises 175 draws. Figure 7A compares the average selection frequency of numbers that appeared in the previous draw with that of numbers that did not appear in the previous draw. This simple comparison shows that recent winning numbers are chosen less often than other numbers. Figure 7B displays the average selection frequency of a number conditional on whether it was drawn 0, 1, 2, 3, or 4 times in the preceding six draws. This figure suggests that numbers drawn only once over the past six draws are being avoided, while numbers drawn three or four times are relatively popular. The regression results in Table 2, Model 1 confirm these patterns. Note that the effect sizes are relatively small. This is not surprising because the numbers from previous draws are not readily available to players; players have to make a conscious effort to keep track of those numbers.
Weighting observations by the reciprocal of a player’s total number of combinations changes the effect of the past draw from negative to positive, and amplifies the effects of frequently drawn numbers (Table 2, Model 2). These changes suggest that frequent and infrequent players respond differently to prior draw results. To investigate this in more detail, we perform separate regressions for players who participated only ten or fewer times throughout our sample period (Table 2, Model 3) and for players who participated a thousand times or more (Table 2, Model 4). The results show that infrequent players have a preference for “hot” numbers, whereas frequent players tend to avoid these.
These results can be related to a large literature showing that people have difficulties understanding randomness. In their early work, Tversky and Kahneman (1971) speak of a “belief in the law of small numbers” to describe the misconception that a short sequence of events generated by a random process will have characteristics that closely resemble those of the data generating process (DGP). This false belief leads to the gambler’s fallacy when people know the DGP and to the hot-hand fallacy when people do not know it (Kahneman & Tversky, 1972; Tversky & Kahneman, 1974; Rabin, 2002). When people are asked to produce random sequences for a given DGP, they typically predict too many reversals (O’Neill, 1987; Rapoport & Budescu, 1992, 1997; Bar-Hillel & Wagenaar, 1991). When a random sequence is given for an unknown DGP, people tend to exaggerate the degree to which the DGP will resemble the given sequence of signals, leading to a belief in non-existent variation over time (Gilovich, Vallone & Tversky, 1985; Camerer, 1989; Tversky & Gilovich, 1989). The different behavior of frequent and infrequent Lotto players is in line with the different theoretical underpinnings of the two biases, assuming that frequent players are more familiar with the game and the underlying DGP than infrequent players.
Surprisingly, the results for the jackpot colors are different. Color choices are consistent with the gambler’s fallacy only. Figure 7C shows that the winning color in the previous draw is chosen less often than other colors. Figure 7D shows that the more frequently a color has been drawn in the last six draws, the less frequently players bet on that color.
In the Lotto game there are 8,145,060 possible combinations of numbers that players can choose. Table 5 lists the thirty most frequently selected combinations, ranked by the number of players who selected them. If players were picking their 5,108,343 combinations at random, the likelihood of one or more combinations appearing more than ten times in our data would be 0.1%. The fact that many combinations appear hundreds of times can thus be seen as an extreme deviation from random choice.
Many of the thirty most popular combinations form a numeric sequence or spatial pattern. The majority are composed of a vertical or diagonal line of five numbers, plus a sixth number that connects with one of the endpoints or is located at one of the corners of the form (Figure S5 in the Supplement). Overall, 0.9% of the combinations in our sample can be classified as a diagonal or vertical pattern, which is a significantly greater portion than the 0.009% expected under randomness.
In the casino game, players can choose a number more than once, and the order of the chosen numbers matters. The total number of unique combinations thus equals 374=1,874,161. Table 6 shows the thirty most popular ones, ranked by the total number of times they appear in the data. If our total of 568,987 combinations would be picked completely at random, the likelihood of one or more combinations occurring more than ten times would be virtually zero. In sharp contrast, we observe that many combinations appear hundreds of times. Again, most of the popular combinations form a numeric sequence or spatial pattern. The exceptions in the top thirty represent neighboring numbers on the roulette wheel. Note that the numbers in all thirty combinations are in ascending order. This turns out to reflect a general phenomenon: 33.6% (33.1%) of all combinations are entered in ascending (strictly ascending) order, while only 4.88% (3.52%) would be expected to have that property under randomness.
Table 6: Thirty most popular combinations in the casino game.
Henze (1997) similarly reports that many of the most popular Lotto combinations represent a numeric sequence. In line with the many occurrences of spatial patterns that we observe, Falk, Falk & Ayton (2009) find that aesthetics play an important role in the choices of laboratory subjects.
Figure 8: Difference between the empirical and theoretical spacing distribution in the Lotto game. 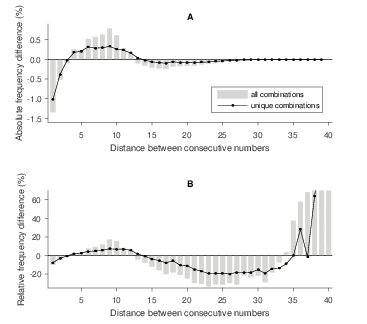
Boland and Pawitan (1999) find that the students in their classroom experiment tended to spread out their selections when asked to randomly generate a Lotto draw. Lien and Yuan (2015) find similar results in data from a Chinese six-number lottery. These results may reflect a form of representativeness bias (Tversky & Kahneman, 1971): if people believe that six draws from a uniform distribution should closely resemble the uniform distribution, they will expect the six numbers to be evenly spread across the possible range and deem clusters unlikely.
To investigate the degree to which Lotto players spread their numbers across the possible range, we compute the five spaces between the six (ordered) numbers for each combination. Next, we compare the empirical distribution of these spaces with the distribution that can be expected under random number choice.10 If people indeed have a tendency to evenly spread their numbers, small and large spaces will be underrepresented.
The bars in Figure 8A reflect the absolute differences between the empirical and theoretical frequencies. In line with a tendency to spread numbers evenly, we observe more medium-sized spaces and fewer small and large spaces than expected by chance. Figure 8B displays the differences as a percentage of the theoretical frequencies (with the vertical axis truncated at 70%). These relative differences follow a similar pattern but are more pronounced for larger spaces due to their smaller theoretical likelihood. Extremely large spaces are highly unlikely in theory, but relatively popular among the players in our sample.
Henze’s (1997) analyses of the most popular combinations in a German number lottery also point out that spacing patterns are not in accordance with randomness, but he cites this as evidence for the popularity of numeric sequences. Indeed, the abnormal spacing patterns that we find in our data could result from a preference for specific numeric sequences or spatial patterns. To rule out that the patterns are caused by specific, popular combinations, we redo the analysis after excluding combinations that occur more than once in our data. The lines in Figure 8 reflect the absolute and relative differences between the empirical and theoretical distribution for the unique combinations only. Albeit somewhat weaker, the resulting patterns have a similar shape.
In the casino game, the three distances between the four numbers can be positive, negative, and zero. Because of the tendency to pick numbers in ascending order, positive spaces are strongly overrepresented (Figure S8 in the Supplement). To analyze spacing effects in isolation from ordering effects, we therefore measure the three distances in each combination after sorting the numbers in ascending order.11
Figure 9 shows the absolute and relative differences between the empirical and theoretical frequencies after sorting. In line with a tendency to spread numbers evenly, and similar to what we found for Lotto, medium-sized spaces are overrepresented. Similar patterns emerge when we reduce the samples to unique combinations only, indicating that the abnormal spacing patterns do not result from specific, popular combinations alone.
Figure 9: Difference between the empirical and theoretical spacing distribution in the casino game. 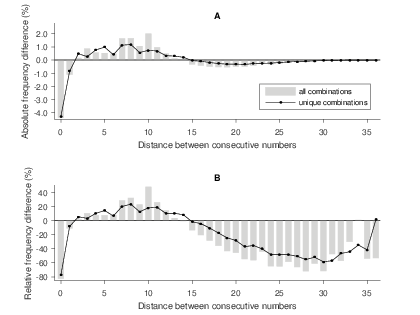
Weighting observations by the reciprocal of a player’s total number of entries amplifies the spacing effects in the Lotto game (Figure S10 in the Supplement), but leaves the casino results virtually unaffected (Figure S11 in the Supplement). This again suggests that frequent Lotto players are more likely to use the random number generator than occasional players.
We have documented a variety of empirical patterns in number choices in lottery games, using data sets that together comprise a total of approximately 33 million selected numbers. The patterns in the two different lottery games are qualitatively very similar. In a quantitative sense the effects are somewhat more pronounced in the casino game than in the Lotto game. This difference can probably be ascribed to the availability of default, computer-generated sets of numbers in the Lotto game, as there is strong evidence that people tend to stick with defaults (Camerer et al., 2003).
In line with earlier findings in the literature, the number 7 is highly popular in both games. Other numbers that consistently rank among the favorites include 3, 5, 8, and 11. More generally, numbers from the lower end of the possible ranges are more popular than numbers from the higher end. Also, in both games players prefer odd numbers over even numbers, prime numbers over non-prime numbers, and non-round numbers over round numbers.
Reinforcing earlier findings in different contexts, players are attracted towards numbers in the center of the choice form. Within each game, the relative location of the numbers on the entry screen is fixed, but between the two games the ordering is different. Regardless of the exact definitions of the center, numbers in the middle are more popular than numbers on the edges.
Using the data we have about individual players’ birthdates and postal codes, we find that players like to pick numbers that have a special meaning to them. Similarly, our analyses with data on dates of play, dates of draw, numbers on entry screens, and numbers in entry codes confirm that players more frequently choose numbers that are situationally available.
Our analyses of the combinations of numbers yield evidence that players care about aesthetics. Combinations that form a numeric sequence or spatial pattern are extremely popular, despite the fact that the parimutuel aspect of both lottery games creates an incentive to strategically attempt to select unique combinations. This suggests that many players do not see or understand the strategic aspect, or that the joy of playing with aesthetically pleasing combinations more than offsets the negative effect on expected payoff (Goodman & Irwin, 2006).
Last, we find that frequent players avoid numbers that appeared in the latest draws, that infrequent players chase these numbers, and that both spread their numbers relatively evenly across the possible range. These results may reflect that players misjudge the likelihood of winning with these numbers or combinations, and fit into a large body of literature that shows that people have difficulties understanding randomness. Moreover, the different responses of frequent and infrequent players to prior draw results accord with a literature arguing that knowing the data generating process leads to a gambler’s-fallacy type of behavior and not knowing it leads to a hot-hand type of behavior.
Agarwal, S., He, J., Liu, H., Png, I. P. L., Sing, T. F., & Wong, W. (2014). Superstition and asset markets: Evidence from Singapore housing. Available at SSRN: ssrn.com/abstract=2416832.
Atalay, A. S., Bodur, H. O., & Rasolofoarison, D. (2012). Shining in the center: Central gaze cascade effect on product choice. Journal of Consumer Research, 39(4), 848–866.
Attali, Y., & Bar-Hillel, M. (2003). Guess where: The position of correct answers in multiple-choice test items as a psychometric variable. Journal of Educational Measurement, 40(2), 109–128.
Bar-Hillel, M. (2015). Position effects in choice from simultaneous displays: A conundrum solved. Perspectives on Psychological Science, 10(4), 419–433.
Bar-Hillel, M., & Wagenaar, W. A. (1991). The perception of randomness. Advances in Applied Mathematics, 12(4), 428–454.
Bar-Hillel, M., & Zultan, R. (2012). We sing the praise of good displays: How gamblers bet in casino roulette. Chance, 25(2), 27–30.
Beckert, J., & Lutter, M. (2013). Why the poor play the lottery: Sociological approaches to explaining class-based lottery play. Sociology, 47(6), 1152–1170.
Beggan, J. K. (1992). On the social nature of nonsocial perception: The mere ownership effect. Journal of Personality and Social Psychology, 62(2), 229–237.
Bhattacharya, U., Kuo, W., Lin, T., & Zhao, J. (2016). Do superstitious traders lose money? Available at SSRN: ssrn.com/abstract=2478124.
Boland, P. J., & Pawitan, Y. (1999). Trying to be random in selecting numbers for Lotto. Journal of Statistics Education, 7(3).
Bopp, M., & Faeh, D. (2008). End-digits preference for self-reported height depends on language. BMC Public Health, 8(342).
Bourassa, S. C., & Peng, V. S. (1999). Hedonic prices and house numbers: The influence of feng shui. International Real Estate Review, 2(1), 79–93.
Brown, P., Chua, A., & Mitchell, J. (2002). The influence of cultural factors on price clustering: Evidence from Asia–Pacific stock markets. Pacific–Basin Finance Journal, 10(3), 307–332.
Brown, P., & Mitchell, J. (2008). Culture and stock price clustering: Evidence from the Peoples’ Republic of China. Pacific–Basin Finance Journal, 16(1), 95–120.
Cai, B. M., Cai, C. X., & Keasey, K. (2007). Influence of cultural factors on price clustering and price resistance in China’s stock markets. Accounting and Finance, 47(4), 623–641.
Camerer, C. F. (1989). Does the basketball market believe in the “hot hand”? American Economic Review, 79(5), 1257–1261.
Camerer, C. F., Issacharoff, S., Loewenstein, G., O’Donoghue, T., & Rabin, M. (2003). Regulation for conservatives: Behavioral economics and the case for “asymmetric paternalism”. University of Pennsylvania Law Review, 151(3), 1211–1254.
Cameron, A. C., Gelbach, J. B., & Miller, D. L. (2011). Robust inference with multiway clustering. Journal of Business & Economic Statistics, 29(2), 238–249.
Chandon, P., Hutchinson, J. W., Bradlow, E. T., & Young, S. H. (2009). Does in-store marketing work? Effects of the number and position of shelf facings on brand attention and evaluation at the point of purchase. Journal of Marketing, 73(6), 1–17.
Chau, K., Ma, V. S. M., & Ho, D. C. W. (2001). The pricing of “luckiness” in the apartment market. Journal of Real Estate Literature, 9(1), 29–40.
Chernoff, H. (1981). How to beat the Massachusetts numbers game. Mathematical Intelligencer, 3(4), 166–172.
Chong, T. T., & Du, X. (2008). Hedonic pricing models for vehicle registration marks. Pacific Economic Review, 13(2), 259–276.
Christenfeld, N. (1995). Choices from identical options. Psychological Science, 6(1), 50–55.
Clotfelter, C. T., & Cook, P. J. (1993). The gambler’s fallacy in lottery play. Management Science, 39(12), 1521–1525.
Cook, P. J., & Clotfelter, C. T. (1993). The peculiar scale economies of lotto. American Economic Review, 83(3), 634–643.
Cox, S. J., Daniell, G. J., & Nicole, D. A. (1998). Using maximum entropy to double one’s expected winnings in the UK national lottery. Journal of the Royal Statistical Society: Series D (the Statistician), 47(4), 629–641.
De Lotto. (2014). De Lotto jaarverslag (annual report) 2014. Retrieved from: www.delotto.nl/files/De\%20Lotto/DeLottoJaarverslag2014-webversie.pdf.
D’Hondt, W., & Vandewiele, M. (1983). Colors and figures in Senegal. Perceptual and Motor Skills, 56(3), 971–978.
Ding, J. (2011). What numbers to choose for my lottery ticket? Behavior anomalies in the Chinese online lottery market. Available at SSRN: ssrn.com/abstract=1926526.
Falk, R., Falk, R., & Ayton, P. (2009). Subjective patterns of randomness and choice: Some consequences of collective responses. Journal of Experimental Psychology: Human Perception and Performance, 35(1), 203–224.
Farrell, L., Hartley, R., Lanot, G., & Walker, I. (2000). The demand for lotto: The role of conscious selection. Journal of Business & Economic Statistics, 18(2), 228–241.
Finkelstein, M. (1995). Estimating the frequency distribution of the numbers bet on the California lottery. Applied Mathematics and Computation, 69(2), 195–207.
Fortin, N. M., Hill, A. J., & Huang, J. (2014). Superstition in the housing market. Economic Inquiry, 52(3), 974–993.
Gilovich, T., Vallone, R., & Tversky, A. (1985). The hot hand in basketball: On the misperception of random sequences. Cognitive Psychology, 17(3), 295–314.
Goodman, J. K., & Irwin, J. R. (2006). Special random numbers: Beyond the illusion of control. Organizational Behavior and Human Decision Processes, 99(2), 161–174.
Greenwald, A. G., & Banaji, M. R. (1995). Implicit social cognition: Attitudes, self-esteem, and stereotypes. Psychological Review, 102(1), 4–27.
Guryan, J., & Kearney, M. S. (2008). Gambling at lucky stores: Empirical evidence from state lottery sales. American Economic Review, 98(1), 458–473.
Haigh, J. (1997). The statistics of the national lottery. Journal of the Royal Statistical Society: Series A (Statistics in Society), 160(2), 187–206.
Halpern, A. R., & Devereaux, S. D. (1989). Lucky numbers: Choice strategies in the Pennsylvania daily number game. Bulletin of the Psychonomic Society, 27(2), 167–170.
He, Y., & Wu, C. (2006). Is stock price rounded for economic reasons in the Chinese markets? Global Finance Journal, 17(1), 119–135.
Henze, N. (1997). A statistical and probabilistic analysis of popular lottery tickets. Statistica Neerlandica, 51(2), 155–163.
Heywood, S. (1972). The popular number seven or number preference. Perceptual and Motor Skills, 34(2), 357–358.
Hirshleifer, D. A., Jian, M., & Zhang, H. (2014). Superstition and financial decision making. Available at SSRN: ssrn.com/abstract=1460522.
Joe, H. (1987). An ordering of dependence for distribution of k-tuples, with applications to lotto games. Canadian Journal of Statistics, 15(3), 227–238.
Jones, J. T., Pelham, B. W., Mirenberg, M. C., & Hetts, J. J. (2002). Name letter preferences are not merely mere exposure: Implicit egotism as self-regulation. Journal of Experimental Social Psychology, 38(2), 170–177.
Kahneman, D., & Tversky, A. (1972). Subjective probability: A judgment of representativeness. Cognitive Psychology, 3(3), 430–454.
Kearney, M. S., Tufano, P., Guryan, J., & Hurst, E. (2011). Making savers winners: An overview of prize-linked saving products. In O. S. Mitchell, & A. Lusardi (Eds.), Financial literacy: Implications for retirement security and the financial marketplace (pp. 218–240) Oxford University Press.
Kitayama, S., & Rarasawa, M. (1997). Implicit self-esteem in Japan: Name letters and birthday numbers. Personality and Social Psychology Bulletin, 23(7), 736–742.
Klesges, R. C., Debon, M., & Ray, J. W. (1995). Are self-reports of smoking rate biased? Evidence from the Second National Health and Nutrition Examination Survey. Journal of Clinical Epidemiology, 48(10), 1225–1233.
Kubovy, M. (1977). Response availability and the apparent spontaneity of numerical choices. Journal of Experimental Psychology: Human Perception and Performance, 3(2), 359–364.
Kubovy, M., & Psotka, J. (1976). The predominance of seven and the apparent spontaneity of numerical choices. Journal of Experimental Psychology: Human Perception and Performance, 2(2), 291–294.
Kuloğlu, M., Atmaca, M., Tezcan, A. E., Unal, A., & Gecici, O. (2002). Color and number preferences of patients with psychiatric disorders in eastern Turkey. Perceptual and Motor Skills, 94(1), 207–213.
Lien, J. W., & Yuan, J. (2015). The cross-sectional “gambler’s fallacy”: Set representativeness in lottery number choices. Journal of Economic Behavior & Organization, 109, 163–172.
Lien, J. W., Yuan, J., & Zheng, J. (2015). Representativeness biases and lucky store effects. Available at SSRN: ssrn.com/abstract=2635427.
Milikowski, M. (1995). Knowledge of numbers (Unpublished doctoral thesis). University of Amsterdam.
Morewedge, C. K., Shu, L. L., Gilbert, D. T., & Wilson, T. D. (2009). Bad riddance or good rubbish? Ownership and not loss aversion causes the endowment effect. Journal of Experimental Social Psychology, 45(4), 947–951.
Ng, T., Chong, T. T., & Du, X. (2010). The value of superstitions. Journal of Economic Psychology, 31(3), 293–309.
Nuttin, J. M. (1985). Narcissism beyond gestalt and awareness: The name letter effect. European Journal of Social Psychology, 15(3), 353–361.
Nuttin, J. M. (1987). Affective consequences of mere ownership: The name letter effect in twelve European languages. European Journal of Social Psychology, 17(4), 381–402.
O’Neill, B. (1987). Nonmetric test of the minimax theory of two-person zerosum games. Proceedings of the National Academy of Sciences of the United States of America, 84(7), 2106–2109.
Oyeleke, O. B., & Otekunrin, O. A. (2014). On the performance of lottery winning strategies: A case study of Oyo State Lottery, Nigeria. British Journal of Mathematics & Computer Science, 4(17), 2557–2569.
Papachristou, G., & Karamanis, D. (1998). Investigating efficiency in betting markets: Evidence from the Greek 6/49 Lotto. Journal of Banking & Finance, 22(12), 1597–1615.
Pelham, B. W., Carvallo, M., & Jones, J. T. (2005). Implicit egotism. Current Directions in Psychological Science, 14(2), 106-110.
Philbrick, J. L. (1976). Blue seven in East Africa: Preliminary report. Perceptual and Motor Skills, 42(2), 484.
Plug, C. (1977). Number preferences in ratio estimation and constant-sum scaling. American Journal of Psychology, 90(4), 699–704.
Pope, D., & Simonsohn, U. (2011). Round numbers as goals: Evidence from baseball, SAT takers, and the lab. Psychological science, 22(1), 71–79.
Rabin, M. (2002). Inference by believers in the law of small numbers. Quarterly Journal of Economics, 117(3), 775–816.
Raghubir, P., & Valenzuela, A. (2006). Center-of-inattention: Position biases in decision-making. Organizational Behavior and Human Decision Processes, 99(1), 66–80.
Rapoport, A., & Budescu, D. V. (1992). Generation of random series in two-person strictly competitive games. Journal of Experimental Psychology: General, 121(3), 352–363.
Rapoport, A., & Budescu, D. V. (1997). Randomization in individual choice behavior. Psychological Review, 104(3), 603–617.
Roger, P., & Broihanne, M. (2007). Efficiency of betting markets and rationality of players: Evidence from the French 6/49 Lotto. Journal of Applied Statistics, 34(6), 645–662.
Rubinstein, A., Tversky, A., & Heller, D. (1997). Naive strategies in competitive games. In W. Albers, W. Güth, P. Hammerstein, B. Moldovanu & E. van Damme (Eds.), Understanding strategic interaction: Essays in honor of Reinhard Selten (pp. 394–402). Berlin: Springer-Verlag.
Saito, M. (1999). “Blue and seven phenomena” among Japanese students. Perceptual and Motor Skills, 89(2), 532–536.
Scoggins, J. F. (1995). The lotto and expected net revenue. National Tax Journal, 48(1), 61–70.
Shaw, J. I., Bergen, J. E., Brown, C. A., & Gallagher, M. E. (2000). Centrality preferences in choices among similar options. Journal of General Psychology, 127(2), 157–164.
Shum, M., Sun, W., & Ye, G. (2014). Superstition and “lucky” apartments: Evidence from transaction-level data. Journal of Comparative Economics, 42(1), 109–117.
Silver, N. C., McCulley, W. L., Chambliss, L. N., Charles, C. M., Smith, A. A., Waddell, W. M., & Winfield, E. B. (1988). Sex and racial differences in color and number preferences. Perceptual and Motor Skills, 66(1), 295–299.
Simon, J. (1999). An analysis of the distribution of combinations chosen by UK national lottery players. Journal of Risk and Uncertainty, 17(3), 243–276.
Simon, W. E. (1971). Number and color responses of some college students: Preliminary evidence for a “blue seven phenomenon”. Perceptual and Motor Skills, 33(2), 373–374.
Simon, W. E., & Primavera, L. H. (1972). Investigation of the “blue seven phenomenon” in elementary and junior high school children. Psychological Reports, 31(1), 128–130.
Stern, H., & Cover, T. M. (1989). Maximum entropy and the lottery. Journal of the American Statistical Association, 84(408), 980–985.
Suetens, S., Galbo-Jørgensen, C. B., & Tyran, J. K. (2015). Predicting lotto numbers: A natural experiment on the gambler’s fallacy and the hot hand fallacy. Journal of the European Economic Association. doi: 10.1111/jeea.12147.
Suetens, S., & Tyran, J. K. (2012). The gambler’s fallacy and gender. Journal of Economic Behavior & Organization, 83(1), 118–124.
Sundali, J. & Croson, R. (2006). Biases in casino betting: The hot hand and the gambler’s fallacy. Judgment and Decision Making, 1(1): 1–12.
Teigen, K. H. (1983). Studies in subjective probability l: Prediction of random events. Scandinavian Journal of Psychology, 24(1), 13–25.
Terrell, D. (1994). A test of the gambler’s fallacy: Evidence from pari-mutuel games. Journal of Risk and Uncertainty, 8(3), 309–317.
Thompson, S. B. (2011). Simple formulas for standard errors that cluster by both firm and time. Journal of Financial Economics, 99(1), 1–10.
Trueman, J. (1979). Existence and robustness of the blue and seven phenomena. Journal of General Psychology, 101(1), 23–26.
Tversky, A., & Gilovich, T. (1989). The “hot hand”: Statistical reality or cognitive illusion? Chance, 2(4), 31–34.
Tversky, A., & Kahneman, D. (1971). Belief in the law of small numbers. Psychological Bulletin, 76(2), 105–110.
Tversky, A., & Kahneman, D. (1974). Judgment under uncertainty: Heuristics and biases. Science, 185(4157), 1124–1131.
Valenzuela, A., Raghubir, P., & Mitakakis, C. (2013). Shelf space schemas: Myth or reality? Journal of Business Research, 66(7), 881–888.
Vandewiele, M., D’Hondt, W., Didillon, H., Iwawaki, S., & Mwamwenda, T. (1986). Number and color preferences in four countries. Perceptual and Motor Skills, 63(2), 945–946.
Wiegersma, S., & de Klerck, I. (1984). The “blue phenomenon” is red in the Netherlands. Perceptual and Motor Skills, 59(3), 790.
Wiegersma, S., & van der Elst, G. (1988). “Blue phenomenon”: Spontaneity or preference? Perceptual and Motor Skills, 66(1), 308–310.
Woo, C., Horowitz, I., Luk, S., & Lai, A. (2008). Willingness to pay and nuanced cultural cues: Evidence from Hong Kong’s license-plate auction market. Journal of Economic Psychology, 29(1), 35–53.
Woo, C., & Kwok, R. H. F. (1994). Vanity, superstition and auction price. Economics Letters, 44(4), 389–395.
Copyright: © 2016. The authors license this article under the terms of the Creative Commons Attribution 3.0 License.
This document was translated from LATEX by HEVEA.