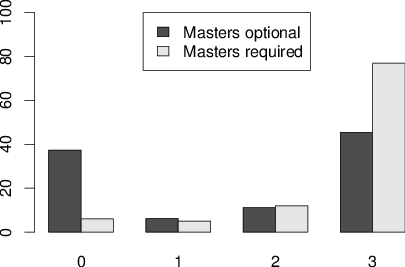
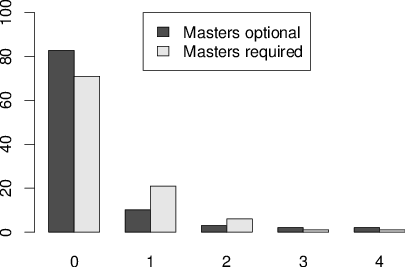
| Figure 1: Percentage of subjects exposed to 0, 1, 2, 3 or 4 questions. Top panel is CRT. Bottom panel is CRT-2. |
Judgment and Decision Making, Vol. 11, No. 1, January 2016, pp. 99-113
Investigating an alternate form of the cognitive reflection testKeela S. Thomson* Daniel M. Oppenheimer* |
Much research in cognitive psychology has focused on the tendency to
conserve limited cognitive resources. The CRT is the predominant
measure of such miserly information processing, and also predicts a
number of frequently studied decision-making traits (such as belief
bias and need for cognition). However, many subjects from common
subject populations have already been exposed to the questions,
which might add considerable noise to data. Moreover, the CRT has
been shown to be confounded with numeracy. To increase the pool of
available questions and to try to address numeracy confounds, we
developed and tested the CRT-2. CRT-2 questions appear to rely less
on numeracy than the original CRT but appear to measure closely
related constructs in other respects. Crucially, substantially fewer
subjects from Amazon’s Mechanical Turk have been previously exposed
to CRT-2 questions. Though our primary purpose was investigating the
CRT-2, we also found that belief bias questions appear suitable as
an additional source of new items. Implications and remaining
measurement challenges are discussed.
Keywords: cognitive reflection, CRT.
The CRT is one of the most widely used instruments in heuristics-and-biases research. It is designed to measure a person’s propensity to override an intuitive, but incorrect, response with a more analytical correct response (Frederick, 2005). Miserly processing (the tendency not to override the intuitive response) as measured by the CRT is frequently associated with non-normative responses across a number of cognitive domains.
CRT performance has been linked with an extensive list of rational thinking tasks. For example, Frederick (2005) found relationships between CRT scores and time preference (preference for immediate versus delayed outcomes), risk preference (preference for risky versus certain outcomes), and need for cognition (a tendency to enjoy effortful thinking). CRT scores are also related to belief bias (the tendency to be influenced by the believability of the conclusion when evaluating the validity of logical arguments) and denominator neglect (the tendency to focus on the number of a particular kind of outcome, the numerator, without considering the total number of possible events, the denominator; Toplak, West & Stanovich, 2014a).
In addition, CRT scores have been linked with: SAT scores (Frederick, 2005; Obrecht, Chapman & Gelman, 2009), frequency of choices consistent with expected value (Cokely & Kelley, 2009; Oechssler, Roider & Schmitz, 2009), the likelihood of committing the conjunction fallacy (Oechssle et al., 2009), probability updating, base rate neglect, under- and over-confidence (Hoppe & Kusterer, 2011), regression to the mean, errors in Bayesian reasoning, framing effects (Toplak, West & Stanovich, 2011), Wason selection task performance, (Toplak et al., 2014a), using and endorsing maximizing strategies on probabilistic prediction tasks (Koehler & James, 2010), and a reduction in the degree to which people underweight sample size and standard deviation in making pairwise comparisons (Obrecht, Chapman & Gelman, 2007). CRT scores have also been associated with utilitarian moral judgments (Paxton, Ungar & Greene, 2012; Royzman, Landy & Leeman, 2014; Baron, Scott, Fincher & Metz, 2015).
In fact, Toplak et al. (2011) found that the CRT better predicted performance on a composite of 15 separate rational-thinking tasks than either intelligence measures or measures of executive functioning. They suggest that a major strength of the CRT is that it is a direct measure of miserly processing as opposed to a self-report measure (as is the case for most other measures of thinking dispositions), and that the CRT goes beyond measures of cognitive ability by examining the depth of processing that is actually used.
Unsurprisingly, there is a high degree of interest in studying cognitive reflection using the CRT. However, the CRT is so widely used that subject pools may be polluted, so that many subjects are already familiar with the questions (Toplak et al., 2014a; Baron et al., 2015; Chandler, Mueller & Paolacci, 2014). Frederick’s original publication of the CRT has over 1,300 citations on Google Scholar. The iconic “bat and ball” question has appeared in popular non-fiction books such as Kahneman’s Thinking, Fast and Slow (Kahneman, 2011), and mainstream media outlets like The New York Times (Postrel, 2006) and Business Insider (Lubin, 2012), which means that many potential subjects have been exposed to CRT questions. Moreover, the CRT is frequently taught in introductory psychology and cognitive science courses, which are the source of many university subject pools.
We should be particularly concerned with samples drawn from Amazon’s Mechanical Turk (MTurk). Though a cheap and convenient method of collecting data, MTurk presents its own unique challenges with respect to subject pool contamination. Workers on MTurk may remain subjects for longer than the typical undergraduates from a university subject pool and often complete a higher volume of studies, thus gaining more opportunity for exposure to common research paradigms. In one study’s sample, the average MTurk worker had completed a staggering 1,500 MTurk jobs, of which 300 were academic studies (Rand et al., 2014). Another recent analysis found that it takes about seven months for half of the pool of workers to be replaced (Stewart et al., 2015).
The issue of prior exposure may be further exacerbated by the fact that the pool of available workers is smaller than might be assumed. A recent analysis using capture-recapture analysis found that the average lab samples from a pool of about 7,300 MTurk workers (so a lab’s reach in practice is much smaller than the population of 50,000 advertised by Amazon; Stewart et al., 2015). Further, a small number of extremely active workers within this pool (sometimes referred to as “professional” subjects) are responsible for large proportion of study responses (Chandler et al., 2014; Berinsky, Huber & Lenz, 2012). Chandler et al. (2014) pooled MTurk data from several collaborating labs and found that 41% of the responses were generated by only 10% of respondents. Across seven studies conducted by Berinsky and colleagues (2012) with over 1,500 unique subjects, 30% of subjects had participated in more than one study (the mean number of studies completed per subject was 1.7). Similarly, Stewart et al. (2015) find high rates of repeated participation within laboratories. Further, the majority of workers “follow” favorite requesters, and this practice is more common among the most prolific workers (Chandler et al., 2014).
Although we are not aware of prior work that has directly tested the extent of prior exposure, there is evidence that the high participation rate among MTurk workers actually does translate to contamination. One study of 300 workers found that a concerningly high proportion of workers reported previous exposure to several common research paradigms (Chandler et al., 2014). The two most commonly encountered paradigms (the prisoner’s dilemma and the ultimatum game) had been seen previously by more than half of the subjects. Prior exposure can substantially affect study results: using non-naïve subjects can reduce effect sizes (Chandler, Paolacci, Peer, Mueller & Ratliff, 2015), and practice effects have increased scores on cognitive measures such as the Wisconsin card sorting task (Basso, Bornstein & Lang, 1999). In fact, Chandler et al. (2014) selected the CRT to study practice effects since it is well-known that the CRT is commonly used on MTurk. Although they did not directly measure the proportion of respondents who had been previously exposed to the CRT, they found that CRT scores could be predicted by the number of studies that workers had previously completed.
In order to assess the extent to which prior exposure actually poses a problem for studies using the CRT, we administered the CRT to 200 subjects on MTurk along with a rational thinking battery including a belief bias measure, a numeracy scale, a denominator neglect measure, and the 18 question need for cognition scale.1 In our sample, 72% of subjects reported prior exposure to at least one of the CRT questions. Subjects who reported prior exposure answered significantly more CRT questions correctly (M = 1.90, N = 144) than those who did not (M = 1.29, N = 56), t(198) = 3.264, p = .001. Thus, in our sample, prior exposure did inflate CRT scores, suggesting that scores should not be compared across subjects who have and those who have not been previously exposed. We present further evidence on this point in the Discussion section.
In order to help deal with over-exposure to the CRT we developed and tested a group of new CRT questions. Importantly, as mentioned above, Chandler et al. (2014) found that CRT performance was positively correlated with MTurk experience (suggesting practice effects), but this was not the case for new but conceptually equivalent CRT items.
Other researchers have also noticed the problem and have begun writing new questions. Toplak and colleagues (2014a) tested four new CRT questions, examining their relationship with a number of dispositional thinking measures such as framing problems, denominator neglect, and belief bias syllogistic reasoning. Baron et al. (2015) also used several new types of CRT-like questions, including arithmetic questions parallel in structure to Frederick’s original items, belief bias questions, and logical syllogism reasoning questions.2 Additionally, when Frederick originally created the CRT, he wrote an eight-item version, and has more recently developed a ten-item version as well (S. Frederick, personal communication, October 23, 2015). Primi, Morsanyi, Chiesi, Donati and Hamilton (2015) also tested several new CRT items (including some of Frederick’s new items) to create the CRT-Long, which was developed largely to address floor effects in populations including developmental samples. Finally, Ackerman and Zalmanov (2012) developed a list of 12 misleading questions, including the three from the original CRT and several tricky math problems adapted from the GMAT. The authors did not specifically investigate whether the problems might be used to create a new measure of cognitive reflection, but did note that they were the same type of problem typically used to study dual process theories. Their problem list was not printed in the article, but it was published in full in Ackerman (2014).
Even aside from concerns about prior exposure, additional questions may be helpful in addressing other issues with the CRT. First, researchers find floor effects with many populations (Frederick, 2005; Toplak et al., 2014a; Ackerman & Zalmanov, 2012), which can limit the range of populations that can be sampled and the generalizability of the findings. For example, Frederick (2005) found average scores above 1.5 (50% correct) only among elite university students.
Further, correctly answering the CRT questions requires numerical ability. Numerous studies have found correlations between the CRT and numeracy, ranging from 0.31 to 0.51 (Campitelli & Gerrans, 2014; Cokely & Kelley, 2009; Liberali, Reyna, Furlan, Stein & Pardo, 2012; Finucane & Gullion, 2010; Weller et al., 2013; Welsh, Burns & Delfrabbo, 2013). It is possible that this numeracy confound causes or contributes to observed gender differences such that men typically score higher than women on the CRT (e.g., Frederick, 2005). A large body of research suggests that the CRT measures both cognitive reflection and numeracy (Böckenholt, 2012; Campitelli & Gerrans, 2014; Sinayev & Peters, 2015; Del Missier, Mäntylä & Bruine de Bruin, 2012; Welsh et al., 2013, but see Liberali et al. 2012 for an alternative perspective).
Sinayev and Peters (2015) explain nicely how three-category coding can be used to begin to tease apart the contributions of both cognitive reflection and numeracy to the CRT. According to the cognitive reflection hypothesis, first the intuitive answer comes to mind and is either rejected or not depending on the level of cognitive reflection. If the intuitive response is rejected, the subsequent response may be calculated correctly or incorrectly depending on numeracy skills. Thus, whereas traditionally CRT answers are scored as either correct or incorrect, cognitive reflection can be separated from numeracy by using three response categories: intuitive errors, non-intuitive errors, and non-intuitive correct responses. Here, cognitive reflection is defined as the propensity to give non-intuitive responses, and numeracy is defined as the ability to calculate the correct answer given that the intuitive answer was rejected (Sinayev & Peters, 2015).
As it has been demonstrated previously that numerical ability is related to rational thinking measures (Peters et al., 2006; Peters et al., 2009; see Reyna, Nelason, Han & Dieckman, 2009; Peters, 2012, for reviews), Sinayev and Peters (2015) further investigated whether it is the numerical ability or the cognitive reflection component of the CRT that predicts performance on rational thinking measures. They found that, although the CRT measures both cognitive reflection and numeracy, numeracy accounted for the CRT’s ability to predict normative decision-making, and cognitive reflection (as defined by not accepting the intuitive answer) did not provide any additional predictive power.
While there is disagreement about the extent to which current CRT questions are distinct from numeracy, it is clear that numeracy is one component of performance. Thus, there are two major issues for cognitive reflection research using the CRT going forward: 1) over-exposure to the CRT may undermine data validity, and 2) it is difficult to disentangle cognitive reflection from numeracy; using math problems means that the CRT is probably affected by specific knowledge acquired in school. To help address these issues, we sought to develop and validate new CRT questions to contribute to the set of available questions. Our questions address the noted need for more verbal CRT-type questions (Baron et al., 2015), in an attempt to help researchers examine the effects of cognitive reflection in the absence of numeracy confounds.
We developed a set of cognitive reflection items (called the CRT-2) that were similar in structure to the original CRT. The CRT-2 consists of four short questions that generate an initial intuitive, but incorrect, answer. The questions were found by searching for “trick questions” and “brain teasers” online. The questions have high face validity, and, in order to address some criticisms of the original CRT, do not require a high degree of mathematical sophistication to generate the correct answer. They are as follows:
Study 1 had two goals: 1) to ascertain the extent of subject pool pollution in two subpopulations of workers in Amazon’s Mechanical Turk, and 2) to determine whether MTurk subjects had been less exposed to the items of the CRT-2.
Two hundred workers on Amazon’s Mechanical Turk participated in the study. Because researchers can restrict the types of eligible workers and thus sample different populations, 100 responses were collected from a batch of Masters workers5 (Masters-required sample), and 100 responses were collected from a batch that did not require a Masters certification (Masters-optional sample). Batches were launched simultaneously, and workers were prevented from taking both surveys using the Unique Turker Service website (http://uniqueturker.myleott.com/). In both pools, we restricted access to only workers who have at least a 95% approval rating, since this is a commonly used restriction (e.g., Chandler et al., 2014; Berinsky et al., 2012).
Subjects answered the original CRT, CRT-2, and four decoy questions (Appendix B) intermixed in a random order chosen for each subject. Decoy questions were included to determine the rate of overclaiming prior exposure. They were written to have a similar format to the CRT and CRT-2 questions, be easy to answer, and be completely novel so that subjects could not have seen them before. Immediately after each item, subjects were asked whether they had seen that question prior to taking the survey.
One subject from the Masters-optional sample was removed from analysis for apparently random responding.
A very high percentage of subjects had been exposed to at least one question from the CRT: 62.6% from the Masters-optional and 94.0% from the Masters-required sample. For the CRT-2, 17.2% of the Masters-optional sample and 29.0% of the Masters-required sample had been exposed to at least one of the questions. Crucially, subjects were less likely to have been exposed to the CRT-2 than to the CRT in both the Masters-optional sample, t(98) = 7.406, p < .001, and the Masters-required sample, t(99) = 13.559, p < .001. Overclaiming of prior exposure was minimal; only 2.0% of the Masters-optional sample and 0.0% of the Masters-required sample reported having seen any of the decoy questions before.
The total number of questions subjects had previously seen from the CRT and the CRT-2 was also analyzed. Subjects recognized fewer questions on average from the CRT-2 (M = .30) than the CRT (M = 1.65) in the Masters-optional sample, t(98) = 8.915, p < .001, and also recognized fewer questions from the CRT-2 (M = .40) than the CRT (M = 2.60) in the Masters-required sample, t(99) = 21.063, p < .001. However, most subjects who reported prior exposure to any of the CRT questions reported exposure to all three (but this was not true for the CRT-2; see Figure 1). Generally, there were not strong differences in exposure between the individual CRT and CRT-2 questions.
Figure 1: Percentage of subjects exposed to 0, 1, 2, 3 or 4 questions. Top panel is CRT. Bottom panel is CRT-2.
Anecdotally, it is well-known among researchers in judgment and decision-making that MTurk is a corrupted subject pool for studying cognitive reflection. This issue has been discussed in publications (Toplak, West & Stanovich, 2014; Baron et al., 2015; Chandler et al., 2014), but never empirically tested. The present results confirm that exposure rates to the CRT are remarkably high. Although there is some reported exposure to the CRT-2, the exposure rates are far lower, indicating that it might help address this problem. However, although the questions have high face validity, they require validation before they can be used in place of the original CRT questions.
Study 1 confirmed that subject pool pollution is stronger for the CRT than the CRT-2 questions. In Study 2, we asked whether the CRT-2 is similar to the CRT in its relationships to other cognitive measures. We also sought to test our intuition that the CRT-2 questions do not require the same numerical sophistication to answer as the original CRT by examining the CRT-2’s relationship with numeracy. Although we originally set out to investigate the CRT-2 questions, we also found that belief bias fared equally well as a source of items to measure cognitive reflection.
143 subjects from the UCLA undergraduate subject pool completed the study (M age = 20.50 years, SD = 2.686; 68% female). The pool consists of students who are currently enrolled in undergraduate psychology classes at UCLA and who take part in studies to meet part of a course requirement or for extra credit. Sample sizes for individual items were variable because nine subjects did not finish the study (because they exceeded the time limit of the study session), and some additional cells are missing due to unanswered questions and uninterpretable responses. Scores for each scale were calculated only for subjects who gave answers to every question on the scale. Each test was run with all of the data available for that analysis.
Subjects took the original CRT, the CRT-2, and several other rational thinking measures that have a demonstrated relationship with CRT scores. Subjects completed tasks in the following order: belief bias, numeracy scale, time preference, risk preference, need for cognition (short scale), and demographic questions. The CRT and CRT-2 were intermixed with the numeracy questions in a random order chosen for each subject, and five denominator neglect questions were distributed throughout the study, separated by the other tasks. At the end of the study, subjects were asked to indicate whether they had seen any of the questions before and to provide details about which questions they had seen in a free response box. Subjects were also asked whether they had been trained in logical syllogisms, and to provide details about the training. Descriptions of each task follow.
The CRT and CRT-2 scores were calculated as the number of items correct on each scale. In order to validate that respondents who answered incorrectly were tempted by the intuitive lures, a second coding system split the responses into three categories: correct, intuitive error, and other, which included both non-intuitive errors and “I don’t know” type responses.
Belief bias is defined as the tendency to be influenced by the believability of the conclusion when evaluating whether an argument is logically valid. Subjects indicated whether eight logical syllogisms were valid or invalid. As in Toplak et al. (2014a), the syllogisms were adapted from Markovits and Nantel (1989; see Appendix C for items). Every syllogism had either an invalid argument paired with a believable conclusion or a valid argument paired with an unbelievable conclusion. Subjects had to check a box indicating they understood the instructions and were informed that an experimenter was nearby to answer questions.
Notably, correctly answering a belief bias question requires overcoming an intuitive reaction to respond based on how believable the conclusion is. Baron et al. (2015) actually included belief bias items in their extended CRT measure, finding that the belief bias items predicted moral reasoning as well as other CRT items, in addition to having generally high correlations with the extended CRT measure.
Subjects answered three general numeracy questions (Schwartz, Woloshin, Black & Welch, 1997), as well as eight additional expanded numeracy questions (Lipkus, Samsa & Rimer, 2001). The general and expanded scale questions were designed to assess facility with understanding probability and risk magnitudes, and with converting numbers between percentage, proportion, and probability formats. For questions that required subjects to convert formats, responses not reported in the desired format were counted incorrect. Responses that did not fully solve for the answer (e.g., saying “half the time” instead of calculating an exact number) were also counted incorrect.
The time preference measure was adapted from Frederick (2005). Frederick administered 17 items (labeled items a-q), including questions asking subjects to indicate their preference between smaller-sooner rewards and larger-later rewards, along with several other question types to deduce subjects’ time preferences. For eight of these items, Frederick found a significant difference between the responses of subjects who scored low (0 of 3 items correct) versus those who scored high (3 of 3 items correct) on the CRT. Those eight items were administered in the present study (see Appendix D for items). Items n-q were answered on an 11-point scale that ranged from –5 (much less than the average person taking this survey today) to +5 (much more than the average person taking this survey today).
The risk preference measure was adapted from Frederick (2005). Frederick administered 18 questions which asked subjects to choose between sure outcomes and gambles in the domains of both gains and losses. Questions included three different types of gambles: certain gains versus higher expected value gambles, certain gains versus lower expected value gambles, and certain losses versus lower expected value gambles. For eleven of these items, Frederick found a significant difference between the responses of subjects in the low versus high groups on the CRT. Those eleven items were administered (see Appendix E for items). Notably, none of these were certain gains versus lower expected value gamble questions.
Subjects completed the 18-item short need for cognition scale assessing their tendency to engage in and enjoy effortful thinking (Cacioppo, Petty & Kao, 1996), answering on a scale from 1 (extremely uncharacteristic) to 5 (extremely characteristic).
Table 1: Intercorrelations (Spearman) among CRT and CRT-2.
Item CRT CRT-2 CRT Q1 CRT Q2 CRT Q3 CRT-2 Q1 CRT-2 Q2 CRT-2 Q3 CRT-2Q4 + p ≤ .10; *, p ≤ .05; **, p ≤ .01; ***, p ≤ .001.
As in Toplak et al. (2014a), five denominator neglect problems were adapted from Kirkpatrick and Epstein (1992). Subjects were asked about their preference to select a marble from a small tray which contained fewer “winning” marbles but a higher relative likelihood of winning (due to the presence of few “losing” marbles), or a large tray, with more “winning” marbles but a lower relative chance of winning (due to the presence of many “losing” marbles). Subjects answered each question on a scale from 1 (“I would definitely pick from the small tray”) to 6 (“I would definitely pick from the large tray”). See Appendix F for the denominator neglect questions.
Subjects also answered demographic questions indicating their age, gender, year in school, high school and college GPA, and SAT/ACT score.
Subjects on average got 46.3% of the original CRT items correct and 56.2% of the CRT-2 items correct. The surprisingly high scores (relative to pre-established norms) may be partially due to the fact that the questions were all presented on the same page; once subjects realized that some items were trick questions, they could change their answers to previous items. The high scores may also be due to prior experience with the items.
As with the CRT, most errors on the CRT-2 were intuitive errors. The CRT-2 actually produced fewer other-type responses (M = 3.0%) than the CRT (M = 11.1%), t(140) = 4.803, p < .001. See Appendix G for the percentages of responses in each category (correct responses, intuitive errors, and other).
Of the 134 subjects who made it to the end of the study, 45 reported that they had seen some of the questions in the study before and 89 reported that they had not. Of those 45 subjects who had seen some items before, 7 did not disclose which they had seen. Eleven had seen at least one of the original CRT questions, and another three implied they might have but didn’t give enough information to deduce with certainty. Nineteen had seen at least one of the new CRT-2 questions, and another two implied they might have but didn’t give enough information to know for sure.
The internal consistency of the CRT-2 was somewhat low (α = 0.511), as was the internal consistency of the original CRT (α = 0.624), but the internal consistency of the seven-item composite (combining the CRT and CRT-2 into a single measure) was acceptable (α = .705). There was a large correlation between the CRT-2 and the original CRT, rs(136) = .511, p < .001. When corrected for attenuation, this correlation is even higher, at .905. (Ordinarily, estimated correlation magnitudes can be weakened by measurement error, and disattenuating correlations corrects for this error.) Table 1 shows Spearman correlations among the seven CRT questions as well as with composite scores for the original CRT, the CRT-2, and a seven-item composite of all the items. All of the 45 correlations were positive and 42 of the 45 were statistically significant.
As previously mentioned, belief bias items require overcoming an intuitive tendency to be influenced by the believability of the conclusion rather than the logical validity of the argument. Thus, belief bias items might measure the same construct as CRT items. Baron et al. (2015) included belief bias items in an expanded CRT, and found that the belief bias questions had generally high correlations with the remainder of the items. Similarly, there was a .558 correlation between belief bias and the CRT in the present study (disattenuated correlation = .752). Adding the belief bias items to the CRT increased the reliability (α = .880), as did adding the belief bias items to the CRT-2 (α = .851). Cronbach’s alpha for all three measures combined was .874. For the belief bias items alone, α = .882. Thus, although we set out only to investigate the suitability of the CRT-2 questions as additional CRT items, in the remaining sections we also analyzed the belief bias items for this purpose.
Numeracy scores were calculated as the sum of all correct responses to both Schwartz et al.’s (1997) general numeracy scale and Lipkus et al.’s (2001) expanded numeracy scale. The mean numeracy score was 9.23 out of 11 (SD = 1.948, N = 141) and Cronbach’s alpha was .719. There was a significant correlation between the original CRT and numeracy, rs(136) = .576, p < .001 (disattenuated correlation = .860), as well as a significant correlation between the CRT-2 and numeracy, rs(139) = .307, p < .001 (disattenuated correlation = .506). Hoerger’s (2013) corrected version of Steiger’s (1980) z-score revealed that the correlation between the CRT-2 and numeracy was significantly weaker than the correlation between the original CRT and numeracy, ZH(135) = 3.67, p < .001.6 This supports the notion that the CRT-2 does not rely as strongly on numeracy as the original CRT. However, it is worth noting that these correlations may be underestimated due to a ceiling effect on the numeracy measure.
There was also a significant correlation between belief bias and numeracy, rs(139) = .466, p < .001 (disattenuated correlation = .585). Although the correlation between belief bias and numeracy was not significantly weaker than the correlation between the CRT and numeracy, the relationship showed a trend in that direction, ZH = 1.67, p < .10. Because the belief bias scale had a higher reliability than the CRT, the strength of its correlation with numeracy may have been artificially inflated relative to the strength of the correlation between the CRT and numeracy. When disattenuated correlations were compared, belief bias was less correlated with numeracy than the original CRT. Thus, like the CRT-2, belief bias items appear useful in disentangling cognitive reflection and numeracy.
Composite scores for all scales were calculated only for subjects who provided responses to all questions in the scale.
Belief bias was calculated as the number of correct responses. The mean belief bias score was 4.85 out of 8 (SD = 2.853, N= 143), with a Cronbach’s alpha of .882.
Need for cognition and denominator neglect scores were both calculated by summing the ratings from each question. The mean need for cognition score was 60.36 (SD = 9.830, N = 134); the range of possible scores is between 18 and 90, and higher scores indicate higher need for cognition. Cronbach’s alpha was .848. The mean denominator neglect score was 11.69 (SD = 5.278, N = 139); the range of possible scores was from 5 to 30, with higher scores indicating more denominator neglect. Cronbach’s alpha was .722.
The mean reported university GPA was 3.35. SAT scores are calculated on a scale from 600 to 2400. The distribution of reported SAT scores was bimodal. The most commonly selected SAT score ranges were 1900–1990 and 2100–2190, each with 15.6% of responses. Subjects were assigned a numerical score from one to 18 based on their selected score bracket (from 18 equal brackets each spanning 100 points).
Table 2: Spearman correlations with measured of rational thinking (disattenuated results in parentheses)
Rational thinking measure Belief bias Need for cognition Denominator neglect SAT scores College GPA + p ≤ .10; *, p ≤ .05; **, p ≤ .01; ***, p ≤ .001.
Because risk preference and time preference measures contained more than one question type, each question’s relationship with the CRT and CRT-2 was examined individually rather than creating a composite measure. For risk preference items in the domain of gains (items a-h), the percentage that chose the risky option ranged from 10.8% to 79.9%. For risk preference items in the domain of losses (items o-r), the percentage that chose the risky option ranged from 24.5% to 49.6%.7 Subscales were also created to conduct reliability analyses and gender analyses, and for inclusion in a correlation matrix. Cronbach’s alpha for a subscale of the eight gains items was .652; Cronbach’s alpha for a subscale of the three losses was .539.
For time preference items a-c, 28.4% to 88.7% of subjects selected the deferred option.8 An attempt to create subscales reinforced the need to analyze items individually. Three subscales were created: financial (items a, b, and c), free estimation (items l and m), and self-comparison (items n, p, and q).9 However, Cronbach’s alphas were so low that these subscales were not used (.465 for financial subscale, .358 for free estimation, and –0.61 for self-comparison). The low alphas reflect the notorious difficulty of measuring time preference and the small number of items in each subscale. Thus, gender analyses were conducted by analyzing each time preference item separately and time preference is not included in a correlation matrix.
Table 3: Spearman correlation matrix including belief bias and rational thinking measures.
CRT CRT-2 7-item BB Comp. NFC DN NS RP-gain RP-loss SAT CRT-2 .511*** . . . . . . . . . 7-item Comp. .884*** .848*** . . . . . . . . BB Comp. .558*** .420*** .594*** . . . . . . . NFC .203* .236** .247** .224** . . . . . . DN -.371*** -.241** -.375*** -.363*** -.146+ . . . . . NS .576*** .307*** .517*** .466*** .005 -.247** . . . . RP-gains .123 .017 .090 .118 .106 -.317*** .192* . . . RP-losses .166+ .114 .137 .033 .142 .027 .014 -.122 . . SAT .588*** .376*** .588*** .494*** .039 -.270** .554*** .182+ -.038 . GPA .331*** .268** .372*** .434*** .059 -.152 .455*** .230** -.064 .525*** +, p ≤ .10, *, p ≤ .05; **, p ≤ .01; ***, p ≤ .001. Time preference is not included due to low reliabilities of the subscales.
Previously observed correlations of the original CRT with belief bias (Toplak et al., 2014a), need for cognition (Frederick, 2005; Toplak et al., 2014a), and denominator neglect (Toplak et al., 2014a) were replicated, and corresponding correlations were observed between the CRT-2 and these scales. There were significant correlations between the CRT and both SAT scores and college GPA, and also between the CRT-2 and both SAT scores and college GPA, consistent with several other studies suggesting that CRT scores are related to cognitive ability (Frederick, 2005; Obrecht et al., 2009). Steiger’s Z-test for the difference of dependent correlations did not reveal significant differences between the CRT and the CRT-2 in the strength of their correlations with belief bias, need for cognition, denominator neglect, or GPA but the CRT was significantly more correlated with SAT scores than the CRT-2. Table 2 shows Spearman correlations of the original CRT and the CRT-2 with the rational thinking measure scores as well as Z-values from tests of differences in dependent correlations.
We also investigated the relationship between belief bias and other rational thinking measures. There were significant correlations between belief bias and need for cognition, denominator neglect, SAT scores, and college GPA. Table 2 also shows Spearman correlations of belief bias (BB) with the other rational thinking measure scores as well as Z-values from tests of differences in dependent correlations between BB and CRT. Table 3 shows a full correlation matrix for belief bias along with other rational thinking measures. There were no significant differences between belief bias and the original CRT in the strength of their correlations with the remaining rational thinking measures when performed on either the original or the disattenuated correlations.
Frederick’s (2005) findings for risk preference and time preference were not fully replicated. Frederick compared the responses of subjects in a low CRT group (0/3 items correct, 33% of respondents) with those from a high CRT groups (3/3 items correct, 17% of overall respondents). However, instead of using a high-low split we calculated correlations because our sample size was much smaller and because dichotomous measures have been criticized for sacrificing statistical power (e.g., Irwin & McClelland, 2001, 2003; Jaccard et al., 2006; MacCallum, Zhang, Preacher & Rucker, 2002) and creating spurious effects (Maxwell & Delaney, 1993; Vargha, Rudas, Delaney & Maxwell, 1996).
For the original CRT, only 1/11 risk preference items and 3/8 time preference items were significant (all significant in the expected direction). For the CRT-2, none of the risk preference items were significant and 1/8 time preference items was significant (in the expected direction).10 However, it is possible that the smaller sample size, the difference in analysis strategy, or the fact that we used only a subset of the original items contributes to differences in the results. Similarly, there were no significant correlations between belief bias and any of the risk preference items, but belief bias was significantly correlated with 5/8 time preference items. See Appendix H for Spearman correlations of the CRT, the CRT-2, and belief bias with risk preference items and time preference items.
Men (M = 65.9% correct) significantly outperformed women (M = 36.0% correct) on the original CRT, t(129) = 4.579, p < .001, replicating previous findings (Frederick, 2005), but men (M = 60.5% correct) and women (M = 53.3% correct) were not reliably different on the CRT-2, t(131) = 1.406, p > .05. See Appendix I for an analysis of gender differences on individual test questions and gender differences on rational thinking measures.
The typical gender difference has not been fully explained, but some researchers have speculated that it may be due to differences in numeracy, which is usually higher in men (Frederick, 2005; Baron et al., 2015). This explanation would fit well with the present data since the CRT-2 relies less on numeracy than the original CRT. There was not a statistically significant difference in belief bias scores between men (M = 5.44) and women (M = 4.48), but there was a trend for men to score higher, t(132) = 1.821, p < .10.
Prior exposure may prove to be less problematic for belief bias items than for items similar in structure to the original CRT items, since new questions can be easily generated by using the same structure with different content. However, previous training in logical syllogisms might undermine the validity of belief bias questions. We computed a rational thinking composite score equivalent to that used to examine the effects of prior exposure on the CRT’s validity (reported in the introduction), but with belief bias necessarily eliminated from the composite. Thus, we added the Z-scores from the need for cognition, denominator neglect, and numeracy scales, with denominator neglect reverse-scored.
Subjects who reported prior training in logical syllogisms answered more belief bias items correctly (M = 5.63) than those who did not (M = 4.46), t(132) = 2.164, p < .05. Belief bias scores were significantly correlated with performance on a rational thinking composite only for subjects who did not report training in logical syllogisms, rs(92) = .431, p < .001. Belief bias scores did not significantly predict rational thinking composite scores for subjects who had received prior training, though the data were trending, rs(36) = .293, p < .10. These results indicate cause for concern, but are not entirely conclusive, since a Fisher’s R to Z transformation did not reveal a significant difference in the strengths of the two correlations, Z = 0.80, p > .05.
The CRT is a tremendously influential measure of reflective thinking and has been widely applied in the study of heuristics and biases. Unfortunately, its prevalence has led to the contamination of common subject pools. The results showed that in one popular pool of subjects as many as 94% of subjects have been exposed to the questions. We confirmed that prior exposure inflates scores. Moreover, the original CRT relies heavily on numeracy, which can create problems for certain theoretical purposes. To resolve these issues, we developed a new set of questions to measure cognitive reflection called the CRT-2.
In addition to having high face validity, there is good reason to believe that the CRT-2 measures the same construct as the original CRT. The two measures are highly correlated and inclusion of CRT-2 questions in a scale with the CRT increases the internal reliability of the measure. Further, the CRT-2 predicts performance on the same cognitive measures as the CRT (belief bias, denominator neglect, need for cognition, SAT scores, and college GPA). While the studies did not show a consistent relationship between the CRT-2 and risk preference or time preference, the data did not replicate Frederick’s (2005) original finding that risk preference and time preference are correlated with the original CRT. A smaller sample size, the use of only a subset of the original items, a role for numeracy in time preference, or the use of different statistical procedures may account for these differences.
Although the CRT-2 does display a significant relationship with numeracy, this is unsurprising given that numeracy correlates with measures of intelligence such as SAT scores (Peters et al., 2006) and Raven’s Advanced Progressive Matrices (Liberali et al., 2012). Importantly, the CRT-2 was significantly less reliant on numeracy than the original CRT, which may help researchers who are trying to dissociate those constructs (Sinayev & Peters, 2015; Böckenholt, 2012; Campitelli & Gerrans, 2014; Baron et al., 2015; Liberali et al., 2012; Graffeo, Polonio & Bonini, 2015; Welsh et al., 2013). Further, there was no significant gender difference in CRT-2 scores, in contrast to gender differences in the original CRT found in both our study and others (e.g., Frederick, 2005). Given this, the gender differences typically found in CRT scores may be due to differences in numeracy rather than differences in reflective reasoning. Thus, avoiding confounds with numeracy may help researchers develop future measures of cognitive reflection that don’t display gender differences. Finally, scores on the CRT-2 did not appear prone to floor effects.
Although there are reasons to suspect that prior exposure to the CRT undermines the validity of the test, to our knowledge this has not been directly tested. It is possible that having seen the items before could inflate scores in a manner akin to giving subjects the answers. And in fact, research using measures other than the CRT has shown that prior exposure can inflate scores (Basso et al., 1999) and attenuate effect sizes (Chandler et al., 2015). However, there are also reasons why prior exposure might not be problematic for the CRT, and could even be beneficial. For example, the floor effects found in many populations reduce the predictive value of the test. It is possible that prior exposure could make the CRT easier, thus creating variability.
In order to assess the extent to which prior exposure poses a problem for studies using the CRT, we administered the CRT to 200 subjects on MTurk along with a rational thinking battery including many of the same measures used in Study 2: belief bias, numeracy, denominator neglect, and need for cognition. In this sample, 56 subjects (28%) reported prior exposure to none of the three questions, and 120 (60%) reported prior exposure to all three. We concentrated on these two groups.11 The high-exposure group answered more CRT questions correctly (M = 1.86) than the low-exposure group (M = 1.29), Welch’s t(118.79) = 3.0345, p = 0.003. Thus, prior exposure did inflate CRT scores, indicating that scores should not be compared across subjects with differential levels of prior exposure.
The results were mixed with respect to whether or not prior exposure on the CRT undermines predictive validity. CRT scores significantly predicted performance on the rational thinking battery for the low-exposure group, (r = .270, p = .044), but not quite significantly for the high-exposure group (r = .165, p = 0.071). The difference between these two correlations was not significant (by R to Z transformation, p = .51).
Individual correlations with each of the rational thinking measures (rather than analyzing a composite) also produced inconclusive results. The high-exposure group showed higher correlations between CRT and numeracy (NS, .30 vs. .23) but lower correlations between CRT and belief bias (BB, .28 vs. .31), between CRT and Need for Cognition (NFC, –.06 vs. .12) and between CRT and denominator neglect (DN, –.04 vs. .04). Note that correlations with DN and NFC did not approach significance even for the whole sample, so it is not clear what to make of these comparisons. The general result was that none of these differences in correlations approached significance. Even regression of the CRT score on all four measures and their interactions with exposure showed no effect whatsoever of the interaction.
Thus, we have some reason to believe that the CRT’s validity may be undermined by prior exposure, but we have no clear evidence of any effect. To a first approximation, any effect is not very large. We thus suggest that future studies should not rely on the original three items if many subjects have seen them, but we have no reason to seriously question prior results that have ignored the problem of prior exposure.
Although our original purpose was to investigate the CRT-2, we found that belief bias items can also serve as a source of CRT items. Correctly answering belief bias questions requires inhibiting an intuitive tendency to evaluate syllogisms based on the believability of the conclusion rather than the logical validity of the argument. Belief bias also correlates highly with the CRT and predicted performance on the same cognitive measures as the CRT. There was also some support that belief bias is less correlated with numeracy than the original CRT, and thus can likely address the numeracy confounds of the original test. Further, gender was only slightly, but not significantly, related to performance. (Baron et al., 2015, also found no relationship between belief bias and gender.)
Importantly, while generating new questions that mimic the format of those on the original CRT is difficult, belief bias questions are relatively easy to write, and so validating belief bias items as CRT questions provides an algorithm for writing new questions. Thus, we have not only expanded the pool of CRT items with four additional questions, but also helped provide support for belief bias as a virtually unlimited pool of questions. However, the data did suggest that previous training in logical syllogisms may undermine the validity of belief bias items. Further, one potential disadvantage of using belief bias items is that, unlike questions from the original CRT and CRT-2, there are only two possible answer choices, so it is impossible to separate wrong answers that are the result of accepting the intuitive lure, and those that result from faulty deliberate reasoning.
In summary, the field is badly in need of a larger database of validated questions for studying cognitive reflection. In addition to cognitive ability, thinking dispositions are crucial for understanding individual differences in rational thinking (West, Toplak & Stanovich, 2008). Researchers are showing increasing interest in thinking dispositions, and this interest is spreading beyond the heuristics-and-biases tradition to domains like developmental psychology (Toplak, West & Stanovich, 2014b; Blackwell, Trzesniewski & Dweck, 2007; Duckworth & Seligman, 2005; Reyna, Chapman, Dougherty & Confrey, 2012). The more CRT questions that are validated, the better off the field will be.
We would like to encourage other researchers studying cognitive reflection to generate and validate new questions as well. Due to the way research is commonly conducted in the area, subject pools can quickly become polluted as subjects are exposed to often-used materials. Thus, tests like the CRT are an expendable resource, and researchers who are using questions should also be contributing questions of their own. Researchers should also be mindful of the types of studies they conduct. Running large pilot studies and other underdeveloped studies can drain the pool of naïve subjects for the entire community. Further, although prior exposure may affect the CRT’s validity, the current data do not provide adequate support. Future work is needed to investigate the effects of prior exposure on validity, and to examine more closely the circumstances under which prior exposure is likely to be a problem.
Ackerman, R. (2014). The diminishing criterion model for metacognitive regulation of time investment. Journal of Experimental Psychology: General, 143(3), 1349–1368.
Ackerman, R., & Zalmanov, H. (2012). The persistence of the fluency-confidence association in problem solving. Psychonomic Bulletin & Review, 19(6), 1187–1192.
Baron, J., Scott, S., Fincher, K. S., & Metz, S. E. (2015). Why does the Cognitive Reflection Test (sometimes) predict utilitarian moral judgment (and other things)? Journal of Applied Research in Memory and Cognition, 4(3), 265–284.
Basso, M. R., Bornstein, R. A., & Lang, J. M. (1999). Practice effects on commonly used measures of executive function across twelve months. The Clinical Neuropsychologist, 13(3), 283–292.
Berinsky, A. J., Huber, G. A., & Lenz, G. S. (2012). Evaluating online labor markets for experimental research: Amazon.com’s Mechanical Turk. Political Analysis, 20(3), 351–368.
Blackwell, L. S., Trzesniewski, K. H., & Dweck, C. S. (2007). Implicit theories of intelligence predict achievement across an adolescent transition: A longitudinal study and an intervention. Child Development, 78(1), 246–263.
Böckenholt, U. (2012). The cognitive-miser response model: Testing for intuitive and deliberative reasoning. Psychometrika, 77(2), 388–399.
Cacioppo, J. T. Petty, R.E. & Kao, C.F. (1996). The efficient assessment of need for cognition. Journal of Personality Assessment, 48(3), 306–307.
Campitelli, G., & Gerrans, P. (2014). Does the cognitive reflection test measure cognitive reflection? A mathematical modeling approach. Memory and Cognition, 42(3), 434–447.
Chandler, J., Mueller, P., & Paolacci, G. (2014). Nonnaivete among Amazon Mechanical Turk workers: Consequences and solutions for behavioral researchers. Behavioral Research Methods, 46(1), 112–130.
Chandler, J., Paolacci, G., Peer, E., Mueller, P., & Ratliff, K. A. (2015). Using nonnaive participants can reduce effect sizes. Psychological Science, 26(7), 1131–1139.
Cokely, E. T., & Kelley, C. M. (2009). Cognitive abilities and superior decision making under risk: A protocol analysis and process model evaluation. Judgment and Decision Making, 4(1), 20–33.
Del Missier, F., Mäntylä, T., & Bruine de Bruin, W. (2012). Decision-making competence, executive functioning, and general cognitive abilities. Journal of Behavioral Decision-Making, 25(4), 331–351.
De Neys, W., & Franssens, S. (2009). Belief inhibition during thinking: Not always winning but at least taking part. Cognition, 113(1), 45–61.
Duckworth, A. L., & Seligman, M. E. P. (2005). Self-discipline outdoes IQ in predicting academic performance of adolescents. Psychological Science, 16, 939–944.
Finucane, M. L., & Gullion, C. M. (2010). Developing a tool for measuring the decision-making competence of older adults. Psychology and Aging, 25(2), 271.
Frederick, S. (2005). Cognitive reflection and decision-making. Journal of Economic Perspectives, 19(4), 25–42.
Graffeo, M., Polonio, L., & Bonini, N. (2015). Individual differences in competent consumer choice: The role of cognitive reflection and numeracy skills. Frontiers in Psychology, 6, 844.
Hoerger, M. (2013). ZH: An updated version of Steiger’s Z and web-based calculator for testing the statistical significance of the difference between dependent correlations. Retrieved from http://www.psychmike.com/dependent_correlations.php.
Hoppe, E. I., & Kusterer, D. J. (2011). Behavioral biases and cognitive reflection. Economics Letters, 110(12), 97–100.
Irwin, J. R. & McClelland, G. H. (2001). Misleading heuristics and moderated multiple regression models. Journal of Marketing Research, 38(1), 100–109.
Irwin, J. R. & McClelland, G. H. (2003). Negative effects of dichotomizing continuous predictor variables. Journal of Marketing Research, 40(3), 366–371.
Jaccard, J., Guilamo-Ramos, V., Johansson, M., & Bouris, A. (2006). Multiple regression analyses in clinical child and adolescent psychology. Journal of Clinical Child and Adolescent Psychology, 35(3), 456–479.
Johnson-Laird, P. N., & Bara, B. G. (1984). Syllogistic inference. Cognition, 16, 1–61.
Kahneman, D. (2011). Thinking, Fast and Slow. New York: Farrar, Strauss, Giroux.
Kirkpatrick, L., & Epstein, S. (1992). Cognitive-experiential self-theory and subjective probability: Evidence for two conceptual systems. Journal of Personality and Social Psychology, 63(4), 534–544.
Koehler, D. J., & James, G. (2010). Probability matching and strategy availability. Memory & Cognition, 38(6), 667–676.
Levesque, H. J. (1986). Making believers out of computers. Artificial Intelligence, 30, 81–108.
Levesque, H. J. (1989). Logic and the complexity of reasoning. In R. H. Thomason (Ed.), Philosophical logic and artificial intelligence (pp. 73–107). Dordrecht, The Netherlands: Kluwer Academic Publishers.
Liberali, J. M., Reyna, V. F., Furlan, S., Stein, L. M., & Pardo, S. T. (2012). Individual differences in numeracy and cognitive reflection, with implications for biases and fallacies in probability judgment. Journal of Behavioral Decision Making, 25(4), 361–381.
Lipkus, I. M., Samsa, G., & Rimer, B. K. (2001). General performance on a numeracy scale among highly educated samples. Medical Decision Making, 21(1), 37–44.
Lubin, G. (2012). A simple logic question that most Harvard students get wrong. Business Insider. Retrieved from: http://www.businessinsider.com/question-that-harvard-students-get-wrong-2012-12.
MacCallum, R. C., Zhang, S., Preacher, K. J., & Rucker, D. D. (2002). On the practice of dichotomization of quantitative variables. Psychological Methods, 7(1),19–40.
Markovits, H. & Nantel, G. (1989). The belief-bias effect in the production and evaluation of logical conclusions. Memory & Cognition, 17(1), 11–17.
Maxwell, S. E. & Delaney, H. D. (1993). Bivariate median splits and spurious statistical significance. Psychological Bulletin, 113(1),181–190.
Obrecht, N., Chapman, G., & Gelman, R. (2007) Intuitive t-tests: Lay use of statistical information. Psychonomic Bulletin and Review, 14(6), 1147–1152.
Obrecht, N. A., Chapman, G. B., & Gelman, R. (2009). An encounter frequency account of how experience affects likelihood estimation. Memory & Cognition, 37(5), 632–643.
Oechssler, J., Roider, A., & Schmitz, P. W. (2009). Cognitive abilities and behavioral biases. Journal of Economic Behavior & Organization, 72(1), 147–152.
Paxton, J. M., Ungar, L., & Greene, J. D. (2012). Reflection and reasoning in moral judgment. Cognitive Science, 36(1), 163–177.
Peters, E. (2012). Beyond comprehension: the role of numeracy in judgments and decisions. Current Directions in Psychological Science, 21(1), 31–35.
Peters, E., Dieckmann, N. F., Västfjäll, D., Mertz, C. K., Slovic, P., & Hibbard, J. H. (2009). Bringing meaning to numbers: the impact of evaluative categories on decisions. Journal of Experimental Psychology: Applied, 15(3), 213–227.
Peters, E.,Västfjäll, D., Slovic, P.,Mertz, C. K., Mazzocco, K., and Dickert, S. (2006). Numeracy and decision making. Psychological Science, 17(5), 407–413.
Postrel, A. (2006). Would you take a bird in the hand, or a 75% chance of two in the bush? The New York Times. Retrieved from: http://www.nytimes.com/2006/01/26/business/26scene.html?pagewanted=print\&\_r=0.
Primi, C., Morsanyi, K., Chiesi, F., Donati, M. A., & Hamilton, J. (2015). The development and testing of a new version of the cognitive reflection test applying item response theory (IRT). Journal of Behavioral Decision Making. http://dx.doi.org/10.1002/bdm.1883.
Rand, D. G., Peysakhovich, A., Kraft-Todd, G. T., Newman, G. E., Wurzbacher, O., Nowak, M.A., & Greene, J.D. (2014). Social heuristics shape intuitive cooperation. Nature Communications, 5, 1–30.
Reyna, V., Chapman, S., Dougherty, M., & Confrey, J. (Eds.). (2012). The adolescent brain: Learning, reasoning, and decision making. Washington DC: American Psychological Association.
Reyna,V. F., Nelson,W. L., Han, P. K., & Dieckmann, N. F. (2009). How numeracy influences risk comprehension and medical decision making. Psychological Bulletin, 135(6), 943–973.
Riordan, H. (n.d.). See if you can figure out these trick questions… Allwomenstalk. Retrieved from http://funny.allwomenstalk.com/see-if-you-can-figure-out-these-trick-questions.
Royzman, E. B., Landy, J. F., & Leeman, R. F. (2014). Are thoughtful people more utilitarian? CRT as a unique predictor of moral minimalism in the dilemmatic context. Cognitive Science, 39(2), 325–352.
Schwartz, L. M., Woloshin, S., Black, W. C., & Welch, G. H. (1997). The role of numeracy in understanding the benefit of screening mammography. Annals of Internal Medicine, 127 (11), 966–971.
Sinayev, A. & Peters, E. (2015). Cognitive reflection vs. calculation in decision making. Frontiers in Psychology, 6, 532.
Steiger, J. H. (1980). Tests for comparing elements of a correlation matrix. Psychological Bulletin, 87, 245–251.
Stewart, N., Ungemach, C., Harris, A. J. L., Bartels, D. M., Newell, B. R., Paolacci, G., & Chandler, J. (2015). The average laboratory samples a population of 7,300 Amazon Mechanical Turk Workers. Judgment and Decision-Making, 10(5), 479–491.
Toplak, M. E., & Stanovich, K. E. (2002). The domain specificity and generality of disjunctive reasoning: Searching for a generalizable critical thinking skill. Journal of Educational Psychology, 94(1), 197–209.
Toplak, M. E., West, R.F., & Stanovich, K. E. (2011). The Cognitive Reflection Test as a predictor of performance on heuristics-and-biases tasks. Memory & Cognition, 39(7),1275–1289
Toplak, M. E., West, R. F., & Stanovich, K. E. (2014a). Assessing miserly information processing: An expansion of the Cognitive Reflection Test. Thinking & Reasoning, 20(2), 147–168.
Toplak, M. E., West, R. F., & Stanovich, K. E. (2014b). Rational thinking and cognitive sophistication: Development, cognitive abilities, and thinking dispositions. Developmental Psychology, 50(4), 1037–1048.
Vargha, A., Rudas, T., Delaney, H. D., & Maxwell, S. E. (1996). Dichotomization, partial correlation, and conditional independence. Journal of Educational and Behavioral Statistics, 21(3), 264–282.
Weller, J. A., Dieckmann, N. F., Tusler, M., Mertz, C. K., Burns, W. J.,& Peters, E. (2013). Development and testing of an abbreviated numeracy scale: A Rasch analysis approach. Journal of Behavioral Decision Making, 26(2), 198–212.
Welsh, M., Burns, N., & Delfabbro, P. (2013). The cognitive reflection test: How much more than numerical ability? Paper presented at the Proceedings of the 35th Annual Meeting of the Cognitive Science Society, Berlin, Germany. pp.1587–1592.
West, R. F., Toplak, M. E., & Stanovich, K. E. (2008). Heuristics and biases as measures of critical thinking: Associations with cognitive ability and thinking dispositions. Journal of Educational Psychology, 100(4), 930–941.
Two hundred subjects on Amazon’s Mechanical Turk completed the study. We restricted the respondents to those who had at least a 95% approval rate. Subjects were prevented from taking more than one related survey in our lab in which the CRT or CRT-2 was administered using the Unique Turker Service (http://uniqueturker.myleott.com/).
Subjects first answered each of the CRT questions in random order. After each item, subjects were asked whether they had seen that item before. Next, subjects took a rational thinking battery including eight belief bias items, the 18-item need for cognition scale, and an 11-item numeracy scale. Subjects also provided their gender, and five denominator neglect questions were distributed throughout the rational thinking battery. These same measures are also used and described in more detail in Study 2. Z scores for each of the rational thinking measures were summed to create a rational thinking composite score, with denominator neglect reverse-scored.
For each of the following problems, decide if the given conclusion follows logically from the premises. Select YES if, and only if, you judge that the conclusion can be derived unequivocally from the given premises. Otherwise, select NO.
Do you understand these instructions? An experimenter is available to answer any questions you may have. Please indicate yes only when you feel that you fully understand the instructions.
Premise 1: All things that are smoked are good for the health.
Premise 2: Cigarettes are smoked.
Conclusion: Cigarettes are good for the health.
Premise 1: All unemployed people are poor.
Premise 2: Rockefeller is not unemployed.
Conclusion: Rockefeller is not poor.
Premise 1: All flowers have petals.
Premise 2: Roses have petals.
Conclusion: Roses are flowers.
Premise 1: All animals with four legs are dangerous.
Premise 2: Poodles are animals that aren’t dangerous.
Conclusion: Poodles do not have four legs.
Premise 1: All mammals walk.
Premise 2: Whales are mammals.
Conclusion: Whales walk.
Premise 1: All Eastern countries are communist.
Premise 2: Canada is not an Eastern country.
Conclusion: Canada is not communist.
Premise 1: All animals like water.
Premise 2: Cats do not like water.
Conclusion: Cats are not animals.
Premise 1: All things that have a motor need oil.
Premise 2: Automobiles need oil.
Conclusion: Automobiles have motors.
a. Which of the following would you prefer, $3400 this month or $3800
next month?
b. Which of the following would you prefer, $100 now or $140 next
year?
c. Which of the following would you prefer, $100 now or $1100 in 10
years?
l. What is the highest amount of money you would be willing to pay to
have a book shipped overnight rather than in 2 weeks?
m. What is the smallest amount of money to be received in 4 days that
you would prefer to receiving $170 in 2 months?12
n. Compared to the average person taking this survey today, how
impulsive are you?
p. Compared to the average person taking this survey today, how much do
you think about your future?
q. Compared to the average person taking this survey today, how much do
you worry about inflation?
Which of the following would you prefer?
a. Receiving $1,000 for sure or a 90% chance to receive $5,000
c. Receiving $100 for sure or a 90% chance to receive $500
c. Receiving $1,000 for sure or a 75% chance to receive $4,000
d. Receiving $100 for sure or a 75% chance to receive $200
e. Receiving $100 for sure or a 75% chance to receive $150
f. Receiving $100 for sure or a 50% chance to receive $300
g. Receiving $500 for sure or a 15% chance to receive $1,000,000
h. Receiving $100 for sure or a 3% chance to receive $7,000
o. Losing $100 for sure or a 75% chance to lose $200
q. Losing $50 for sure or a 10% chance to lose $800
r. Losing $100 for sure or a 3% chance to lose $7000
Subjects responded to five questions in the following format:
“Assume that you are presented with two trays of black and white marbles (pictured below and right): The large tray contains 100 marbles. The small tray contains 10 marbles. The marbles are spread in a single layer in each tray. You must draw out one marble (without peeking, of course) from either tray. If you draw a black marble you win $5.
Consider a condition in which: The small tray contains 1 black and 9 white marbles. The large tray contains 8 black and 92 white marbles.
From which tray would you prefer to select a marble in a real situation?”
Responses were made on the following six-point scale indicating the graded attractiveness of each option.
(1) I would definitely pick from the small tray
(2) I would pick from the small tray
(3) I would probably pick from the small tray
(4) I would probably pick from the large tray
(5) I would pick from the large tray
(6) I would definitely pick from the large tray
For the remaining four questions, the ratio of black:white marbles in the small and large trays were as follows: 1:4 versus 19:81, 1:19 versus 4:96, 2:3 versus 19:31, and 3:12 versus 18:82.
| Question | Correct | Intuitive errors | Other | |
| CRT | Q1 | 48.2% | 44.0% | 7.8% |
| CRT | Q2 | 33.6% | 53.1% | 13.3% |
| CRT | Q3 | 51.7% | 34.3% | 14.0% |
| CRT-2 | Q1 | 62.9% | 34.3% | 2.8% |
| CRT-2 | Q2 | 83.2% | 16.1% | 0.7% |
| CRT-2 | Q3 | 62.4% | 29.1% | 8.5% |
| CRT-2 | Q4 | 16.1% | 83.9% | 0.0% |
| For the CRT-2 Q3 (Emily’s father), only the month “July” was counted as intuitive-incorrect; other month names (like “May”) were scored as “other”. For the CRT Q4 (dirt in a hole), any nonzero number was counted as “intuitive error” due to the high variability in calculation ability. | ||||
| Item | CRT | CRT-2 | BB |
| Risk preference | |||
| a | .048 | -.007 | .013 |
| b | .036 | .078 | .049 |
| c | .030 | -.049 | .013 |
| d | .022 | .030 | .140+ |
| e | -.013 | -.033 | .012 |
| f | .132 | .145+ | .126 |
| g | .216* | .019 | .095 |
| h | .023 | -.059 | .076 |
| o | .152+ | .052 | -.004 |
| q | .091 | .060 | .025 |
| r | .132 | .087 | .043 |
| Time preference | |||
| a | .046 | -.075 | .152+ |
| b | .170* | .142+ | .214* |
| c | -.006 | .055 | .106 |
| l | -.240** | -.140 | -.198* |
| m | .092 | .117 | .173* |
| n | -.251** | -.198* | -.305*** |
| p | -.141 | -.088 | -.246** |
| q | -.101 | -.033 | -.100 |
| +, p ≤ .10, *, p ≤ .05; **, p ≤ .01; ***, p ≤ .001. | |||
| Male | Female | T-test result | |
| CRT measures (percent correct) | |||
| CRT Q1 | 58% | 41% | t(131) = 1.851, p < .10 |
| CRT Q2 | 56% | 22% | t(132) = 3.837, p < .001 |
| CRT Q3 | 83% | 44% | t(130) = 4.954, p < .001 |
| CRT-2 Q1 | 67% | 59% | t(132) = 0.898, p > .05 |
| CRT-2 Q2 | 93% | 78% | t(132) = 2.554, p < .05 |
| CRT-2 Q3 | 63% | 61% | t(131) = 0.185, p > .05 |
| CRT-2 Q4 | 19% | 14% | t(132) = 0.638, p > .05 |
| Rational thinking measures (means) | |||
| NS | 9.86 | 8.86 | t(121) = 3.272, p = .001 |
| BB | 5.44 | 4.48 | t(132) = 1.821, p < .10 |
| NFC | 61.56 | 59.81 | t(131) = .955, p > .05 |
| DN | 8.70 | 13.13 | t(132) = –4.878, p < .001 |
| GPA | 3.42 | 3.32 | t(130) = 1.293, p > .05 |
| SAT | 14.97 | 13.94 | t(107) = 1.639, p > .05 |
| RP gains | 3.65 | 2.79 | t(132) = 2.674, p < .01 |
| RP losses | 0.98 | 1.08 | t(132) = –.538, p > .05 |
| TP a | 0.84 | 0.91 | t(66) = –1.164, p > .05 |
| TP b | 0.30 | 0.27 | t(132) = .329, p > .05 |
| TP c | 0.60 | 0.58 | t(132) = .242, p > .05 |
| TP l | 10.29 | 13.24 | t(114) = –1.957, p < .10 |
| TP m | 102.90 | 102.23 | t(128) = .063, p > .05 |
| TP n | 0.42 | 0.79 | t(132) = –.904, p > .05 |
| TP p | 2.53 | 2.63 | t(132) = –.290, p > .05 |
| TP q | -0.16 | -0.26 | t(132) = .217, p > .05 |
This document was translated from LATEX by HEVEA.