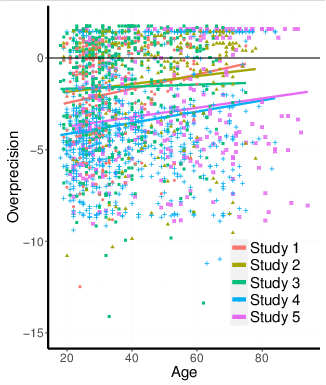
| Figure 1: A scatterplot that displays the distribution of overprecision scores across all studies. |
Judgment and Decision Making, Vol. 12, No. 1, January 2017, pp. 29-41
Overconfidence over the lifespanJulia P. Prims* Don A. Moore# |
This research investigated how different forms of overconfidence correlate with age. Contrary to stereotypes that young people are more overconfident, the results provide little evidence that overestimation of one’s performance or overplacement of one’s performance relative to that of others is correlated with age. Instead, the results suggest that precision in judgment (confidence that one knows the truth) increases with age. This result is strongest for probabilistic elicitations, and not present in quantile elicitations or reported confidence intervals. The results suggest that a lifetime of experience, rather than leading to better calibration, instead may increase our confidence that we know what we’re talking about.
Keywords: overconfidence, overestimation, overplacement, overprecision,
age differences
Some of the most important developmental milestones in a person’s life involve changes in confidence. The apprehensiveness of the infant gives way to the brashness of youth and the recklessness of adolescence, only to be replaced, ideally, by well-calibrated good sense in adulthood. How does this confidence change as adults mature into old age? On one hand, we might expect that age and experience help people become better calibrated in their confidence judgments. On the other hand, it is possible that the selective feedback that life affords us could actually exacerbate overconfidence. In this paper we test whether age is correlated with different forms of overconfidence.
There are profound day-to-day consequences of overconfidence. It has been called the most consequential of the biases to which human judgment is vulnerable (Kahneman, 2011; Plous, 1993). Overconfidence can lead people to take more risks (Weinstein & Lyon, 1999) or make reckless decisions with their money by, for example, trading too much and taking riskier bets (Odean, 1998, 1999). Overconfidence can impair the ability to consider other perspectives, revise opinions in the light of new evidence, or plan for unanticipated future events (Makridakis, Hogarth & Gaba, 2009). Inflated certainty can prompt more arguments or even lawsuits (Babcock & Loewenstein, 1997; Minson, Liberman & Ross, 2009; Neale & Bazerman, 1985).
In the popular imagination, young people are reckless and overconfident, whereas senior citizens are cautious and circumspect (Reyna, 2012). However, systematic studies do not provide much support for these beliefs (Quadrel, Fischhoff & Davis, 1993). Although young people (especially young men) seem to make riskier choices (Balogh, Mayes & Potenza, 2013), they are not necessarily more overconfident. They may simply be more risk tolerant (Tränkle, Gelau & Metker, 1990). Moreover, the popular view of young people as overconfident centers on young people’s overestimation of their chances of success and invulnerability, but has less to say about whether they believe they are better than others, or whether they are inappropriately sure of being right.
Prior research has not, however, correlated age with all three types of overconfidence. Overestimation, overplacement, and overprecision are not different manifestations of the same underlying construct. They occur at different times and in different ways (Moore & Healy, 2008). Overestimation is thinking that you are better than you really are. Overplacement is the exaggerated belief that you are better than others. Overprecision is the excessive faith that you know the truth. For example, you could be convinced that you failed an exam, when you actually performed adequately. If you were sure you scored below 60% and placed last in your class, but in fact you got 75% right and scored around the class average, your judgment could show underestimation, underplacement, and overprecision at the same time. In this example you display underestimation by guessing a score below your true score, underplacement by thinking that you did worse compared to the rest of the class than you really did, and overprecision by being too confident that your estimate is properly calibrated. These three forms of overconfidence are not the same thing, and their relationships with one another are complex.
It makes sense to expect overestimation and overplacement to be positively correlated with one another. Within a given domain, this is usually the case, for entirely predictable reasons: those who have most overestimated themselves are also likely to overplace, incorrectly believing that they are better than others. However, the picture gets more complicated when tasks vary in difficulty.
Moore and Small (2007) found that easy tasks lead to underestimation and overplacement, while hard tasks produce overestimation and underplacement. Underestimation on easy tasks and overestimation on hard tasks is the hard-easy effect (Erev, Wallsten & Budescu, 1994; Ferrell & McGoey, 1980). The logic is simple, and holds any time the correlation between people’s actual performance and their subjective estimate of that performance is lower than 1. The imperfect correlation means that people’s estimates of performance will not be exactly right. When performance is extremely good, it is much easier to under-estimate than over-estimate it. When performance is extremely bad, it is easier to over-estimate than under-estimate it. In other words, estimates of performance will be regressive.
The reversal on measures of overplacement is a simple consequence of error in estimations of others (Larrick, Burson & Soll, 2007; Moore, 2007). If people make imperfect estimates of their own scores, their estimates of others are predictably less accurate. The consequence is that their estimates of others are even more regressive than are their estimates of themselves. So on a difficult task, people overestimate their own scores, overestimate others even more so, and believe that they are worse than others. On easy tasks, although people underestimate their own scores they underestimate others even more, and are left believing that they are better than others. These effects of difficulty are driven by statistical noise and the imperfection in people’s knowledge of their own and others’ performances. If this phenomenon varies with age, then we will be able to identify the effects in our results.
Well-calibrated judges’ confidence matches their accuracy. Overprecision occurs when confidence exceeds accuracy. Although it is tempting to think that experience acquired over a lifetime should improve calibration and reduce overprecision, the evidence is mixed. On one hand, knowledgeable people are more likely to make correct predictions about the boundaries of their knowledge (Burson, Larrick & Klayman, 2006; Kruger & Dunning, 1999). But expertise and the feeling of knowledge that accompanies it tend to increase judgmental precision as well (Mahajan, 1992). Although experts’ predictions are more accurate, experts also display greater precision (Önkal, Yates, Simga-Mugan & Öztin, 2003). Thus, experts and novices often display similar levels of overprecision (McKenzie et al., 2008). The problem is, of course, that experience need not provide real expertise. Some forms of experience can increase confidence without increasing accuracy.
Large amounts of practice accompanied by unambiguous, immediate feedback can effectively reduce all three forms of overconfidence (Keren, 1987; Murphy & Winkler, 1977). However, it is rare that life provides us with this sort of prompt, veridical, and clear feedback. More often, the feedback we receive is spotty, delayed, and biased. Consider police officers; although police officers become more confident about their ability to detect lies as they gain experience (Mann, Vrij & Bull, 2004), the feedback they receive is quite poor. Conscientious officers might follow a case through a trial verdict, but even this could come years later and be poorly correlated with misstatements at the time of arrest.
Instead, social dynamics often conspire to provide people with affirmation and expectancy-confirming feedback (Darley & Fazio, 1980). Other people behave in ways that help confirm our expectations of them (Snyder & Swann, 1978; Snyder, Tanke & Berscheid, 1977). People are frequently motivated to encourage us to view them as intelligent and likable; one way they can do that is to provide us with positive feedback and affirm the conclusions we believe to be true (Darley & Fazio, 1980). The result is that it is possible to go through daily life without receiving clear disconfirming feedback about the inaccuracy of our private beliefs (Moore, Tenney & Haran, 2016; Schulz, 2010). Add to this the problem of biased assimilation of information (Lord, Ross & Lepper, 1979), and it is entirely plausible that overprecision could become worse with age.
We are not the first to examine age differences in overconfidence. Prior research sometimes reveals greater overconfidence among older people (Bruine de Bruin, Parker & Fischhoff, 2012; Crawford & Stankov, 1996). Other studies show the opposite: reduced overconfidence with age (Kovalchik, Camerer, Grether, Plott & Allman, 2005). These studies all use item-confidence judgments, which ask participants to answer questions and also estimate the probability that their answers are correct. While item-confidence judgments are useful and common, their weakness is that they perfectly confound overestimation of one’s correctness with overprecision in judgment (Moore & Healy, 2008). Another study found that their reported confidence intervals make older people appear more overprecise (Hansson, Rönnlund, Juslin & Nilsson, 2008), but no prior study has examined all three forms of overconfidence.
We contribute to the literature by measuring the three forms of overconfidence cleanly and distinctly, and measuring them (cross-sectionally) over the life span. We employed a task on which we could objectively assess performance, allowing us to obtain clear measures of overconfidence. We recruited participants varying in age from 18 to 75, and examined correlations between age and three different forms of overconfidence.
We began with an exploratory test in which we planned to correlate age with measures of the three different varieties of overconfidence. We then replicated our results, conducting four direct replications, as well as adding different measures of overconfidence to the replications. Additional details can be found in our materials.1 The fact that we employ the same task and measures in all five studies allows us to compare the effect across studies and come to strong conclusions about the size and durability of the effect we document.2
Consistent with our pre-registered research protocol, we opened the survey to 200 participants on Amazon Mechanical Turk, offering a payment of $0.50 and the chance to earn a $30 prize. We wound up with 204 complete responses.3
Immediately following the consent form and before encountering the experimental materials, participants faced an attention check. This attention check asked participants to repeat how many weights they would be estimating, and how close their guess had to be to the true answer to be counted as correct. The survey ejected participants who failed the attention check. They could not continue and are not included in the subject counts.
Those who passed the attention check viewed a series of ten photographs and tried to estimate how much the person in each photo weighed. We measured the participants’ confidence in the accuracy of their weight estimates. This task has a number of advantages: people’s interest in the task reduces the ravages of fatigue and boredom; there is a right answer, which facilitates scoring; and it is impossible for participants to cheat by looking up the answers. This weight-guessing task has served as a useful measure of overconfidence in prior research, replicating classic results from the overconfidence literature (Moore & Klein, 2008; Sah, Moore & MacCoun, 2013). These classic results include the finding that overestimation is greatest for difficult tasks, that overplacement is greatest for easy tasks, and that overprecision is impressively robust (Erev et al., 1994; Harvey, 1997; Kruger, 1999).
Whether we observe overestimation or overplacement in our results will depend on how difficult the task is (Moore & Small, 2007). Before we can make a credible claim that some age groups are more or less overconfident, we must show that any such main effect of age persists at different levels of task difficulty. Participants in the easy condition earned a point for each weight estimate that was within 40 pounds of the correct weight. Participants in the hard condition had to get within 3 pounds. (These numbers were determined by a pretest; within 3 pounds participants got about 15% of the weights correct, while within 40 pounds participants got about 85% correct.) Each point served as a lottery ticket for a chance to win one of several $30 prizes.
. We elicited two full Subjective Probability Interval Estimates (SPIES) distributions (Haran, Moore & Morewedge, 2010) of estimated scores. To do this, we asked participants to estimate the probability that they had obtained each of the eleven possible scores (zero through ten). Similarly, we then asked participants to estimate the probability that a randomly selected other participant in the study had obtained each of the eleven possible scores. We asked that all probability distributions summed to 100. We rewarded accurate estimation with lottery tickets for a chance to win a $30 prize. Following Moore and Healy (2008) we employed the incentive-compatible quadratic scoring rule,4 which made it rational for participants trying to maximize their chances of winning the prize to answer honestly using their best probability estimates. The more accurate a participant’s estimates, the better their chances of winning a prize. We included incentives because we cared about generalizing our results to contexts in which decisions have consequences and accurate judgments are rewarded with better outcomes in life.
We could use participants’ responses to compute an expected value estimate of their scores by multiplying each possible score by its reported probability in SPIES. For example, if someone estimated a 50% chance they got a score of 8 and a 50% chance they got a score of 9, then that person’s expected score estimate would be 8.5.
Overestimation was the participant’s expected score estimate minus the participant’s own actual score. For example, if the person expected a score of 8.5 but they actually got 8 out of 10, then the person overestimated their score by half a point.
Overplacement (excessive belief that one is better than others) was the participant’s own estimated score minus the estimated score for others (the expected value of the reported probability distribution), corrected for the degree to which the person was actually better than others (their own actual score minus the average score of others in the same experimental condition). For example, imagine that someone estimated that their score was an 8 and that others, on average, scored 7. If, in reality, that person scored a 7 and others also scored an average of 7, then the person would have overplaced his or her score by 1 point.
Following Moore and Healy (2008), we measured overprecision (excessive faith that one knows the truth) using the confidence participants expressed in their estimates of others’ scores. It is easy to assess the accuracy of this reported probability distribution against the actual distribution of others’ scores. A rational, fully informed individual should report a probability distribution for the score of a randomly-selected other that matches the actual distribution of others’ scores. We computed the difference between the actual variance in scores among the others in the same condition, minus the probability distribution of the participant’s estimate of how a randomly-selected other would perform.
This same calculation is more problematic for assessing the overprecision in people’s estimates of their own scores because we lack individual probability distributions to compare it to—we only have a single actual score for each participant. To say what that probability distribution should look like, we would need to know their subjective assessment (their “private signal”) of their performance on the task. Lacking this, we relied on the precision of people’s estimates of the randomly selected other as our measure of overprecision.
Table 1: Age distribution by study. Distributions for the United States and the world are provided for comparison, using the most recent years for which the US Census Bureau provides data.
Ages < 10 10–19 20–29 30–39 40–49 50–59 60–69 70–79 80–89 90–99 100+
On the basis of a prior plan, we excluded data from 3 participants who failed to provide consistent answers to our two questions about how old they were. We also excluded data from 11 additional participants on the grounds that they represented repeated participation from IP addresses. To reduce the chance that we might exclude different people on the same network, we checked if reported ages and genders matched before excluding these participants. We excluded data from another 7 participants because an error in the survey software tainted their responses. No participants failed the attention check. This left us with a final sample of 183 (81 female, 102 male). Repeating the analysis while including these participants did not materially change the pattern of results we report.
The final sample was skewed young, consistent with the profile of workers on mTurk (Buhrmester, Kwang & Gosling, 2011). They had a median age of 30 years, ranging from 19 to 78. The breakdown of ages for all the studies we present, as well as the U.S. and world population appears in Table 1. Relative to population base rates, younger people are under-represented in our samples due to regulatory limitations on conducting research on those below age 18.
. There were no significant sex differences in overconfidence in overestimation (t(181) = 0.14, p = .88), overplacement (t(181) = 1.57, p = .12), or overprecision (t(181) = 1.22, p = .22).
. Consistent with prior research, overestimation was greater in the hard condition (M = 1.348) than in the easy condition (M = –1.931), t(181) = 9.3, p < .001, 95% CI [2.58, 3.97]. We also replicated the reversal for overplacement. Overplacement was significantly higher in the easy condition (M = 0.377) than in the hard condition (M = –0.294), t(181) = 2.55, p = 0.012, 95% CI [0.15, 1.19].
There was no significant effect of difficulty on overprecision, t(181) = 1.26 p = .210, 95% CI [-0.28, 1.28]. Estimates of the variance in others’ scores was insignificantly lower in the easy (M = 2.76) than the hard (M = 3.43) condition, t(181) = 1.68, p = .095. This difference roughly parallels the actual variance in scores, which was lower in the easy (M = 1.07) than the hard (M = 1.24) condition.5
. Performance on the weight task was not correlated with age r(181) = 0.04, p = .61, 95% CI [-0.11, 0.18]. However, precision in participants’ beliefs was positively correlated with age, indicating that older people have more precise (confident) estimates, r(181) = 0.16, p = .026, 95% CI [-0.30, –0.02].
We did not find evidence of a significant correlation between age and either overestimation, r(181) = –0.067, p = .37, 95% CI [-0.08, 0.21], or overplacement, r(181) = –0.027, p = .72, 95% CI [-0.12, 0.17].
Study 1 correlated age with the three types of overconfidence. Of the three, the evidence was strongest for a correlation between and overprecision. In order to test the replicability of this finding, we gathered an additional 200 participants for the same weight-guessing task, plus two additional tasks.
. In the interests of getting better representation from older age groups, this study employed a panel from Qualtrics that sought better representation among respondents over 50. We opened the survey to 200 participants, offering a payment of $7 based upon Qualtrics’s standard payment rates, plus the chance to win one of three $50 prizes.
Two hundred participants completed the survey online via Qualtrics (128 female; 72 male; Median age = 50). To ensure a diversity of ages, we collected fifty responses in four age brackets (18 to 35, 36 to 50, 51 to 65, 66+) with a minimum age of 19 and a maximum age of 78. In this study we did not require that SPIES responses summed to 100%. Instead, we normalized all reported distributions to 100% after the fact by dividing each probability estimate by the sum of all reported probability estimates. So, for example, a participant could have assigned 60% probability to a score of 8 and 60% probability to a score of 9. We would divide each by the sum total (120%), adjusting each down to 50%. The same method is used in all subsequent studies.
. Immediately following the consent form and before encountering the experimental materials, participants encountered an attention check identical to the one described in Study 1. The survey ejected participants who failed the attention check. Additional comprehension checks preceded each of the three experimental tasks to ensure that participants understood the instructions. Participants were given two chances to pass each of these comprehension checks. Comprehension checks included a question asking them to provide information from the instructions they’d just read, and an overt question asking them if they understood the instructions. If they failed the first comprehension check they were shown the instructions a second time. Those that failed the attention checks or failed the comprehension checks twice were ejected from the survey.
In the interests of replicating and generalizing our measures of precision in judgment, we included three different tasks. Those who passed the attention checks completed those three tasks in a random order. One task was a direct replication of the weight-guessing task in Study 1. As in Study 1’s weight-guessing task, we elicited two full SPIES distributions (Haran et al., 2010) of estimated scores from every participant. One asked for the subjective probability distribution (SPD) of the participant’s own score. The other asked for the SPD of the score of a randomly selected other participant.
A second task presented ten images with a number of black and green dots. Participants estimated the percentage of dots in each image that were black. The third task asked participants to estimate the area of ten irregular shapes. A scale was provided in the shape image, thereby avoiding problems with image scaling. In both the dot estimation and shape area estimation tasks, participants were asked to provide the 5th and 95th quantiles of their subjective probability distributions. For example, “Enter a number so LOW that there is only a 5% chance that the area of the shape is that number or less.” We did not measure overestimation or overplacement on these tasks. Participants learned that accurate performance on these tasks would be rewarded with points that increased their chances of winning one of three $50 prizes.
Two participants did not assign any probability to any score. We excluded these distributions from analysis. No participants failed an attention check twice, and therefore none were excluded from analysis for this reason.
. Again there were no significant sex differences in overconfidence in overestimation (t(198) = 1.59, p = .11) or overprecision (t(198) = 0.72, p = .47). There was a significant difference between men and women for overplacement, such that men (M = 0.37) overplaced more than women (M = –0.42), t(198) = 2.79, p = .006.
. Replicating prior results, overestimation was significantly greater in the hard (M = 1.18) than the easy (M = –3.36) condition, t(198) = 11.97, p < .001, 95% CI [-5.29, –3.79]. Furthermore, participants in the easy condition were more prone to overplacement (M = 0.193) than were those in the hard (M = –0.51) condition, t(198) = 2.56, p = .011, 95% CI [0.16, 1.24]. The results replicate Study 1’s finding that overprecision was not significantly different in the easy and hard conditions (t(198) = 0.39, p = .69, 95% CI [-1.14, 0.76], Easy M = –1.41, Hard M = –1.22).
As before, performance on the weight task was not correlated with age r(198) = 0.04, p = .55, 95% CI [-0.1, 0.18]. Again, we observed a positive relationship between precision and age (r(198) = 0.137, p = .053, 95% CI [-0.27, 0.001]), though it fell just short of statistical significance. The average participant’s precision score did not reach the realm of overprecision. Older participants reported being more sure they knew how others had scored on the weight-guessing task.
The results replicated the findings that neither overestimation nor overplacement were correlated with age (overestimation [r(198) = –0.07, p = .295, 95% CI [-0.21, 0.06]], overplacement [r(198) = –0.04, p = .528, 95% CI [-0.18, 0.09]]).6
We found no correlation between age and precision of confidence intervals on the dot task r(198) = 0.11, p = .12, 95% CI [-0.24, 0.02]. However, we are dubious that this result is informative. Our doubt stems from the fact that many participants provided preposterously wide confidence intervals. This introduces variance that swamps our ability to detect any subtler effects. We believe this was a misguided attempt by participants to improve their performance scores and thereby increase their chances of winning one of our cash prizes. We had planned to score their 5th and 95th quantiles using the incentive-compatible quantile scoring rule provided by Jose and Winkler (2009). However, participants who expected us to score their quantiles as accurate if the right answer was between them would have erroneously believed they could improve their score by providing quantiles that were as far apart as possible.
This concern led us to conduct analyses using a subset of the data, dropping the widest confidence intervals. Acknowledging that any cutoff would be arbitrary, we conducted a series of correlations using cutoffs from 100% black dots on down to 0% black dots. At no point did the correlation with age attain significance. This could be because many of the ranges that participants gave us were affected by an attempt to game the payoff scheme, or because age does not affect precision in judgment, at least not for this type of measure or for this type of task.
. Likewise, the shape data did not show any significant correlation between age and overprecision r(198) = 0.03, p = .62, 95% CI [-0.17, 0.10]. Again, we conducted a series of correlations using cutoffs from 500 on down to zero. At no point did the correlation reach significance.
The results of the first two studies made us suspect that we had under-powered them. If the true correlation between age and precision in judgment is .14, then a sample size of 200 would only have given us about a 50% chance of obtaining a significant result. Seeking a more powerful replication, we repeated the weight-guessing task a third time with a pre-determined sample size of 500, and included a modified shape task to test age and overprecision using confidence intervals rather than probability distributions. This time, we turned back to an mTurk sample because that made it possible for us to increase our sample size without having to take out another mortgage.
. We offered $1 based upon mTurk’s standard payment rates. In addition, we offered each participant the chance to win one of several $30 prizes.
. The study was a replication of Study 1, using the weight-guessing task. In addition, we added one new estimation task at the end.
In the second task participants estimated the area of an irregular shape by answering two questions:
Hoping to avoid the incentive problems from Study 2, we incentivized performance only on the initial weight-guessing task; not on the shape task.
Five hundred participants completed the survey online via mTurk (244 female; 246 male; Median age = 33). Ages ranged from 18 to 75. As we had planned to do, we excluded 25 participants from analysis for providing inconsistent responses to questions about their age, and 11 repeat responses. Including these participants did not change the pattern of results in any significant manner. Two participants failed the attention check and were ejected from the survey. Their ages were 19 and 22.
. Again there were no significant sex differences in overconfidence in overplacement (t(462) = –0.88, p = .37), or overprecision (t(462) = –0.08, p = .94). There was, however, a difference in overestimation such that males (M = 0.24, SD = 2.87) overestimated more than females [M = –0.46, SD = 3.39; t(462) = –2.41, p = .02, 95% CI [-1.27, –0.13]].
As before, participants were significantly more prone to overestimation in the hard condition (M = 1.589), while they were prone to underestimation in the easy condition (M = –1.629), t(462) = 12.73, p < 0.001, 95% CI [-3.71, –2.72]. Participants also overplaced more in the easy condition, (M = 0.378) than in the hard condition (M = –0.24), t(462) = 3.2, p = .001, 95% CI [0.24, 1.00].
Participants were significantly more overprecise in the hard condition (M = –2.39) than in the easy condition (M = –1.09; t(462) = 4.33, p < 0.001, 95% CI [0.71, 1.89]). This result comes as a surprise, as we did not get this result in Studies 1 or 2.
. As before, score (r(462) = 0.02, p = .64, 95% CI [-0.06, 0.11]), overestimation (r(462) = –0.004, p = .935, 95% CI [-0.09, 0.10]), and overplacement (r(462) = –0.04, p = .347, 95% CI [-0.13, 0.05]) were not correlated with age. The data from this study, however failed to reveal a significant correlation between age and overprecision r(462) = 0.021, p = 0.649, 95% CI [-0.11, 0.07].
Consistent with prior research, we observe overprecision in how people set their confidence intervals. If participants had set their 5th and 95th quantiles accurately, 90% of them should have included the right answer. Instead, only 20% of them do. However, the width of their confidence intervals did not correlate with age, r(462) = –0.005, p = 0.915, 95% CI [-0.10, 0.09]. We did, however, found a significant correlation between range size and Jose-Winkler score, suggesting that there was a general tendency toward making ranges too narrow, r(462) = -0.55 p < .001, 95% CI [-0.61, –0.48].
In an attempt to achieve an estimate of the correlation between age and overprecision across the three studies, we conducted a meta-analysis of the weight task results from Studies 1, 2, and 3. The results revealed a significant correlation between age and overprecision, r(846) = 0.08, p = .019. In order to test the robustness of this result, we conducted another study.
. We decided to aim for a sample size of 802: 602 mTurkers and 200 recruited through a Qualtrics panel. This second group was included in an attempt to get better representation from adults over 50, since mTurkers tend to be younger than the general U.S. population. We selected the sample size hoping for an 80% chance of detecting a correlation of the size indicated by our meta-analysis. All participants were offered a chance at winning one of several $50 prizes based upon their performance.
. Study 4 was an almost exact replication of Study 3, with two changes to the shape task. After seeing the shape, we asked participants for their best guess about the shape’s area. Then we asked them “How likely do you think it is that your answer is within 10 units (above or below) of the actual area?”
Finally, we again asked participants to provide their 5th and 95th quantiles, and explicitly warned against setting overly-large ranges.
Six hundred and twelve mTurkers and 200 members of Qualtrics Panels completed the survey online via Qualtrics. Participants’ ages ranged from 18 to 84.
As we previously decided, we dropped data from 22 participants who reported inconsistent ages, and from seven duplicate responses for a final total of 783 participants (382 female; 401 male; Median age = 34). As before, including these participants did not materially affect our results. No participants failed the attention check and none were ejected from the survey for this reason.
Sex differences. Again there were no significant sex differences in overconfidence in overestimation (t(781) = 0.43, p = .67, 95% CI [-0.37, 0.57]). There were, however, significant differences for overplacement and overprecision. Men (M = 0.36, SD = 1.73) overplaced significantly more than women, [M = 0.01, SD = 1.76; t(781) = 2.73, p = .006, 95% CI [-0.59, –0.97]]. And women (M = 3.87, SD = 2.95) were more precise than men [M = 3.28, SD = 3.09; t(781) = 2.73, p = .006, 95% CI [0.17, 1.01]].
As in previous studies, participants overestimated more in the hard condition (M = 2.57) than in the easy condition (M = –2.36) t(781) = 30.63, p < 0.001, 95% CI [-5.24, –4.61]. In addition, we again replicated our finding that participants overplaced in the easy condition (M = 0.496) and underplaced in the hard condition (M = –0.142), t(781) = 5.13, p < 0.001, 95% CI [0.39, 0.88].
The results show a significant difference in levels of overprecision between the easy (M = –3.30) and hard conditions (M = –3.86), t(781) = 2.58, p = .01, 95% CI [0.12, 0.98]. Again, both groups were underprecise, but the easy group was more precise than the hard group. This difference goes in the opposite direction of the difference in Study 3. Given that we didn’t hypothesize these contradictory results, lack a good explanation for them, and the effects are small, we are inclined to identify them as false positives that are unlikely to replicate and therefore do not merit an explanation.
As before, age was not correlated with performance on the weight guessing task, r(781) = 0.04, p = .24, 95% CI [-0.03, 0.11]. Our main result is a significant correlation between age and overprecision, r(781) = 0.16, p < .001, 95% CI [0.09, 0.23]. This analysis examines the comparison between variance in the probability distributions participants report for others’ scores with the actual variance of others’ scores.
In addition, we again conducted the simpler analysis asking how sure people were that they had correctly estimated their own scores. On average, participants reported being 34% sure they had correctly estimated their own scores. In fact, they were right only 12% of the time, a significant difference by one-sample t-test, t(781) = 20.98, p < .001, 95% CI [0.32, 0.36]. Replicating Study 1, participants’ confidence that they had correctly estimated their own score was correlated with age, r (781) = .24, p <0.001, 95% CI [0.17, 0.31].
The data replicate the previous findings that neither overestimation (r(781) = –0.05, p = .159, 95% CI [-0.02, 0.12]) nor overplacement (r(781) = –0.02, p = .63, 95% CI [-0.05, 0.87]) was correlated with age.
Figure 1: A scatterplot that displays the distribution of overprecision scores across all studies.
Only 38.8% of participants got the right answer between their 5th and 95th quantiles. Relative to a 90% benchmark, this represents evidence of overprecision. We divided the sample into age groups by decade in order to investigate differences in hit rates. Point biserial correlation found no significant correlation between age and hit rates (rpb(781) = –.04, p = .27). Furthermore, we evaluated participants’ 5th and 95th quantiles using Jose and Winkler’s (2009) scoring rule. These scores are not significantly correlated with age, r(781) = 0.056, p = .116, 95% CI [-0.01, 0.13].
In addition, we asked participants for point estimates. On average, participants reported being 49.6% sure that these estimates are within 10 units of the true value. However, only 7.4% of them are, again reflecting overprecision in item-confidence judgments. However, on this measure there was no significant correlation between confidence and age, r(781) = 0.031, p = .388.
Adding the data from Study 4 to all the other data we had collected, we conducted a second meta-analysis. This analysis revealed a significant correlation between age and precision in the estimates of others’ scores in the expected direction, r(1631) = 0.11, p = .003, 95% CI [.04, .19]. An additional meta-analysis of the correlation between age and overconfidence in estimation of one’s own score revealed a significant positive correlation r(1631) = 0.13, p = .013, 95% CI [.03, .24], as shown in Figure 1.
Prior research has indicated that age and overconfidence are both correlated with numeracy. As age and overconfidence increase, numeracy decreases (Bruine de Bruin, Fischoff, Millstein & Halpern-Felsher, 2000; Winman, Juslin, Lindskog, Nilsson & Kerimi, 2014). In particular, older adults tend to rely on focal points when providing probability estimates (Lillard & Willis, 2001). We analyzed this in our data by identifying what percentage of potential responses fell on the 0% or 100% focal points. Indeed, an analysis using data from all four studies shows, predictably, that overprecision is strongly correlated with reliance on focal points (r(1631) = .71, p < .001). More interestingly, reliance on focal points is correlated with age as well, r(1631) = .14, p = .006.
In order to determine whether the correlation between age and overprecision could be accounted for by the focal point response bias, we performed an analysis to test the mediating effect of reliance on focal points on the relationship between age and overprecision using the data from Study 4. In order to reduce Type II error and increase power, we used a bootstrapping non-parametric sampling procedure. The following estimates are based upon 1000 bootstrap samples. There was a significant total relationship between age and precision (b = 0.022 (0.01), p = .024, unstandardized β = 2.26). Age was positively associated with increased reliance on focal responses (b = 0.004 (0.001), p < .001, β = 3.57). In this model focal responses were not related to precision (b = 0.35 (0.98), p = .722, β = 0.35). Mediational analysis did not find evidence of an indirect effect of age on precision through reliance on focal probabilities (b = 0.001 (0.004), p = .741, β = 0.33). The relationship between age and precision remained significant (b = 0.02 (0.009), p = .027, β = 2.22).
Our meta-analysis found a positive correlation between age and judgmental precision in Studies 1 through 4. However, it remains possible that our results are biased by the populations from which we have been drawing our participants. In particular, different sorts of old and young people may be active on Amazon’s Mechanical Turk. If the older people who find their way onto mTurk or the online samples we obtained through Qualtrics are among the more computer-savvy and sharp-witted of their age cohort, then our sampling method may have made it harder for us to find real age differences that exist in the broader population. In order to address this concern, we employed a novel sampling method in Study 5 and also included a measure of fluid intelligence as a direct measure of sharp-wittedness.
We aimed for a sample size of 550, which we had estimated would give us an 80% chance of detecting a correlation of the size indicated by our meta-analysis. Rather than use an online panel service such as Qualtrics or mTurk, we sought a population with similar selection pressures for all age cohorts. The population we turned to was the alumni of the Haas School of Business at the University of California at Berkeley. The School’s mailing list includes 14,055 alumni of the School’s undergraduate business program. Anticipating a low response rate, we sent invitations to the entire group. Unfortunately, the response rate was even worse than we expected and three reminder emails ultimately produced only 310 valid responses.
Study 5 was very similar to Study 4, with one notable addition. After the shape task we included a 9-item form of Raven’s Progressive Matricies to measure fluid intelligence (Bilker et al., 2012). We did not include an attention check in this study.
Consistent with a prior plan, we dropped data from 5 participants who reported inconsistent ages, leaving us with a total of 305 participants (130 female; 175 male; Median age = 47, range: 21 to 94). As with all previous studies, the inclusion of these participants did not materially change the pattern of results.
Again, sex differences in overestimation did not attain statistical significance, t(302) = 0.43, p = .06. There were, however, differences in overplacement. Men (M = 0.42, SD = 1.58) overplaced more than women, M = –0.17, SD = 1.26; t(302) = 3.51, p < .001. There was not a significant difference in precision for women and men, t(302) = 1.56, p = .12.
As in previous studies, participants overestimated more in the hard condition (M = 2.42, SD = 1.89) and underestimated in the easy condition (M = –2.03, SD = 2.24), t(302) = 18.73, p < 0.001. In addition, we again replicated our finding that participants overplaced in the easy condition (M = 0.48, SD = 1.44) and underplaced in the hard condition (M = –0.15, SD = 1.45), t(302) = 3.83, p < 0.001.
The results show a significant difference in levels of precision between the easy (M = –2.26, SD = 3.39) and hard conditions (M = –3.90, SD = 2.61), t(302) = 4.73, p < 0.001. Again, both groups were underprecise, but the easy group was more precise than the hard group. This difference goes in the opposite direction of the difference in Study 3, but the same direction as Study 4.
As before, age was not correlated with performance on the weight-guessing task, r(303) = 0.01, p = .84. Our main result is a significant correlation between age and precision, r(302) = 0.14, p = 0.01, 95% CI [0.03, 0.25]. In order to assess the degree to which this age difference could be accounted for by fluid intelligence, we regressed precision on age, with and without the Raven’s score in the model. The regression coefficient was essentially unchanged when the Raven’s score was added to the model (β of 0.224 without it, 0.222 with it). Age did correlate negatively with the Raven’s score (r(308) = –0.25, p = 0.00, 95% CI [-0.35, -0.15]), but the Raven’s score did not correlate with precision (r(302) = -.03, p = .596).
In addition, we again conducted the simpler analysis asking how sure people were that they had correctly estimated their own scores. On average, participants reported being 40% sure they had correctly estimated their own scores. In fact, they were right only 22% of the time, a significant difference by one-sample t-test, t(303) = 9.11, p < .001. Replicating Studies 1 and 4, participants’ confidence that they had correctly estimated their own scores was correlated with age, r (302) = .26, p < 0.001.
The results replicated the previous findings that overestimation (r(302) = 0.09, p = 0.11) was not significantly correlated with age. However, overplacement was positively correlated with age, (r(302) = 0.17, p = .002). Since we did not find this correlation in any other study, we are dubious of its generality.
Only 28.8% of participants got the right answer between their 5th and 95th quantiles. Relative to a 90% benchmark, this represents evidence of overprecision. A point-biserial correlation found no significant relationship between hit rate and age r(303) = .05, p = .334. Furthermore, we evaluated participants’ 5th and 95th quantiles using Jose and Winkler’s (2009) scoring rule. These scores are not significantly correlated with age, r(303) = –.01, p = 0.85.
We asked participants for a point estimate of the shape’s area. On average, participants reported being 57.5% sure that their estimates were within 10 units of the true value. However, only 39.3% of them are, again reflecting overprecision in item-confidence judgments. However, on this measure there was no significant correlation between confidence and age, r(303) = 0.08, p = 0.167.
In order to determine whether the correlation between age and overprecision could be accounted for by the focal point response bias, we performed an analysis to test the mediating effect of reliance on focal points on the relationship between age and overprecision using the data from Study 5. In order to reduce Type II error and increase power, we used a bootstrapping non-parametric sampling procedure. The following estimates are based upon 1000 bootstrap samples. Our total effect was significant, indicating that age positively predicted higher levels of precision (b = 0.03 (0.007), p < .001, β = 4.32). Age was positively associated with increased reliance on focal responses (b = 0.005 (0.001), p < .001, β = 6.19). In this model focal responses were not, however, related to precision (b = 0.24 (1.57), p = .878, β = 0.15). Mediational analysis did not find a significant indirect effect (b = 0.001 (0.008), p = .883, β = 0.15). The relationship between age and precision remained significant (b = 0.03 (0.01), p = .003, β = 2.98).
Our results replicate key features of the research literature on overconfidence. In particular, we find consistent evidence for the influence of task difficulty on estimation and placement. Because people estimate performance with noise, we obtain overestimation and underplacement for hard tasks; for easy tasks we obtain underestimation and overplacement. We do not find that these effects are moderated by age.
Our more novel findings center on overprecision. We find evidence that precision in judgment increases with age. This result contradicts the proposition that a lifetime of experience, and of being wrong, would dampen the bold claims of confidence to which so many of us are prone. Instead, in this particular case, it appears that older people are more likely to claim that they know the truth. These effect sizes are modest and require substantial sample sizes to detect as statistically significant. Nevertheless, the implications of our finding are potentially important. If people’s confidence in the accuracy of their beliefs increases with age, then we might expect that people become more set in their beliefs, more ideologically extreme, and more resistant to persuasion as they age (Ortoleva & Snowberg, 2015).
It is striking, however, that even with our substantial sample sizes, we do not find any evidence of correlations with age and either overestimation or overplacement. Across our studies, older people were no more likely to claim that they were better than they were (overestimation) or to claim that they were better than others (overplacement). This is important, because it clarifies precisely how confidence changes with age. Interestingly, this result is at odds with the lay stereotype that young people are more likely to overestimate their abilities. We find no evidence to support this notion. While it is possible that young people may not specifically be inclined to overestimate their performance guessing others’ weight, this raises the question of exactly which domains would be most likely to reveal such overestimation. Our results cannot provide guidance on this question, but they do suggest that at least in this one domain, young people are no more likely to overestimate themselves.
We must also note that different measures of overprecision in judgment do not produce entirely consistent results. Probability judgments, both SPIES elicitations and item-confidence judgments, generally show positive correlations between age and precision in judgment. However, confidence-interval widths do not correlate with age. These inconsistent results are (ironically) consistent with prior research: confidence intervals are weakly correlated with other measures of confidence (Moore et al., 2016). Although any statistician will tell you that they are different measures of the same underlying construct, the psychological processes that produce quantile judgments like confidence intervals appear to be different from the processes that give rise to probability judgments like SPIES or item-confidence (Klayman, Soll, Gonzalez-Vallejo & Barlas, 1999).
But we should also admit inconsistencies among our different probabilistic confidence judgments. SPIES distributions were generally underprecise. On average, people reported being less sure than they deserved to be about how others would perform on the weight-guessing task. While some studies have found overprecision in probability distributions elicited with SPIES (Haran et al., 2010; Moore & Healy, 2008), we are not the first to have found underprecision (Moore, Carter & Yang, 2015). On the other hand, item-confidence judgments consistently produce overprecision. People report being too sure they know how they scored and too sure they know the area of an irregular shape. Again, whether results show an overall tendency toward overconfidence or underconfidence says more about the nature of the different measures than they do about changes in confidence with age.
We are limited by the cross-sectional nature of our samples; it is possible that our results are attributable more to an intergenerational phenomenon rather than a change in judgment with age. If this is true, then 40 years from now, the young people in our sample will still be less confident in the accuracy of their judgment than our older participants were in their youth. Testing this hypothesis would require longitudinal data that tracks individuals and measures changes in their confidence as they age and mature. This idea immediately inspires questions of the degree to which differences might be attributable to changes in cultural modes of expression, as well as influences of mass media and technological change in different eras in which our participants came of age.
Moreover, we must concede that there are many dimensions on which young and old differ. Age brings increases in crystallized intelligence but declines in fluid intelligence (Horn & Cattell, 1967). Old people are generally happier than young people but less healthy (Frijters & Beatton, 2012). And of course age brings changes in one’s social, professional, and familial identities (Logan, Ward & Spitze, 1992). Any of these dimensions may account for our results. Needless to say, since it is difficult to exogenously manipulate age, we are left with correlational research designs and commensurate ambiguity about causal mechanisms.
We must also note the idiosyncratic nature of our confidence measures. Guessing weights, let alone estimating performance on a weight-guessing task using a probabilistic SPIES elicitation, is not something most people do every day. The reason why we used these tasks, of course, is that they afford the possibility of strong claims about the accuracy and calibration of our participants’ confidence judgments. But we must readily admit that they are quite different from the way that confidence expresses itself in everyday life. People express confidence by stating their opinions earlier and louder than others (Kennedy, Anderson & Moore, 2013). Confident people are resistant to influence or persuasion (Minson & Mueller, 2012). And confidence can translate into bold choices that fail to take into account the possibility that one’s beliefs might be in error (Mannes & Moore, 2013). Given the inconsistent results between the different ways in which we measure precision in judgment, we have little confidence that our results will generalize to these different forms of confidence expression. More research is obviously necessary.
As long as we are admitting the shortcomings of our measures, we must confess a problem with our evidence, one that we share with the broader literature on overconfidence. It is awkward enough that the three varieties of overconfidence — overestimation, overplacement, and overprecision — correlate so poorly with one another. But it is downright embarrassing how poorly different measures of overprecision correlate with one another. We observe underprecision when we test for the variance in subjective probability distributions, yet obtain massive overprecision in item-confidence and 90% confidence interval measures. Yet even item-confidence and 90% CI measures do not correlate strongly with each other. Indeed, the large differences we observe between different measures of precision in judgment demonstrate that the details of the elicitation matter a great deal. They matter so much, in fact, that it might leave a skeptical reader dubious that any of them are measuring a deep psychological construct and suspicious that the results are all epiphenomenal to the different ways that the question is posed.
What are the consequences for risky choice or openness to persuasion? Our results imply that older people may, at least under some circumstances, be more likely to have their choices, judgments, and behaviors biased by overprecision in judgment. We hope that these results stimulate future research that can help identify not only the underlying psychological causes of age-related changes in confidence but also their behavioral consequences.
Babcock, L., & Loewenstein, G. (1997). Explaining bargaining impasse: The role of self-serving biases. Journal of Economic Perspectives, 11(1), 109–126.
Balogh, K., Mayes, L., & Potenza, M. (2013). Risk-taking and decision-making in youth: Relationships to addiction vulnerability. Journal of Behavioral Addictions, 2(1), 1–9.
Bilker, W. B., Hansen, J. A., Brensinger, C. M., Richard, J., Gur, R. E., & Gur, R. C. (2012). Development of abbreviated nine-item forms of the Raven’s Standard Progressive Matrices Test. Assessment, 19(3), 354–369.
Brier, G. W. (1950). Verification of forecasts expressed in terms of probability. Monthly Weather Review, 78(1), 1–3.
de Bruin, W. B., Fischhoff, B., Millstein, S. G., & Halpern-Felsher, B. L. (2000). Verbal and numerical expressions of probability: “It’s a fifty–fifty chance”. Organizational behavior and human decision processes, 81(1), 115–131.
Bruine de Bruin, W., Parker, A. M., & Fischhoff, B. (2012). Explaining adult age differences in decision-making competence. Journal of Behavioral Decision Making, 25(4), 352–360.
Budescu, D. V, & Du, N. (2007). The coherence and consistency of investors’ probability judgments. Management Science, 53(11), 1731–1745.
Buhrmester, M., Kwang, T., & Gosling, S. D. (2011). Amazon’s Mechanical Turk a new source of inexpensive, yet high-quality, data? Perspectives on Psychological Science, 6(1), 3–5.
Burson, K. A., Larrick, R. P., & Klayman, J. (2006). Skilled or unskilled, but still unaware of it: How perceptions of difficulty drive miscalibration in relative comparisons. Journal of Personality and Social Psychology, 90(1), 60–77.
Crawford, J. D., & Stankov, L. (1996). Age differences in the realism of confidence judgements: A calibration study using tests of fluid and crystallized intelligence. Learning and Individual Differences, 8(2), 83–103.
Darley, J. M., & Fazio, R. H. (1980). Expectancy confirmation processes arising in the social interaction sequence. American Psychologist, 35(10), 867.
Erev, I., Wallsten, T. S., & Budescu, D. V. (1994). Simultaneous over- and underconfidence: The role of error in judgment processes. Psychological Review, 101(3), 519–527.
Ferrell, W. R., & McGoey, P. J. (1980). A model of calibration for subjective probabilities. Organizational Behavior and Human Performance, 26(1), 32–53.
Frijters, P., & Beatton, T. (2012). The mystery of the U-shaped relationship between happiness and age. Journal of Economic Behavior & Organization, 82(2), 525–542.
Hansson, P., Rönnlund, M., Juslin, P., & Nilsson, L.-G. (2008). Adult age differences in the realism of confidence judgments: Overconfidence, format dependence, and cognitive predictors. Psychology and Aging, 23(3), 531–544.
Haran, U., Moore, D. A., & Morewedge, C. K. (2010). A simple remedy for overprecision in judgment. Judgment and Decision Making, 5(7), 467–476. article.
Harvey, N. (1997). Confidence in judgment. Trends in Cognitive Sciences, 1(2), 78–82.
Horn, J. L., & Cattell, R. B. (1967). Age differences in fluid and crystallized intelligence. Acta Psychologica, 26, 107–129.
Jose, V. R. R., & Winkler, R. L. (2009). Evaluating quantile assessments. Operations Research, 57(5), 1287–1297.
Kahneman, D. (2011). Thinking fast and slow. New York: Farrar, Straus and Giroux.
Kennedy, J. A., Anderson, C., & Moore, D. A. (2013). When overconfidence is revealed to others: Testing the status-enhancement theory of overconfidence. Organizational Behavior and Human Decision Processes, 122(2), 266–279.
Keren, G. (1987). Facing uncertainty in the game of bridge: A calibration study. Organizational Behavior and Human Decision Processes, 39(1), 98–114.
Klayman, J., Soll, J. B., Gonzalez-Vallejo, C., & Barlas, S. (1999). Overconfidence: It depends on how, what, and whom you ask. Organizational Behavior and Human Decision Processes, 79(3), 216–247. article.
Kovalchik, S., Camerer, C. F., Grether, D. M., Plott, C. R., & Allman, J. M. (2005). Aging and decision making: A comparison between neurologically healthy elderly and young individuals. Journal of Economic Behavior & Organization, 58(1), 79–94.
Kruger, J. (1999). Lake Wobegon be gone! The “below-average effect” and the egocentric nature of comparative ability judgments. Journal of Personality and Social Psychology, 77(2), 221–232.
Kruger, J., & Dunning, D. (1999). Unskilled and unaware of it: How difficulties in recognizing one’s own incompetence lead to inflated self-assessments. Journal of Personality and Social Psychology, 77(6), 1121–1134.
Larrick, R. P., Burson, K. A., & Soll, J. B. (2007). Social comparison and confidence: When thinking you’re better than average predicts overconfidence (and when it does not). Organizational Behavior & Human Decision Processes, 102(1), 76–94.
Lillard, L., & Willis, R. J. (2001). Cognition and wealth: The importance of probabilistic thinking. Michigan Retirement Research Center Working Paper No. 007. http://www.mrrc.isr.umich.edu/publications/papers/pdf/wp007.pdf.
Logan, J. R., Ward, R., & Spitze, G. (1992). As old as you feel: Age identity in middle and later life. Social Forces, 71(2), 451–467.
Lord, C. G., Ross, L., & Lepper, M. R. (1979). Biased assimilation and attitude polarization. Journal of Personality and Social Psychology, 37(11), 2098–2109.
Mahajan, J. (1992). The overconfidence effect in marketing management predictions. Journal of Marketing Research, 29(3), 329–342.
Makridakis, S., Hogarth, R. M., & Gaba, A. (2009). Forecasting and uncertainty in the economic and business world. International Journal of Forecasting, 25(4), 794–812.
Mann, S., Vrij, A., & Bull, R. (2004). Detecting true lies: police officers’ ability to detect suspects’ lies. Journal of Applied Psychology, 89(1), 137.
Mannes, A. E., & Moore, D. A. (2013). A behavioral demonstration of overconfidence in judgment. Psychological Science, 24(7), 1190–1197. article.
McKenzie, C. R. M., Liersch, M. J., & Yaniv, I. (2008). Overconfidence in interval estimates: What does expertise buy you? Organizational Behavior & Human Decision Processes, 107, 179–191.
Minson, J. A., Liberman, V., & Ross, L. (2009). Two to tango: The effect of collaborative experience and disagreement on dyadic judgment. Personality and Social Psychology Bulletin, 37(10), 1325–1338.
Minson, J. A., & Mueller, J. (2012). Two is company and four is a crowd? Advice under-utilization by individuals and dyads. Psychological Science,
Moore, D. A. (2007). Not so above average after all: When people believe they are worse than average and its implications for theories of bias in social comparison. Organizational Behavior and Human Decision Processes, 102(1), 42–58.
Moore, D. A., Carter, A., & Yang, H. H. J. (2015). Wide of the mark: Evidence on the underlying causes of overprecision in judgment. Organizational Behavior and Human Decision Processes, 131(1), 110–120.
Moore, D. A., & Healy, P. J. (2008). The trouble with overconfidence. Psychological Review, 115(2), 502–517.
Moore, D. A., & Klein, W. M. P. (2008). The use of absolute and comparative performance feedback in absolute and comparative judgments and decisions. Organizational Behavior & Human Decision Processes, 107, 60–74.
Moore, D. A., & Small, D. A. (2007). Error and bias in comparative social judgment: On being both better and worse than we think we are. Journal of Personality and Social Psychology, 92(6), 972–989. http://doi.org/10.1037/0022-3514.92.6.972.
Moore, D. A., Tenney, E. R., & Haran, U. (2016). Overprecision in judgment. In G. Wu & G. Keren (Eds.), Handbook of Judgment and Decision Making (pp. 182–212). New York: Wiley.
Murphy, A. H., & Winkler, R. L. (1977). Can weather forecasters formulate reliable probability forecasts of precipitation and temperature? National Weather Digest, 2, 2–9.
Neale, M. A., & Bazerman, M. H. (1985). The effects of framing and negotiator overconfidence on bargaining behaviors and outcomes. Academy of Management Journal, 28(1), 34–49.
Odean, T. (1998). Volume, volatility, price, and profit when all traders are above average. Journal of Finance, 53(6), 1887–1934.
Odean, T. (1999). Do investors trade too much? American Economic Review, 89(5), 1279–1298.
Önkal, D., Yates, J. F., Simga-Mugan, C., & Öztin, S. (2003). Professional vs. amateur judgment accuracy: The case of foreign exchange rates. Organizational Behavior and Human Decision Processes, 91(2), 169–185.
Ortoleva, P., & Snowberg, E. (2015). Overconfidence in political behavior. American Economic Review, 105(2), 504–535.
Plous, S. (1993). The psychology of judgment and decision making. book, New York: McGraw-Hill.
Quadrel, M. J., Fischhoff, B., & Davis, W. (1993). Adolescent (in) vulnerability. American Psychologist, 48(2), 102–116.
Reyna, V. F. (2012). The adolescent brain. Washington, DC: American Psychological Association.
Sah, S., Moore, D. A., & MacCoun, R. J. (2013). Cheap talk and credibility: The consequences of confidence and accuracy on advisor credibility and persuasiveness. Organizational Behavior and Human Decision Processes, 121(2), 246–255.
Schulz, K. (2010). Being wrong. New York: Ecco.
Snyder, M., & Swann, W. B. (1978). Hypothesis-testing processes in social interaction. Journal of Personality and Social Psychology, 36(11), 1202–1212.
Snyder, M., Tanke, E. D., & Berscheid, E. (1977). Social perception and interpersonal behavior: On the self-fulfilling nature of social stereotypes. Journal of Personality and Social Psychology, 35(9), 656–666.
Tränkle, U., Gelau, C., & Metker, T. (1990). Risk perception and age-specific accidents of young drivers. Accident Analysis & Prevention, 22(2), 119–125.
Weinstein, N. D., & Lyon, J. E. (1999). Mindset, optimistic bias about personal risk and health-protective behaviour. British Journal of Health Psychology, 4(4), 289–300.
Winman, A., Juslin, P., Lindskog, M., Nilsson, H., & Kerimi, N. (2014). The role of ANS acuity and numeracy for the calibration and the coherence of subjective probability judgments. Frontiers in Psychology, 5, 851.
This research was supported in part by pilot funding from the Berkeley Center on the Economics and Demography of Aging (CEDA), through NIA grant 2P30AG012839. Data, materials, and pre-registrations: http://osf.io/nmrp5. Thanks to Cameron Anderson for exceedingly useful feedback.
Copyright: © 2017. The authors license this article under the terms of the Creative Commons Attribution 3.0 License.
This document was translated from LATEX by HEVEA.