The less-is-more effect predicts that people can be more accurate
making paired-comparison decisions when they have less knowledge, in
the sense that they do not recognize all of the items in the
decision domain. The traditional theoretical explanation is that
decisions based on recognizing one alternative but not the other can
be more accurate than decisions based on partial knowledge of both
alternatives. I present new data that directly test for the
less-is-more effect, coming from a task in which participants judge
which of two cities is larger and indicate whether they recognize
each city. A group-level analysis of these data provides evidence in
favor of the less-is-more effect: there is strong evidence people
make decisions consistent with recognition, and that these decisions
are more accurate than those based on knowledge. An individual-level
analysis of the same data, however, provides evidence inconsistent
with a simple interpretation of the less-is-more effect: there is no
evidence for an inverse-U-shaped relationship between accuracy and
recognition, and especially no evidence that individuals who
recognize a moderate number of cities outperform individuals who
recognize many cities. I suggest a reconciliation of these
contrasting findings, based on the systematic change of the accuracy
of recognition-based decisions with the underlying recognition
rate. In particular, the data show that people who recognize almost
none or almost all cities make more accurate decisions by applying
the recognition heuristic, when compared to the accuracy achieved by
people with intermediate recognition rates. The implications of these
findings for precisely defining and understanding the less-is-more
effect are discussed, as are the constraints our data potentially
place on models of the learning and decision-making processes
involved.
Keywords: recognition heuristic, less-is-more effect.
1 Introduction
Perhaps the simplest heuristic proposed within the “fast and frugal”
approach to understanding human decision making developed by
Gigerenzer et al. [1999] is the recognition heuristic
(Goldstein and Gigerenzer [2002]). It applies to the common
decision-making situation in which a decision maker must choose
between two presented alternatives on the basis of some criterion. The
recognition heuristic assumes that, when decision makers recognize one
of the alternatives, but not the other, they choose the recognized
alternative. Thus, if a decision maker is asked whether Frankfurt or
Paderborn has the greater population, and has only heard of Frankfurt,
then Frankfurt will be chosen based on recognition.
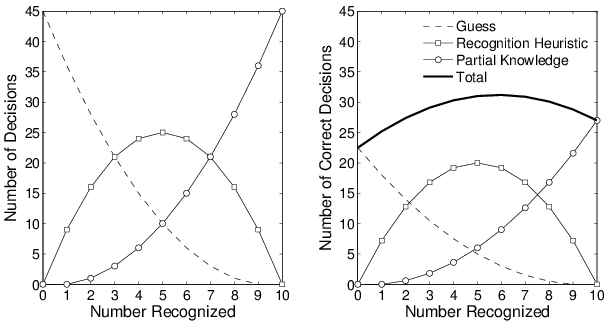
Figure 1: The intuition underlying the less-is-more effect. The left
panel shows the number of decisions out of a total of 45 made by
guessing, recognition, and partial knowledge as the number of
recognized alternatives increases from 0 to 10. The right panel
shows the number of correct decisions made by guessing,
recognition, and partial knowledge, assuming accuracy rates of
0.5, 0.8, and 0.6 respectively. The total number of correct
decisions is shown by the solid line, and peaks when 6 out of 10
alternatives are recognized.
The recognition heuristic has been widely studied, both empirically
and theoretically. Empirically, the use of the recognition heuristic
under various experimental manipulations has been studied for
questions including the population of cities, the length of rivers,
the age of famous people, and so on
(e.g., Bröder and Eichler [2006], Hoffrage [2011], Oppenheimer [2003], Pohl [2006]). Theoretically,
there has been work at both the algorithmic level in Marr’s (1982)
hierarchy, studying how the recognition heuristic
can be integrated with process models of related elements of cognition
such as memory (e.g., Erdfelder et al. [2011], Pleskac [2007]), and at the
computational level, studying its optimality properties with respect
to different decision-making environments
(e.g., Davis-Stober et al.,2010, Katsikopoulos [2010], Smithson [2010]). The
usefulness of the recognition heuristic as a means of making decisions
has also been studied in a number of applied contexts, including
predicting the winners of sporting competitions
(e.g., Herzog and Hertwig [2011], Pachur and Biele [2007],
Scheibehenne and Bröder [2007], Serwe and Frings [2006]),
political elections (Gaissmaier and Marewski [2011]), consumer choice
(Hilbig [2014], Oeusoonthornwattana and Shanks [2010]), and choosing stock
market portfolios (Andersson and Rakow [2007], Borges et al. [1999]). A
relatively recent series of three special issues on the recognition
heuristic in this journal provides an excellent survey
(Marewski et al. [2010], Marewski et al. [2011]a,Marewski et al. [2011]b), including
many of the articles cited above, as well as the reflections,
evaluations, and perspectives of those who developed the heuristic
(Gigerenzer and Goldstein [2011]).
One interesting prediction based on the use of the recognition
heuristic is the “less-is-more” effect
(Goldstein and Gigerenzer [2002]). The premise is that it is possible
that the decisions made by the recognition heuristic (applicable when
only one alternative is recognized) could be more accurate than
decisions made on the basis of partial knowledge (applicable when both
alternatives are recognized). When this assumption is met, people who
recognize all of the alternatives will have a lower overall accuracy
than at least some people who do not recognize all of the
alternatives. Knowing less about the alternatives leads to the more
accurate decisions, and this is coined the less-is-more effect.
Formal analyses proving the less-is-more result were provided
originally by Goldstein and Gigerenzer [2002], and have been carefully
analyzed and generalized by Katsikopoulos [2010] and
Smithson [2010]. An important generalization has involved
considering the potential role of recognition memory in the
recognition heuristic, and its impact on predictions about the
less-is-more effect. In this paper, I consider only the
original statement of the effect, which assumes that recognition
memory is perfect, and provides the simplest framework for
analysis. The key intuition of these formal analyses—which
(Katsikopoulos [2010] p. 249) terms the accurate
heuristics explanation, to distinguish it from other possibilities
involving recognition memory—is that, if recognition is more
accurate than knowledge, some ignorance (non-recognition) is needed so
that recognition can be applied to improve overall accuracy.
Figure 1 attempts to convey the accurate heuristics
explanation in a concrete way, considering the case where there are 10
alternatives, and so 10 2=45 comparisons. The left panel
shows how many of these 45 comparisons are made by guessing (when
neither alternative is recognized), by using the recognition heuristic
(when one alternative is recognized), and by using partial knowledge
(when both alternatives are recognized) as the number of recognized
alternatives increases from 0 to 10. When none of the alternatives are
recognized, every decision must be made by guessing. When all of the
alternatives are recognized, every decision must be made using partial
knowledge. Between these extremes, a number of decisions are made by
the recognition heuristic, with its use peaking when exactly half the
alternatives are recognized.
The right-hand panel of Figure 1 considers the number of
correct decisions. This depends on the total number of
decisions being made by guessing, recognition, and partial knowledge,
and by the accuracy of each of those methods. To demonstrate the
less-is-more effect in Figure 1, it is assumed that
recognition is 80% accurate, partial knowledge is 60% accurate, and
guessing is 50% accurate. The individual lines now show the number of
correct decisions, which is simply the total number of decisions made
by each method, scaled by the accuracy of each method. Thus, the
guessing line is exactly half as high in the right-hand panel compared
to the left hand panel. Because it is assumed recognition is more
accurate than partial knowledge, the inverse-U-shaped recognition line
is not shrunk to the same extent as the partial knowledge line. The
net result of these differences is seen in the total number of correct
decisions, shown by the bold line, which simply sums the number of
correct decisions across all three cases. This line is non-monotonic,
and peaks when 6 alternatives are recognized. This is the less-is-more
effect. Total accuracy is highest when some number of alternatives is
not recognized.
There is empirical evidence both for
(e.g., Frosch et al. [2007], Goldstein and Gigerenzer [2002], Reimer and Katsikopoulos [2004])
and against (e.g., Boyd [2001], Dougherty et al. [2008], Pohl [2006] the
less-is-more effect. A good review of the empirical evidence is
provided by Pachur [2010, see especially Table 1 and
Figure 2]. There is also some empirical evidence for
extensions of the less-is-more effect to choices that involve more
than two alternatives (Frosch et al. [2007]), and predictions of
less-is-more effects in collective group decision-making
(Reimer and Katsikopoulos [2004]). Theoretically, the less-is-more effect
has been integrated with cognitive models of recognition, within both
standard signal detection theory (Pleskac [2007]) and multinomial
processing tree (Erdfelder et al. [2011]) frameworks. The extended
theoretical assumption of imperfect recognition memory—which seems
very plausible in many experimental and real-world
situations—complicates the analysis of the less-is-more effect in
interesting ways, and basic properties of the accurate heuristics
explanation no longer hold (see Katsikopoulos [2010] pp. 250–255).
As Beaman et al. [2010] note, the less-is-more prediction is
“surprising”, and so provides a strong test of the theory from which
it is derived (Roberts and Pashler [2000]). This means, in turn, that
theoretical and empirical evidence for and against the less-is-more
effect is used rhetorically to support or attack the recognition
heuristic in particular, and fast and frugal heuristic approaches in
general. Of course, the recognition heuristic alone does not imply a
less-is-more effect, so failure to find the effect does not imply that
the heuristic is not used.
Against this background, the aim of this paper is to test the use of
the recognition heuristic, and the existence of the less-is-more
effect, based on new empirical evidence. The next section describes
experimental data designed to examine both questions in a direct way,
using a task in which participants judge which of two cities is larger
for cities in four different countries, and indicate whether or not
they recognize the cities. The data are then analyzed in two ways. The
first analysis is at a group level, testing whether the recognition
heuristic is followed, and how its accuracy compares to the decisions
based on partial knowledge. The second analysis is at an individual
level, examining how the accuracy of individual participants changes
as function of their different recognition rates. These two analyses
suggest different conclusions, but I reconcile them by examining
limitations in the assumption that the recognition heuristic provides
equally accurate decisions for all people.
2 Experiment
A total of 225 participants—all students in a large undergraduate
class at the University of California, Irvine—provided data from the
experiment. The experimental task presented participants with pairs of
cities, and required them to indicate which city they believed had the
larger population, and whether or not they recognized each city. The
task was repeated for each of four countries, and participants were
free to choose in which order they completed both the countries, and
the comparisons within the countries.
The countries were Germany, the United States, Italy, and the United
Kingdom. The cities were the 82 most populous from the set of German
cities reported by Gigerenzer and Goldstein [1996, Appendix], and the
74 United States cities, 48 most populous Italian cities, and 66
United Kingdom cities reported by Lee and Zhang [2012]. One fewer
German city and one fewer Italian city was used than was available in
the complete set, to give an even number, and enable unique
presentation of each city in paired comparisons.
The empirical data were collected over three years as part of a class
requirement. In each of the three years, 12 different versions of the
task were constructed—selecting different city pairs at random
subject to the constraint each city was presented exactly once—and
participants completed the version corresponding to their birth
month. If a participant did not complete any comparison within a
country, all of their data for that country were discarded. This was
done because a number of key measures, including a participant’s
recognition rate for a country, rely on complete data.
3 Results
I analyze the data to examine the less-is-more effect from two
different perspectives. First, I present a group-level analysis, which
produces results consistent with the effect. Then, I present an
individual-level analysis, which produces results inconsistent with
the effect. Consequently, I present an additional analysis that
attempts to reconcile the group-level and individual-level results.
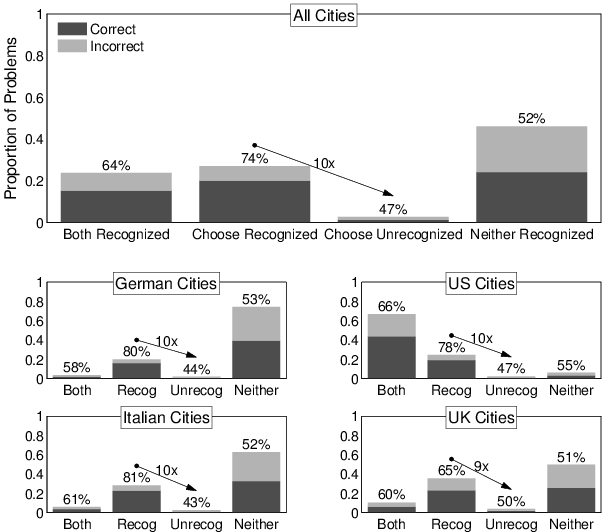
Figure 2: The main panel shows the number and accuracy of the four
possible classes of decisions in judging which of two cities has
the larger population. The problems are divided according to
whether both cities were recognized (“both recognized”), one
city was recognized and was chosen (“choose recognized”), one
city was recognized but the unrecognized one was chosen (“choose
unrecognized”), or neither city was recognized (“neither
recognized”). The overall height of each bar corresponds to the
proportion of all decisions that belonged to that class. The
darker and lighter areas within bars indicate how many of these
decisions were correct and incorrect, respectively. The label
above each bar gives the overall percentage of correct decisions
so that, for example, the accuracy of decisions when neither city
is recognized is close to 50% consistent with guessing. The arrow
indicates how many times more often the “chosen recognized”
rather than “chosen unrecognized” class occurred, and so
measures how many times more often decisions followed the
recognition heuristic. The four sub-panels show the same
information, for each country separately.
3.1 Group-level analysis
A group-level analysis is shown in Figure 2. The main panel
considers all of the answers given by all participants to all of the
comparisons for all countries. The four bars divide the city pairs
into those cases where both cities were recognized, where one city was
recognized and was chosen as the most populous, where one city was
recognized but the unrecognized city was chosen as the most populous,
and where neither city was recognized. Each bar is sub-divided into a
darker area representing correct choices, and a lighter area
representing incorrect choices. The accuracy rate is displayed as a
percentage above each bar. The four sub-panels in Figure 2
show exactly the same analysis for each country separately.
Figure 2 presents two important results. The first is that
when participants are able to apply the recognition heuristic,
they almost always do. The total height of the “choose
recognized” bar compared to the “choose unrecognized” bar measures
how often participants chose the recognized rather than unrecognized
city for those pairs where only one is recognized. The main panel
shows that the recognized city is 10 times more likely to be chosen
overall, and this result is consistently seen for the individual
countries. The second result is that the recognition heuristic
leads to more accurate decisions than ones based on partial
knowledge of the cities. The “both recognized” bar represents
those comparisons where both cities are recognized, and the accuracy
of these decisions is the accuracy based on partial knowledge. The
“choose recognized” bar represents comparisons where the choice made
is consistent with applying the recognition heuristic, and the
accuracy of these decisions is the accuracy of the heuristic. Overall,
the recognition heuristic is 74% accurate, compared to 64% when both
cities are recognized. The same superior accuracy for the recognition
heuristic is found in all four of the countries. It is a large
superiority of around 20% for the German and Italian cities, around
10% for United States cities, and around 5% for United Kingdom
cities.
The superior accuracy of decisions consistent with using the
recognition heuristic was found to apply not just in aggregate for
each country, but at the level of individual participants.1
Combining the decisions each participant made across all of the
countries, 96% were more accurate in making “choose recognized”
than “both recognized” decisions. Exactly the same result was found
when each country for each participant was considered separately,
under the restriction that at least 5 decisions were required to
estimate the accuracy rate as a proportion. Once again, 96% of these
individual participant-by-country sets of decisions showed greater
accuracy for “choose recognized” than “both recognized” decisions.
These results are highly consistent with the less-is-more effect, and
its theoretical underpinnings, at least under the assumption of
perfect recognition memory. The basic finding is that people make more
accurate decisions when they make a choice consistent with the
recognition heuristic than when they recognize both cities. It is also
clear, in the city domains considered, that people almost always make
choices consistent with the recognition heuristic when this is
possible. Thus, both the empirical finding of differences in accuracy,
and the proposed mechanism for this difference in terms of applying
the recognition heuristic, are found in the group-level analysis of
the data.
3.2 Individual-level analysis
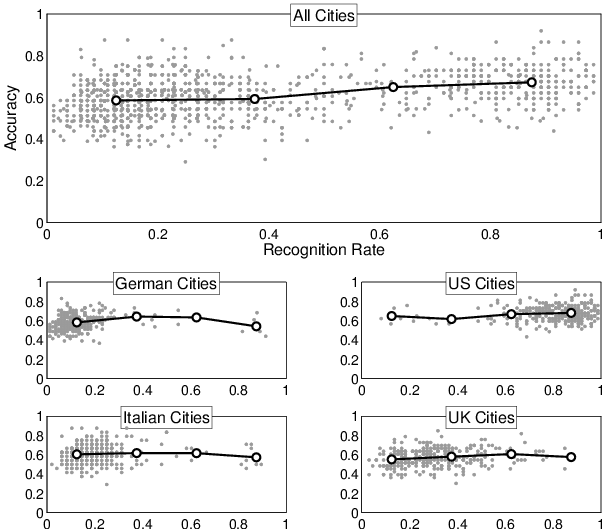
Figure 3: The main panel shows the number of cities recognized and
accuracy for each participant as a small circular marker. The
larger markers connected by the line show the trend in the
relationship between recognition and accuracy. The four panels
below show the same information for each country separately.
While the group-level analysis provides evidence for the use of the
recognition heuristic, and for its accuracy relative to the use of
knowledge, it does not take the same form as the standard presentation
of the less-is-more effect. The standard form closely follows the
right-hand panel of Figure 1, by relating the recognition
rates of people to their accuracies in making decisions. The
less-is-more effect, stated in these terms, implies that there are
people who recognize fewer cities but are more accurate than people
who recognize more cities. Goldstein and Gigerenzer [2002 Figure 2]
caricature the less-is-more effect in this way, by imagining younger,
middle, and older sisters who have low, medium, and high recognition
rates respectively, and making the prediction that the middle sister
will make the most accurate decisions.
Figure 3 presents this analysis for the current
data. The main panel considers every set of country questions
completed by individual participants, showing by circular markers the
accuracy and recognition rate of that participant. A trend line based
on binning is overlaid. The sub-panels repeat this analysis for each
of the countries separately, so that the main panel is simply the
superimposition of the four sub-panels. It is clear that there are
large individual differences in both recognition rates and accuracy,
as well as overall effects for the different countries, with United
States cities being more often recognized than for the other
countries. Despite this variation in both recognition and accuracy,
however, there is no evidence that accuracy changes as an
inverse-U-shaped function with recognition. The distribution of
accuracy over people—and the averages shown by the trend
lines—appears to be very similar at all levels of recognition,
perhaps with a slow linear increase in accuracy with recognition.
The Appendix presents a formal Bayesian statistical analysis that
bears out these conclusions. The key findings are based on Bayes
factors, which quantify the relative evidence data provide for two or
more alternative models (Kass and Raftery [1995]). The data provide at
least 15 times more support for a model that assumes a linear increase
in accuracy with recognition, when compared to a quadratic model that
makes inverse-U-shaped predictions consistent with the less-is-more
effect.2 The data also
provide overwhelmingly more support for the linear model than for
alternative models that that assume accuracy is constant, or that
accuracy is consistent with guessing. Thus, I conclude that there is
evidence for a linear relationship between accuracy and recognition,
rather than evidence for an inverse-U-shaped relationship. I note that
the failure to find an inverse-U-shaped curve relating accuracy to
recognition appears to be consistent with the majority of previous
data sets conveniently displayed in Pachur [2010, Figure 2].
3.3 Reconciling the group and individual analyses
One way to reconcile the group-level analysis (indirectly) in support
of the less-is-more effect with the individual-level analysis
(directly) failing to support the effect, is to consider a basic
assumption in the original uanalysis.
Goldstein and Gigerenzer [2002, p. 80] were clear that an assumption underlying
the prediction of the standard less-is-more effect is that “the
recognition validity alpha and the knowledge validity beta remain
constant as the number of cities recognized, varies.” A number of
authors have pointed out that his is a strong assumption that seems
unlikely to be met
(Beaman et al. [2010], Pachur [2010], Pachur and Biele [2007], Smithson [2010]). Figure 4
tests this assumption directly, by presenting an analysis of how the
accuracy of recognition, knowledge, and guessing decisions change as a
function of individual-level recognition. These curves were found by
considering all of the participants who, for a set of country
questions, had a recognition rate in a small range, and calculating
the proportion of correct decisions they made for comparisons where
they recognized one city (recognition), both cities (knowledge), or
neither city (guess).3 The relative number of
participants in each recognition range is shown by the histogram at
the bottom of Figure 4
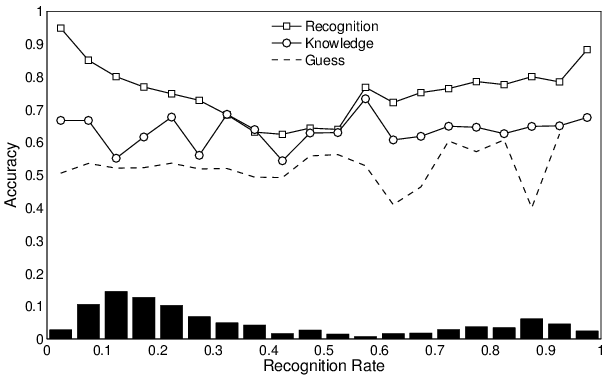
Figure 4: The pattern of change in the accuracy of recognition
(squares), knowledge (circles), and guessing (dashed line), in
choosing the larger city, for individuals with different
recognition rates. The bars show the distribution of individuals
over the recognition rates.
The accuracy of guessing is variably estimated for high levels of
recognition (because these participants have to guess relatively
rarely), but is consistent with an expected value around 0.5 across
the entire range of recognition. The statistical analyses presented in
the appendix find strong evidence that accuracy of guessing is
constant over changes in recognition rate, but is slightly higher than
the chance rate of one-half.
The accuracy of knowledge-based decisions is variably estimated for
low levels of recognition, but appears to be consistently around 0.6
and 0.7 across the entire range of recognition. The statistical
analyses presented in the appendix find that the data provide the most
evidence for accuracy being constant with respect to recognition rate,
although more complicated relationships, such as a gradual linear
increase, cannot be ruled out. If the constant relationship holds, it
would constitute an interesting finding, because it is not consistent
with the reasonable prediction that people who know more cities make
more accurate decisions choosing between those cities they know. A
previous finding is that people who know more items are more accurate
in choosing between those cities they recognize (Pachur [2010]),
which has a natural interpretation in terms of those people being
generally more intelligent, and so knowing more answers, or using
their partial knowledge better. The evidence for constancy of the
knowledge curve in Figure 4 is inconsistent with these
findings and interpretations.
Most importantly, however, Figure 4 clearly shows the accuracy
of recognition based decisions changes as a function of the underlying
recognition rate. At very high and very low levels of recognition,
accuracy is around or above 0.9. At intermediate levels of
recognition, accuracy is between about 0.6 and 0.7. The statistical
analyses presented in the appendix show that the data provide strong
evidence for this conclusion. In particular, Bayes factors provide
strong evidence for a quadratic, rather than linear or constant,
relationship between recognition-based decisions and the recognition
rate. This non-monotonic U-shaped change is a clear violation of the
assumption of constant accuracy. It is also inconsistent with previous
analyses that have focused on the possibility of a linear
relationship, and not considered non-monotonic relationships, by
relying on correlation coefficient measures of the association between
the accuracy of recognition-based decisions and recognition rates
(Pachur [2010]).
The U-shaped relationship is easily and intuitively interpreted. It
means that people who recognize very few cities in a country tend to
recognize the large cities, and so decisions consistent with the
recognition heuristic will tend to be very accurate. Similarly, people
who recognize almost all the cities in a country tend only not to
recognize a few of the smallest cities, and so the decisions they make
that are consistent with the recognition heuristic will also tend to
be very accurate. The dip in the accuracy of recognition decisions for
people with moderate recognition rates for a country means that, when
a person knows about half the cities, those cities recognized follow
the city populations less closely. These people do not simply
recognize the largest 50% of cities. Instead, recognition is more
loosely related to city population, and so decisions consistent with
the recognition heuristic will only sometimes be correct. In effect,
it is the exactness or looseness of the relationship between the
decision criterion and recognition that the accuracy of the
recognition heuristic measures.
The change in the accuracy of recognition decisions naturally
reconciles the contrasting results from the group-level and
individual-level analyses. Figure 4 shows that, overall,
recognition decisions are more accurate than those based on
knowledge. At worst, the accuracy of decisions consistent with the
recognition heuristic falls to the level the knowledge decisions show
throughout. Thus the overall difference in accuracy observed in the
group-level analysis makes sense. For the individual-level analysis,
however, Figure 4 shows that for recognition levels
corresponding to knowing very few or very many cities—those cases in
which recognition heuristic is applicable relatively less often—the
accuracy of decisions consistent with the recognition heuristic is
high. Thus, the decrease in accuracy for high and low recognition
rates, which generates the less-is-more effect in the standard
analysis presented in Figure 1, does not eventuate. Guessing
is equally accurate, and knowledge is equally accurate, but decisions
consistent with the recognition heuristic are less accurate for
recognition levels where it can often be applied, but more accurate
for recognition levels where is can be less often applied. The net
result of this relationship between frequency of use and accuracy of
use is that overall accuracy does not change as function of
recognition rate. A geometric intuition for this reconciling
explanation is that the U-shaped curve for the accuracy of recognition
decisions “undoes” the inverse-U-shaped curve predicted by the
less-is-more effect. The two nearly cancel each other to produce the
gentle linear relationship between accuracy and recognition rate
observed in Figure 3.
4 Discussion
The analyses and reconciliation presented here show that it is
important to be precise about what is meant by the less-is-more
effect. Goldstein and Gigerenzer [2002, p. 83] distinguished between
three different versions of the less-is-more effect, and these
versions have been influential in subsequent theorizing (e.g., Pachur
[2010], Smithson [2010]). Smithson [2010, p. 232] provides a concise
summary of the three versions: “One comparing more and less
knowledgeable agents, another comparing performance in different
domains, and a third comparing performance as an agent learns new
items.”
The first of these versions can be interpreted as claiming that
accuracy based on recognition is greater than accuracy based on
knowledge. This interpretation is consistent with the finding, for
example, that Londoners are more accurate than New Yorkers in choosing
Detroit as having a larger population than Milwaukee (see Gigerenzer
and Goldstein [2011], p. 101). The group-level analysis presented
here tests this version, since it examines average performance of a
group of people for questions where recognition can and cannot be
used. The results for these data, summarized in Figure 2,
are consistent with this version of the less-is-more effect, since
they show decisions consistent with the recognition heuristic to be
more accurate than those made in situations where the recognition
heuristic cannot be applied.
The second version of the less-is-more effect can be interpreted
(loosely) as claiming that individuals who recognize many items will
be more accurate than individuals who recognize a moderate
number. This interpretation is the one made by the standard account of
the effect, especially in the graphical form presented by Goldstein
and Gigerenzer [2002, Figure 2]. The individual-level analysis
presented here tests this version, since it examines the relationship
between levels of recognition and accuracy over individuals. The
results, summarized in Figure 3, are inconsistent with
this version of the less-is-more effect, since they do not show the
predicted non-monotonic inverse-U shape relationship.
The data presented here do not directly address the third version of
the less-is-more effect, involving changes in performance over
time. To test this version longitudinal data, tracking the accuracy of
people as they learn to recognize items over time, are required.
The reconciliation of the group-level and individual-level analyses
suggested here—hinging on the systematic and interpretable change in
the accuracy of the recognition heuristic over different levels of
individual recognition—is useful for a number of reasons
reasons. The reconciliation highlights the difference between the
first and second versions of the less-is-more effect. It is possible
for recognition-based to be more accurate than knowledge-based
decision-making overall, without implying that there are individuals
who use recognition more often who are more accurate than individuals
using knowledge. In fact, one way of summarizing the main result is
that three conditions are needed for the standard less-is-more effect,
without the complication of considering recognition memory. One
condition is that people must often follow the recognition heuristic
when it is possible to do so. The data provide compelling evidence
this condition is met. A second condition is that the accuracy of
decisions following the recognition heuristic must be greater than the
accuracy of decisions based on partial knowledge. The data also show
this condition being satisfied in each country domain considered, as
well as overall, and for the vast majority of individuals, both per
country, and over all countries. The third condition, however, is that
the accuracies of the recognition-based and knowledge-based decisions
must be constant with respect to the recognition rate. It is this
condition that is not satisfied by the data, and the violation
explains the lack of an individual-level less-is-more effect.
A more general contribution of examining the accuracy of
recognition-based, knowledge-based, and guessing-based decisions for
different levels of recognition is to provide empirical constraints to
guide theorizing and model development. The empirical regularities
evident in Figure 4 are non-trivial. The accuracy of decisions
made when both alternatives were recognized seems not to change with a
person’s level of recognition. Thus, it does not appear that people
who know more cities are more intelligent or knowledgeable, because
they are not able to make better decisions when they know both
cities. The implication for theories and models of individual
differences in the current task is that mechanisms such as memory
capacity or decision bias need to be carefully included, so that they
do not predict improved knowledge-based performance for people with
higher levels of recognition. Similarly, the accuracy of guessing
appears to be constant around one-half across all recognition
levels. This is intuitive, but it would also have been plausible to
expect, for example, an increase in guessing accuracy for people with
higher recognition levels, again on the grounds they are more
intelligent, and so more able to make educated guesses.
Most importantly, the relationship between the accuracy of
recognition-based decision-making and the level of recognition,
evident in Figure 4, provides a strong constraint on
theorizing. It is clear that the decisions made by following the
recognition heuristic are, at least in some situations, not equally
accurate for all levels of recognition. The possibility of
non-constancy was anticipated theoretically in general terms by a
number of authors (e.g., Goldstein and Gigerenzer [2002],
Katsikopoulos [2010], Pachur [2010], Smithson [2010]). Goldstein and
Gigerenzer [2002] conducted simulations to examine whether constancy
was a necessary condition for the less-is-more effect. Pachur [2010]
examined the possibility of non-constancy by measuring correlations in
existing data sets, and showed the consequences of these correlations
by simulation. The empirical regularities found in the data, however,
are different. In particular, they reveal a non-monotonic relationship
between recognition rate and the accuracy of recognition-based
decisions that cannot be expressed by linear correlations.
For these reasons, I think the analysis of how recognition-based
accuracy changes with recognition rate provides a new sort of
empirical evidence that should be an especially valuable guide for
model development. It is possible to give an interpretation of the
shape of the recognition accuracy curve in Figure 4, which
shows that very low and very high recognition levels permit the most
accurate use of recognition. One explanation for the increase in
recognition-based accuracy at low recognition rates is that people
learn about cities in a way that depends on their populations. Each of
the countries considered here has a small number of cities that are
much larger than the others, and if these are learned first, people
with very low recognition rates will be be very likely only recognize
these cities, making their use of the recognition heuristic very
accurate. This sort of interpretation relates to the sequences with
which people learn to recognize items over time. Such an explanation
is more difficult to apply to the increased accuracy of
recognition-based decision making for high recognition rates, since
there are many cities with similar small populations. Additional
empirical evidence would be useful for replicating the increase in
recognition-based accuracy for high levels of recognition that is
evident in the main panel of Figure 4.
A weakness of the current data is that they rely on the use of
different countries to ensure sufficient variation in individual
recognition rates to test the less-is-more effect. It is an
established experimental manipulation in the literature on the
less-is-more effect to change countries in order to induce changes in
recognition rates within individuals, as when US and German residents
are asked about both US and German cities (e.g., Goldstein and
Gigerenzer [2002]). Nonethelss, a narrow interpretation of the
preconditions for evaluating the less-is-more effect articulated by
(Gigerenzer and Goldstein [2011]) could challenge the current data,
claiming that the combination of countries means there is no unitary
“reference class” of items over which recognition and accuracy
measures are established. I think, however, that the current data do
usefully address the existence and nature of the less-is-more effect,
for two reasons. First, the failure to find the less-is-more effect in
the individual-level analysis—in the sense of a failure to find
decrease in accuracy for individuals with very high levels of
recognition—is almost entirely driven by the US country data. It is
clear from Figure 3 that most the the cases of
individuals with high recognition rates come from comparing US cities,
and that there is no systematic and discernible decrease in accuracy
for individuals with high recognition rates in these comparisons, as
required by a substantive interpretation of the less-is-more
effect. In this sense, the US country data provide evidence against
the less-is-more effect in a way that does meet reference class
preconditions. Secondly, and most generally, I think the reference
class conception does not need to be applied narrowly to test the
less-is-more effect in useful ways. All of the countries in the data
set have the key properties that recognition-based decisions are more
accurate than those based on partial knowledge, and that the decisions
people make are consistent with the recognition heuristic. These are
the key theoretical elements underpinning the standard accurate
heuristics exposition of the less-is-more effect. The data clearly
show, however, that accuracy does not decrease at high levels of
recognition, which is what a theoretically interesting and empirically
meaningful less-is-more effect predicts. My reconciling analysis
suggests this is because the accuracy of recognition-based decisions
is not constant, but varies in an interpretable way. Thus, I think the
data have both the properties needed to test the less-is-more effect,
and the richness to allow for an analysis that furthers our
theoretical understanding.
5 Conclusion
The recognition heuristic makes a compelling contribution to the
general case for fast and frugal heuristic accounts of human decision
making. It is simple and plausible, and presents a concrete way in
which a heuristic following an environmental regularity can generate
impressively accurate decisions. The data provide strong evidence for
people making decisions consistent with this heuristic. The
less-is-more effect is a surprising prediction derived from the
recognition heuristic by making some simple assumptions. The data,
suggest, however, that these assumptions are too simple. The accuracy
of the recognition heuristic, for the city domains considered, is not
constant over the level of recognition in the way required for the
standard account of the less-is-more effect to emerge. Instead, the
accuracy of the recognition heuristic varies in systematic and
interpretable ways.
Future work should focus on developing models of decision-making that
explicitly tackle the issues of how the environment supplies the
information that drives recognition and learning. To the extent that
the regularities evident in Figure 4 are replicable and
generalizable, models need to be consistent with the relationship
between the accuracy of recognition-based and knowledge-based
decisions and recognition rate. The challenge is to understand and
model how people encounter and recognize items in their environment,
and the consequences of these interactions and abilities for the
performance of recognition-sensitive decision heuristics.
References
Andersson, P. and Rakow, T. (2007).
Now you see it now you don't: The effectiveness of the recognition
heuristic for selecting stocks.
Judgment and Decision Making, 2(1):29--39.
[ bib ]
Beaman, C. P., Smith, P. T., Frosch, C. A., and McCloy, R. (2010).
Less-is-more effects without the recognition heuristic.
Judgment and Decision Making, 5:258--271.
[ bib ]
Borges, B., Goldstein, D. G., Ortmann, A., and Gigerenzer, G. (1999).
Can ignorance beat the stock market?
In Gigerenzer, G., Todd, P. M., and the ABC Research Group,
editors, Simple Heuristics That Make Us Smart, pages 59--72. Oxford
University Press, New York.
[ bib ]
Boyd, M. (2001).
On ignorance, intuition, and investing: A bear market test of the
recognition heuristic.
The Journal of Psychology and Financial Markets, 2:150--156.
[ bib ]
Bröder, A. and Eichler, A. (2006).
The use of recognition information and additional cues in inferences
from memory.
Acta Psychologica, 121:275--284.
[ bib ]
Brooks, S. P. and Gelman, A. (1997).
General methods for monitoring convergence of iterative simulations.
Journal of Computational and Graphical Statistics, 7:434--455.
[ bib ]
Dougherty, M. R., Franco-Watkins, A., and Thomas, R. P. (2008).
The psychological plausibility of fast and frugal heuristics.
Psychological Review, 115:199--211.
[ bib ]
Erdfelder, E., Küpper-Tetzel, C. E., and Mattern, S. D. (2011).
Threshold models of recognition and the recognition heuristic.
Judgment and Decision Making, 6:7--22.
[ bib ]
Frosch, C. A., Philip Beaman, C., and McCloy, R. (2007).
A little learning is a dangerous thing: An experimental demonstration
of ignorance-driven inference.
The Quarterly Journal of Experimental Psychology,
60:1329--1336.
[ bib ]
Gaissmaier, W. and Marewski, J. N. (2011).
Forecasting elections with mere recognition from small, lousy
samples: A comparison of collective recognition, wisdom of crowds, and
representative polls.
Judgment and Decision Making, 6:73--88.
[ bib ]
Gigerenzer, G. and Gaissmaier, W. (2011).
Heuristic decision making.
Annual Review of Psychology, 62:451--482.
[ bib |
DOI ]
Keywords: accuracy-effort trade-off, business decisions, ecological rationality,
legal decision making, medical decision making, social intelligence
Gigerenzer, G. and Goldstein, D. G. (1996).
Reasoning the fast and frugal way: Models of bounded rationality.
Psychological Review, 103(4):650--669.
[ bib ]
Gigerenzer, G. and Goldstein, D. G. (2011).
The recognition heuristic: A decade of research.
Judgment and Decision Making, 6:100--121.
[ bib ]
Gigerenzer, G., Todd, P. M., and the ABC Group (1999).
Simple Heuristics That Make Us Smart.
Oxford University Press, New York.
[ bib ]
Goldstein, D. G. and Gigerenzer, G. (2002).
Models of ecological rationality: The recognition heuristic.
Psychological Review, 109:75.
[ bib ]
Herzog, S. M. and Hertwig, R. (2011).
The wisdom of ignorant crowds: Predicting sport outcomes by mere
recognition.
Judgment and Decision Making, 6:58--72.
[ bib ]
Hilbig, B. E. (2014).
On the role of recognition in consumer choice: A model comparison.
Judgment and Decision Making, 9:51--57.
[ bib ]
Hoffrage, U. (2011).
Recognition judgments and the performance of the recognition
heuristic depend on the size of the reference class.
Judgment and Decision Making, 6:43--57.
[ bib ]
Kass, R. E. and Raftery, A. E. (1995).
Bayes factors.
Journal of the American Statistical Association, 90:377--395.
[ bib ]
Katsikopoulos, K. V. (2010).
The less-is-more effect: Predictions and tests.
Judgment and Decision Making, 5:244--257.
[ bib ]
Lee, M. D. and Wagenmakers, E.-J. (2013).
Bayesian Cognitive Modeling: A Practical Course.
Cambridge University Press.
[ bib ]
Lee, M. D. and Zhang, S. (2012).
Evaluating the process coherence of take-the-best in structured
environments.
Judgment and Decision Making, 7:360--372.
[ bib ]
Marewski, J. N., Pohl, R. F., and Vitouch, O. (2010).
Recognition-based judgments and decisions: Introduction to the
special issue (vol. 1).
Judgment and Decision Making, 5:207--215.
[ bib ]
Marewski, J. N., Pohl, R. F., and Vitouch, O. (2011a).
Recognition-based judgments and decisions: Introduction to the
special issue (II).
Judgment and Decision Making, 6:1--6.
[ bib ]
Marewski, J. N., Pohl, R. F., and Vitouch, O. (2011b).
Recognition-based judgments and decisions: What we have learned (so
far).
Judgment and Decision Making, 6:359--380.
[ bib ]
Marr, D. C. (1982).
Vision: A Computational Investigation into the Human
Representation and Processing of Visual Information.
W. H. Freeman, San Francisco, CA.
[ bib ]
Oeusoonthornwattana, O. and Shanks, D. R. (2010).
I like what I know: Is recognition a non-compensatory determiner of
consumer choice?
Judgment and Decision Making, 5:310--325.
[ bib ]
Oppenheimer, D. M. (2003).
Not so fast! (and not so frugal!): Rethinking the recognition
heuristic.
Cognition, 90:B1--B9.
[ bib ]
Pachur, T. (2010).
Recognition-based inference: When is less more in the real world?
Psychonomic Bulletin & Review, 17:589--598.
[ bib ]
Pachur, T. and Biele, G. (2007).
Forecasting from ignorance: The use and usefulness of recognition in
lay predictions of sports events.
Acta Psychologica, 125:99--116.
[ bib ]
Pleskac, T. J. (2007).
A signal detection analysis of the recognition heuristic.
Psychonomic Bulletin & Review, 14:379--391.
[ bib ]
Plummer, M. (2003).
JAGS: A program for analysis of Bayesian graphical models using
Gibbs sampling.
In Hornik, K., Leisch, F., and Zeileis, A., editors,
Proceedings of the 3rd International Workshop on Distributed Statistical
Computing. Vienna, Austria.
[ bib ]
Pohl, R. F. (2006).
Empirical tests of the recognition heuristic.
Journal of Behavioral Decision Making, 19:251--271.
[ bib ]
Reimer, T. and Katsikopoulos, K. V. (2004).
The use of recognition in group decision-making.
Cognitive Science, 28:1009--1029.
[ bib ]
Roberts, S. and Pashler, H. (2000).
How persuasive is a good fit? A comment on theory testing.
Psychological Review, 107:358--367.
[ bib ]
Scheibehenne, B. and Bröder, A. (2007).
Predicting Wimbledon 2005 tennis results by mere player name
recognition.
International Journal of Forecasting, 23:415--426.
[ bib ]
Serwe, S. and Frings, C. (2006).
Who will win Wimbledon? The recognition heuristic in predicting
sports events.
Journal of Behavioral Decision Making, 19:321--332.
[ bib ]
Smithson, M. (2010).
When less is more in the recognition heuristic.
Judgment and Decision Making, 5:230--243.
[ bib ]
Vanpaemel, W. and Lee, M. D. (2012).
Using priors to formalize theory: Optimal attention and the
Generalized Context Model.
Psychonomic Bulletin & Review, 19:1047--1056.
[ bib ]
Wetzels, R., Grasman, R. P. P. P., and Wagenmakers, E. (2010).
An encompassing prior generalization of the Savage-Dickey density
ratio test.
Computational Statistics and Data Analysis, 54:2094--2102.
[ bib ]
This appendix presents the details of the statistical inferences
reported in the main text. The first analyses test whether the
relationship between accuracy and recognition at the individual level,
as presented in Figure 3, follows the inverse-U-shape
predicted by the less-is-more effect. The second analyses test the
patterns of change in the accuracy recognition-based, knowledge-based,
and guessing-based decisions for different recognition rates, as
presented in Figure 4.
5.1 Individual-level Relationship Between Accuracy and Recognition
The relevant data are the counts of kia accurate
decisions out of nia questions, and kir
recognitions out of nir cities, made by the ith
individual. From these data, it is natural to consider underlying
accuracy θia and recognition θir
rates, defined as
kia∼Binomial(θia,nia)
and
kir∼Binomial(θir,nir).
I consider four interesting statistical models of the relationship
between θia and θir, corresponding
to different psychological interpretations of the relationship between
accuracy and recognition rate. The first model simply assumes people
guess all their answers, independent of their recognition
rates. The second assumes that people have some constant rate
of accuracy, independent of their recognition rates. The third assumes
a linear relationship, so that accuracy increases or decreases with
recognition rate. The fourth assumes a inverse-U-shaped relationship,
in the form of a quadratic with a negative quadratic
coefficient, as predicted by the less-is-more effect.
I formalize these models—which in a Bayesian analysis requires formalizing both the likelihood function and priors on parameters, since both express theoretical assumptions (Vanpaemel and Lee [2012])—as
The priors were chosen by inspecting prior predictive distributions, and choosing combinations that corresponded to reasonable expressions of the different alternative relationships between recognition and accuracy being tested. In particular, the quadratic coefficient was constrained to be negative, corresponding to the prediction of the less-is-more effect of an inverse-U-shaped function.
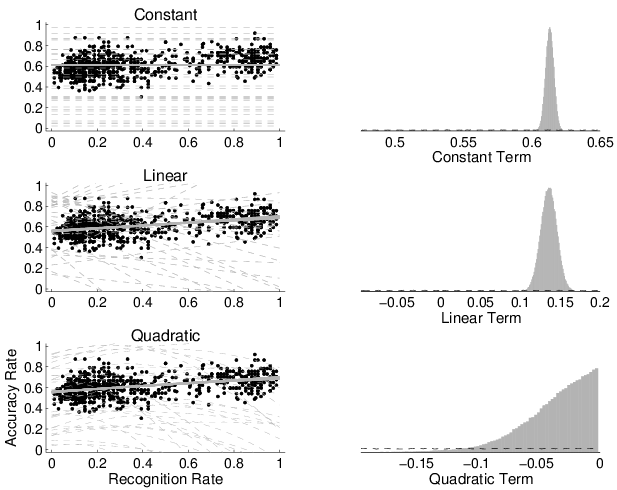
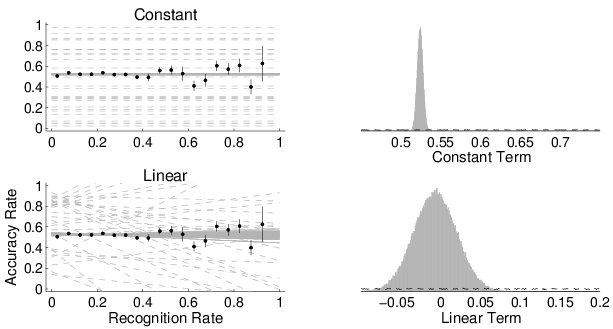
Figure 5: The left-hand panels show the prior predictive (broken lines) and posterior predictive (solid lines) distributions for the constant (top), linear (middle), and quadratic (bottom) models of the relationship between accuracy and recognition rate. The right-hand panels show the prior (broken line) and posterior (solid histogram) distribution for the parameters corresponding to the constant (top), linear (middle), and quadratic (bottom) terms that allow for the estimation of Bayes factors between the models using the Savage-Dickey density ratio method.
All four of these models were implemented as graphical models in JAGS
(Plummer [2003]), which allows for Bayesian inference using
computational sampling methods (see Lee and Wagenmakers [2013] for an introduction to Bayesian graphical models aimed at the cognitive sciences), and applied to the data shown in Figure 3. The results are based on 3 chains of 50,000 posterior samples collected after 1000 discarded “burn in” samples for all 4 models, with the standard R statistic used to check the convergence of the chains (Brooks and Gelman [1997]).
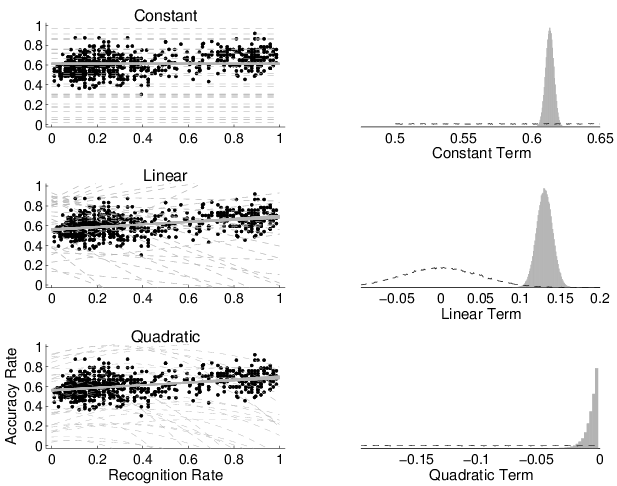
Figure 6: The left-hand panels show the prior predictive (broken lines) and posterior predictive (solid lines) distributions for the modified constant (top), linear (middle), and quadratic (bottom) models of the relationship between accuracy and recognition rate. The right-hand panels show the prior (broken line) and posterior (solid histogram) distribution for the parameters corresponding to these modified constant (top), linear (middle), and quadratic (bottom) terms that allow for the estimation of Bayes factors between the models using the Savage-Dickey density ratio method.
The results of this analysis are shown in Figure 5. The left-hand panels show the data, in the form of proportions of recognized cities and accurate decisions for each individual, as in Figure 3. The solid overlaid lines show the posterior distribution of the constant, linear, and quadratic models. The broken lines show samples from the prior predictive distribution of each model.
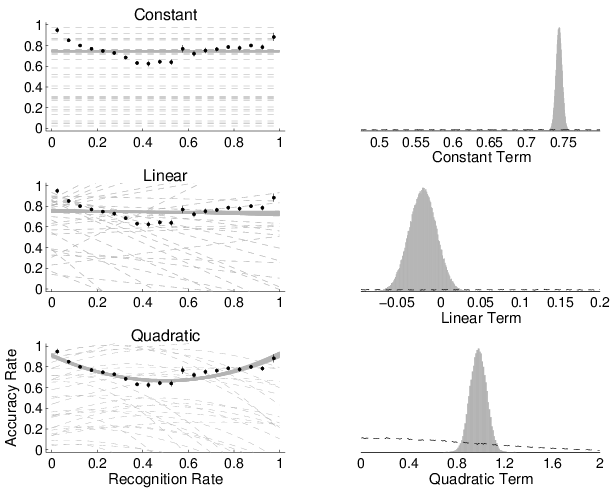
Figure 7: The left-hand panels show the prior predictive (broken lines) and posterior predictive (solid lines) distributions for the constant (top), linear (middle), and quadratic (bottom) models of the relationship between the accuracy of recognition-based decisions and recognition rate. The right-hand panels show the prior (broken line) and posterior (solid histogram) distribution for the parameters corresponding to these constant (top), linear (middle), and quadratic (bottom) terms that allow for the estimation of Bayes factors between the models using the Savage-Dickey density ratio method. The error bars in the left-hand panels show one standard error for the binomial proportions.
The histograms in the right-hand panels show the posterior distributions over the key coefficient parameters in each of the models. These are the c1 constant term in the constant model, the b2 slope term in the linear model, and the a3 quadratic term in the quadratic model. The broken lines show the prior distributions for these coefficients. A standard Bayesian method, known as the Savage-Dickey method, for finding Bayes factors between nested models involves the ratio of prior to posterior densities at critical values of the parameter that reduces the more complicated model to its nested special case (Lee and Wagenmakers [2013], Wetzels et al. [2010]). Thus, for example, the Bayes factor for comparing the constant model to the guessing model is the ratio of the prior to posterior density of the coefficient c1 at the value c1=1/2.
Using this method, and approximating the posterior densities with Normal distributions, the log Bayes factors were estimated to be greater than 50 in favor of the constant model over the guessing model, and for the linear model over the constant model. This is overwhelming evidence. The crucial log Bayes factor between the linear and quadratic models was estimated to be 2.75, which means the data provide about 15 times more evidence for the linear than the quadratic model. I interpret this as moderately strong evidence.
An anonymous reviewer suggested that an additional analysis should be done, using a quadratic model that more closely reflected the predictions of the less-is-more effect and, in particular, predicted the peak in the curve to be at very high values of the recognition rate near 90%. To implement this suggestion, I conducted a second version of the analysis, using more informative priors on the parameters for the constant, linear, and quadratic models. The intention was that these priors would capture additional theory that—while not formally stated in the literature—could reasonably be inferred from interpreting the theory underlying the less-is-more effect and findings from previous relevant data. This additional theory serves to simplify the models, make their predictions more precise, and allow the data to provide potentially more decisive evidence for-and-against the models (Vanpaemel and Lee [2012]).
Once again, the exact prior distributions were largely determined by inspecting prior predictive distributions. For the quadratic model, standard results from the quadratic formula were also applied so that he peak would be near 90% recognition. These considerations resulted in the new models4H^c^′: θ^a_i = c^′_1, c^′_1 ∼U(0.5,0.75), H^l^′ : θ^a_i =
b^′_2θ^r_i + c^′_2, b^′_2∼N(0,1/0.05^2),
c^′_2∼U(0.5,0.75), H^q^′ : θ^a_i =
a^′_3(θ^r_i)^2+b^′_3θ^r_i
+ c^′_3, a^′_3∼U(-0.3,0),
b^′_3∼N(-1.8a^′_3,1/0.05^2),
c^′_3∼U(0.5,0.75).
The results of this analysis are shown in Figure 6. The left-hand panels again show the data, the solid overlaid lines show the posterior distribution of the constant, linear, and quadratic models, and the broken lines show samples from the prior predictive distribution of each model. The histograms in right-hand panels show the posterior distributions over the key coefficients in each of the models, allowing the estimation of Bayes factors.
The log Bayes factors for these modified models were estimated to be greater than 50 in favor of the modified constant model over the guessing model, and for the linear model over the constant model. This is overwhelming evidence. The log Bayes factor between the modified linear and modified quadratic models was estimated to be 4.72, which means the data provide about 100 times more evidence for the modified linear than the modified quadratic model. I interpret this as strong evidence. In short, the modified models using prior distributions that made stronger theoretical assumptions, especially about the nature of the less-is-more effect, led to the same conclusions as the original analysis.
Intuitively, these analyses provide evidence that the relationship between accuracy and recognition rate is well captured by a gently increasing linear relationship, and that there is no evidence for the non-monotonicity of accuracy via a decrease at high levels of recognition, even when considering a quadratic model specifically designed to predict such a decrease.
5.2 Changes in Accuracy with Recognition
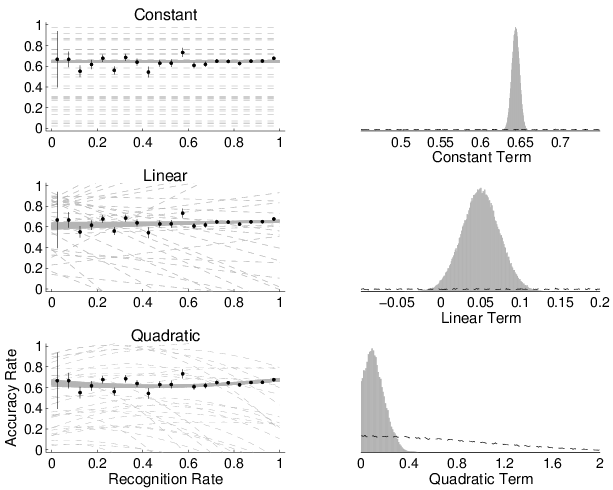
Figure 8: The left-hand panels show the prior predictive (broken lines) and posterior predictive (solid lines) distributions for the constant (top), linear (middle), and quadratic (bottom) models of the relationship between the accuracy of knowledge-based decisions and recognition rate. The right-hand panels show the prior (broken line) and posterior (solid histogram) distribution for the parameters corresponding to these constant (top), linear (middle), and quadratic (bottom) terms that allow for the estimation of Bayes factors between the models using the Savage-Dickey density ratio method. The error bars in the left-hand panels show one standard error for the binomial proportions.
Figure 4 shows the accuracy recognition-based, knowledge-based, and guessing-based decisions, as a function of (binned) recognition rates. I examine whether these data provide evidence for guessing, constant, linear, or quadratic relationships using essentially the same methodology used to examine the relationship between individual-level accuracy and recognition. The same Hg, Hc, and Hl models were used, but the Hq model was modified to test U-shaped, rather than inverse-U shaped quadratics, in order to test for the apparent increase in accuracy with high and low recognition rates for recognition-based decisions. This change in the model was achieved simply by truncating to positive values of the quadratic coefficient, so that a3∼TN+(0,1).
Figure 9: The left-hand panels show the prior predictive (broken lines) and posterior predictive (solid lines) distributions for the constant (top) and linear (bottom) models of the relationship between the accuracy of guessing-based decisions and recognition rate. The right-hand panels show the prior (broken line) and posterior (solid histogram) distribution for the parameters corresponding to these constant (top) and linear (bottom) terms that allow for the estimation of Bayes factors between the models using the Savage-Dickey density ratio method. The error bars in the left-hand panels show one standard error for the binomial proportions.
The results for this analysis for decisions consistent with recognition are shown in Figure 7. The log Bayes factors for the constant over the guessing model, and for the quadratic over all of the other three models, are all greater than 50. The log Bayes factor for the constant over the linear model is 3.22. More importantly, though, the data provide evidence for an above-guessing constant accuracy rather than a linear relationship between accuracy and recognition, if only constant or monotonic relationships are considered. They, however, provide overwhelming evidence for a non-monotonic quadratic model over the monotonic alternatives. Intuitively, the posterior distributions in Figure 7 show that it is not definitively clear that the linear coefficient is not 0, but it is clear the quadratic term is not. I conclude that the data provide evidence for a non-monotonic relationship between the accuracy of recognition-based decisions and recognition rate, with greater accuracy at high and low levels of recognition.
The results for knowledge-based decisions are shown in Figure 8. The log Bayes factor for the constant over the guessing model is greater than 50. The log Bayes factors for the constant over the linear and quadratic model are 1.45 and 1.31, respective. Thus, the data provide evidence for the constant model. This evidence is overwhelming when considering the guessing model as an alternative, but weak in relation to the linear and quadratic models. My conclusion is that the constant model is favored by the current data, but the possibility of linear or more complicated relationships remains, and additional evidence—most obviously in the form of additional data—would be valuable.
The results for guessing-based decisions are shown in Figure 9. The log Bayes factor for the constant over the guessing model is again greater than 50, but the log Bayes factor favoring the constant over the linear model is about 3.6. This means the data provide about 30 times more evidence for a constant rather than linear relationship. Because of the strength of this evidence, there is no need to report the results for the quadratic model. Overall, I interpret the results as showing that the accuracy of guessing-based decisions is constant over recognition rate, but a little higher than the chance accuracy of one-half.
The appendix presents two analyses that support this
conclusion. One is based on relatively general specifications of the
alternative relationships being considered between recognition and
accuracy. The other analysis is based on stronger assumptions about
the alternative relationships, including predictions about the size
and nature of the less-is-more effect more tightly matched to the
underlying theory and previous empirical findings.
Note that I parameterize Normal distributions in terms of means and precisions, to be consistent with their implementation in JAGS, so that, for example, N(0,1/0.052) is a Normal distribution with a mean of zero and standard deviation of 0.05.