This paper explored how frames influence people’s evaluation of others’
probabilistic predictions in light of the outcomes of binary events.
Most probabilistic predictions (e.g., “there is a 75% chance that
Denver will win the Super Bowl”) can be partitioned into two
components: A qualitative component that describes the predicted
outcome (“Denver will win the Super Bowl”), and a quantitative
component that represents the chance of the outcome occurring
(“75% chance”). Various logically equivalent variations of a
single prediction can be created through different combinations of
these components and their logical or numerical complements (e.g.,
“25% chance that Denver will lose the Super Bowl”, “75% chance
that Seattle will lose the Super Bowl”). Based on the outcome of
the predicted event, these logically equivalent predictions can be
categorized into two classes: Congruently framed predictions, in
which the qualitative component matches the outcome, and
incongruently framed predictions, in which it does not. Although
the two classes of predictions are logically equivalent, we
hypothesize that people would judge congruently framed predictions
to be more accurate. The paper tested this hypothesis in seven experiments
and found supporting evidence across a number of domains and
experimental manipulations, and even when the congruently framed
prediction was logically inferior. It also found that this effect
held even for subjects who saw both congruently framed and
incongruently framed versions of a prediction and judged the two to
be logically equivalent.
Probabilistic predictions about events with binary outcomes are
frequently encountered in everyday life. For example, weather
forecasts are often made in probabilistic terms (e.g., “chance of
rain is 80%”). When the outcomes of these probabilistic events are
known, we can assess the accuracy of the predictions by comparing
these predictions against the actual outcomes. To be able to properly
evaluate other people’s predictions is important because it would then
allow us to learn how good the predictors are in making predictions,
to judge whether or to what degree should we trust future predictions,
and to make decisions accordingly, etc.
In the present research, I focus on one particular aspect of
prediction evaluation—how the framing of predictions affects
people’s evaluations. Framing effect refers to a phenomenon in which
description invariance is violated (Tversky & Kahneman, 1981).
According to the principle of description invariance, different
representations of the same judgment problem should yield the same
output, in terms of judgments or decisions. However, much prior
research has found that judgments, decisions, and actions are often
influenced by frames—the presentation of information and its context
(for example, see, Tversky & Kahneman, 1981; Levin, Schneider, &
Gaeth, 1998; Kühberger, 1998). In this paper I demonstrate a
novel framing effect in how people evaluate probabilistic predictions
about events with binary outcomes. While the evaluation of
predictions has been studied extensively, these studies have been
mainly concerned with using formal methods to evaluate
predictions. Instead, here I focus on how laypeople evaluate
predictions.
Although there have been studies of framing effects on probabilities
and predictions (e.g., Kuhn, 1997; Mandel, 2005; Mandel, 2008), to my
knowledge evaluation of predictions about binary-outcome events have
not been investigated from the perspective of framing (but see Teigen
& Nikolaisen, 2009, for a study on how people evaluate predictions
that over- or under-shoot the outcome).
In the following sections I will first detail the background of and
my hypothesis about a novel framing effect. I will then present the
experiments that explore the effect and examine the conditions under
which it occurs. Finally I will discuss the implications of the
findings, the limitations of the current study, and some future
directions.
2 Background
In decision theory, scoring rules are used to assess the accuracy of
probabilistic predictions (Brier, 1950; Murphy & Winkler, 1977;
Savage, 1971). While scoring rules are intended to be objective
standards by which predictions can be evaluated and compared, the
question of whether people, especially laypeople, would evaluate
predictions based on similar standards is less well understood.
Much evidence suggests that how people evaluate predictions, and
decisions in general, is influenced by contextual factors. One of the
most well-known of these findings, the risky choice framing effect,
induces a choice reversal effect between two logically equivalent
gambles (Tversky & Kahneman, 1981). For example, in the Asian
disease problem, people were risk-averse when the problem was
presented in a gain frame (“200 people will be saved” is preferred
to “there is 1/3 probability that 600 people will be saved, and 2/3
probability that no people will be saved”), whereas they were
risk-seeking when the problem was presented in a loss frame (“there
is 1/3 probability that nobody will die, and 2/3 probability that 600
people will die” is preferred to “400 people will die”). A number
of other contextual factors have also been found to produce other
kinds of framing effects (Levin & Gaeth, 1988; Meyerowitz & Chaiken,
1987). More recent research has suggested that framing effects can in
turn be moderated by a number of factors. For example, ambiguities in
the descriptions, and whether the valence of the predictions are
congruent with those of the outcomes (e.g., “will be saved” vs.
“will die”), have been found to moderate the risky choice framing
effect (Mandel, 2001; Mandel, 2008).
The valence, or directionality, of events has been shown to be one
important factor influencing framing effects. Verbal probability
expressions of opposite valence were shown to induce different
judgments even when these expressions were judged to be equivalent in
terms of their numerical probabilities (Teigen & Brun, 1999). More
generally, the valence of events has been shown to change people’s
estimates of the probability of those events (Mandel, 2005).
These results suggest that the framing of predictions, and especially
the directionality of these predictions, might also influence how
people evaluate the accuracy of predictions in light of the outcomes.
One theory that provides suggestions on how people evaluate
predictions is the fuzzy-trace theory (Reyna & Brainerd, 1991).
Fuzzy-trace theory was originally proposed to explain the risky choice
framing effect. According to it, this effect is a result of people
using gist information instead of verbatim information. It also
states that people have a preference for fuzzy processing at the
crudest possible level necessary to distinguish different choices. In
the context of the risky choice framing effect, people distinguish
between options using the contrasts among the gist representations,
some, all, and none, instead of more precise
numeric probability values. Take the Asian disease problem as an
example. In the gain frame, the verbatim representations of the two
options “200 will be saved” versus “a 1/3 probability that 600 will
be saved” are represented by people based on the gist information
instead, and become “some people will be saved” versus “some chance
that some people will be saved”. As a result, people favor the sure
option. Similarly, in the loss frame, the choices of “400 will die”
versus “a 2/3 probability that 600 will die” become “some people
will die” versus “some chance that some people will die”, and
consequently, people prefer the risky option. This explanation of the
framing effect received support from a series of research studies
(Kühberger & Tanner, 2010; Reyna & Brainerd, 1991; Reyna &
Brainerd, 1995).
If we apply the fuzzy-trace theory to the evaluation of predictions,
then we can construct a hypothesis about how frames might influence
people’s judgments of prediction accuracy concerning binary events.
We will use a prediction about Super Bowl 2014 as an example. This
particular American football game was between two teams, the Denver
Broncos and the Seattle Seahawks, and could not result in a tie—one
of the teams must win the game and the other must lose. Let’s say
there are two logically equivalent predictions: “there is an 80%
chance that the Denver Broncos will win” and “there is a 20% chance
that the Denver Broncos will lose”. While these two predictions are
logically equivalent, according to fuzzy-trace theory people might
evaluate the predictions by relying on the gist information. As a
result, the predictions would be translated as “there is some
probability that the Denver Broncos will win” and “there is some
probability that the Denver Broncos will lose”, respectively. Since
Denver eventually did lose the game, if people evaluate predictions
based on these gist representations, then it seems likely that they
may rate the first prediction to be less accurate than the second one.
To facilitate exposition, I will call the outcome described in the
prediction (e.g., “the Denver Broncos will win”) the
qualitative component, and the predictor’s judgement about how
likely a particular outcome is to occur (e.g., “80% chance”) the
quantitative component. In more general terms, the above
analysis suggests that when people evaluate the accuracy of
predictions, they might rely more on whether the qualitative
components matches the outcome, than on the magnitude of the
quantitative component. I will refer to predictions in which the
qualitative component is logically equivalent with the outcome as
predictions in a congruent frame. In contrast, predictions in
which the qualitative component is not logically equivalent with the
outcome are referred to as predictions in an incongruent frame.
For example, a prediction of “it will rain” is congruent with an
outcome of “rain” while a prediction of “it will not rain” is not
congruent. Note that the quantitative component of the prediction
does not factor into the determination of congruency. Moreover, while
there are similarities between valence and congruency, valence mainly
concerns whether a description is positive or negative in absolute
terms, whereas congruency involves the matching between the prediction
and the outcome.
A group of statements is logically equivalent if each member statement
of the group necessarily entails any other member statements (e.g.,
Sher & McKenzie, 2006). Therefore, a prediction can be stated in
several different ways without changing its meaning. Going back to
the Super Bowl example, if the outcome is (counterfactually) a Denver
win (or equivalently, a Seattle loss), then predictions of “Denver
will win”, “Seattle will lose”, “Denver will not lose”, and
“Seattle will not win” are all congruent with the outcome, whereas
predictions such as “Denver will lose”, “Seattle will not lose”,
etc., are incongruent with the outcome. Therefore I hypothesize that
among a set of logically equivalent predictions, predictions that are
congruent with the outcome would be judged to be more accurate than
predictions that are incongruent. To differentiate this from
previously reported types of framing effects, I will call this
hypothesized phenomenon the prediction-assessment congruency
effect (or congruency effect for short).
As probabilistic predictions can take on a wide variety of forms, we
will focus on predictions under the following conditions: a)
the predictions are about an event with exactly two possible outcomes
(e.g., coin flips, sports games with no ties); b) the
predictions are each stated with a quantitative component, or
subjective probability (e.g., “80%”); c) the qualitative
components of the predictions involves one or two
subcomponents. Since the meanings of the conditions a
and b are relatively straightforward, we can move on to a
discussion about condition c.
Many predictions involve drawing a link between two concepts in the
outcome. In this paper I focus on predictions in which an agent—an
individual or a group—is associated with a particular result. A
common example of this kind of prediction is the win/loss outcome of a
sports game. In many sports, a game involves two agents (two opposing
players or two opposing teams) and at the end of the game, each of the
agents will be associated mutually exclusively with an outcome (a win
or a loss). I will call predictions of this type as predictions with
two qualitative subcomponents (the agent subcomponent and the outcome
subcomponent).1
Predictions about the outcome of the game such as “there is an 80%
chance that the Denver Broncos will win the Super Bowl” involve two
qualitative subcomponents—the agent (“Denver Broncos”) and the
outcome (“winning the Super Bowl”)—and one quantitative component
(“80%”). Because all predictions studied in this paper contain
exactly one quantitative component, the number of qualitative
subcomponents will be used to characterize predictions (i.e.,
“one-subcomponent prediction” or “two-subcomponent prediction”).
The above prediction about Super Bowl 2014 is therefore categorized as
a two-subcomponent prediction. In a sports game, each team can be
predicted either to win or to lose. In these predictions, one of the
outcomes is matched to one of the agents, and this entails the other
outcome to be matched to the other agent. In the Super Bowl example,
because one of the teams must win, predicting that Denver will win is
logically equivalent to predicting that Seattle will lose. It also
can be seen that given a binary prediction, all logically equivalent
predictions are either congruent or incongruent, regardless of the
outcome.
Moreover, we can create logically equivalent variations of any
specific prediction, by exchanging (sub-)components of this
prediction with the logical complements of its qualitative
subcomponents and/or the numerical complement of its quantitative
component. For example, in the Super Bowl example, the prediction
“there is an 80% chance that the Denver Broncos will win the Super
Bowl” can be restated equivalently as “there is a 20% chance that
the Denver Broncos will lose the Super Bowl”. Because both the
qualitative subcomponents and the quantitative component of these
predictions can be considered as binary-valued,2 replacing any two
(sub-)components with their logical or numerical complements
would create a new but logically equivalent prediction, as the example
shows. Consequently, many logically equivalent predictions can be
made about a specific event.
I now examine the case for one-subcomponent predictions, which have
only one qualitative subcomponent (in addition to the quantitative
component). In contrast to two-subcomponent predictions,
one-subcomponent predictions involve an indivisible outcome. For
example, in the prediction “there is an 80% chance that it will rain
tomorrow”, the qualitative component of the prediction is “it will
rain tomorrow”. This event is indivisible because the subcomponent is
a meaningful outcome in and of itself (in contrast, one cannot predict
“will win” without specifying an agent). Other predictions of this
type include “there will be a depression next year”, “the world is
ending”, etc. While logically equivalent predictions can also be
created from one-subcomponent predictions, the number of possible
variations is more limited compared to two-subcomponent predictions.
One of the ways to empirically test whether framing influences
assessment of prediction accuracy is to elicit accuracy judgments for
a group of logically equivalent predictions with different frames, and
to examine whether these judgments indeed do differ. The hypothesized
framing effect is supported if accuracy assessments of logically
equivalent predictions systematically differ along lines of the
congruency of these predictions.
To determine whether a group of predictions are logically equivalent
(especially for predictions involving different quantitative
components), I evaluate each prediction based on their Brier score.
The Brier score, a commonly used measure of prediction accuracy, is
defined as the mean squared difference between the probability
assigned to the predicted outcome and the actual outcome defined as 1
or 0 (Brier, 1950). As I investigate only one-shot predictions in
the present research, the Brier score simplifies to:
BS=
⎧
⎪
⎨
⎪
⎩
(1−p)2
: if the qualitative component
is correct
p2
: if the qualitative component
is incorrect
where p represents the quantitative component of the predictions.
The value of a Brier Score is between 0 (best) to 1 (worst) that
rewards predictions that are correct, and penalizes predictions that
are incorrect. It also rewards strong beliefs (probabilities closer to
1 or 0) more when they are correct, and penalizes them more when they
are incorrect. For example, let’s say someone made a prediction
“there is an 80% chance that the Denver Broncos will win the Super
Bowl”. Since Denver lost the Super Bowl, the Brier score for this
prediction is 0.82, or 0.64. Had Denver won, the Brier score
would have been 0.22, or 0.04. Here it can be seen that both the
qualitative and quantitative components of the prediction contributed
uniquely to the Brier score. While the Brier score is usually used to
evaluate the accuracy of predictions, in this paper the main focus is
on how laymen evaluate accuracy of predictions. Therefore the Brier
score is merely used to set up logical equivalence for predictions
with different frames.
If people do evaluate predictions in ways consistent with the
formulation of the Brier score, then given a specific outcome,
logically equivalent predictions stated in different frames should be
given similar evaluations concerning their accuracy. However, as
discussed earlier, I hypothesize that people will judge predictions
that are congruent with the outcome to be more accurate. I note
that, however, as human reasoning is exceedingly complex, this
hypothesis in no way represents the entirety of how people process
such judgments. In particular, the quantitative component is likely
to be used in some capacity not described here. However, I argue
that this characterization captures an important aspect of evaluations
of probabilistic predictions, and is particularly important because it
deviates from the principle represented by many scoring rules that
measure the accuracy of probabilistic predictions, including the Brier
score. Here I focus on comparisons between predictions that are
logically equivalent (or close to it), as determined by having the same
(or similar) Brier scores. Evaluations of non-logically equivalent
prediction pairs (those with meaningfully different Brier scores) are
not investigated.
In this paper
I report seven experiments that were carried out to investigate
whether people do indeed consider congruent predictions to be more
accurate than logically equivalent incongruent predictions.
3 Experiments 1A and 1B
Experiments 1A and 1B were designed to provide initial evidence of the
congruency effect—whether a congruent prediction would be rated as
more accurate than an incongruent one.
3.1 Methods (Experiment 1A)
I recruited subjects for Experiment 1A using Amazon Mechanical Turk
(MTurk). Only workers who were residing in the United States, were at
least 18 years old, and had a lifetime acceptance rate with MTurk of
95% or over were allowed to participate (the same requirements
applied to all MTurk experiments in this paper). Previous research
has found that MTurk workers are likely to participate across multiple
related experiments (Chandler, Mueller, & Paolacci, 2013). Not only
might this weaken the representativeness of the sample, but subjects
who have participated in multiple experiments might also become aware
of the true intentions of the experiments. Therefore, I disallowed
subjects from participating in more than one experiment in this paper
by checking their MTurk ID before their participation. Over the six
MTurk experiments presented here, there was a total of 633 unique
MTurk workers.3
In order to detect subjects who might have been inattentive during the
experiment, an attention check was employed after the subjects had
given their consent to the experiment. This procedure was designed to
identify whether or not participants had read the entirety of the
instructions, thus providing an indirect measure of whether the
subjects had been inattentive during the experiment (Oppenheimer,
Meyvis, & Davidenko, 2009).
The actual content of the experiment took place after the attention
check. The experiment focused on two-subcomponent predictions, and
employed a 2 × 2 (congruency × outcome frame)
between-subjects design. The hypothesized difference between the two
congruency conditions—predictions in congruent or incongruent
frames—was the main focus of this experiment. Additionally, I set
up two counter-balanced outcome-frame conditions to control for how
the outcome was stated, as it is possible that this might moderate
people’s judgments.
Previous research has found that desirability of outcomes (e.g.,
“will be saved” vs. “will die”) could moderate people’s evaluation
of prediction (Teigen & Nikolaisen, 2009). This potential issue was
avoided (in all experiments in this paper) by using
artificial cover stories in which the subjects should not have a
preference towards either one of the two possible outcomes.
The stimuli in this particular experiment used the cover story of a
college football game in the United States. Ties are extremely rare in
American football and therefore it satisfies the two-outcome
condition. The instructions were as follows. In the stimuli, double
brackets ([[ and ]]) demarcate the wordings that were
different between conditions and vertical lines (|||) separate
the conditions, which are named inside the parentheses.
Imagine that you have just arrived a little early for a new class on
the first day of the semester. Another student was already
there. The two of you started talking and the conversation turned to
an upcoming college football game between universities A and B. The
other student predicted that [[ (Prediction frame: Congruent)
University B has a 30% ||| (Prediction frame: Incongruent)
University A has a 70% ]] chance of winning.
The game took place later that week and [[ (Outcome frame: A)
University A lost to University B ||| (Outcome frame: B)
University B defeated University A ]].
Following this vignette, the subjects were asked to give a judgment
about whether the prediction was wrong (“Was the prediction made by
the other student wrong?”) using choices of either “Yes, the
prediction was wrong” or “No, the prediction wasn’t wrong”. They
were then asked, “How accurate was the prediction?” This question
used a 9-point scale with levels from “Extremely Inaccurate” to
“Extremely Accurate”. Finally, the subjects answered a short
demographics survey, including one question about the level of their
football knowledge.
3.2 Results (Experiment 1A)
There was a total of 112 subjects (41.1% female), after discarding
data from eight individuals (6.7%) for failing the attention
check. Average age was 28.62 (s.d. = 11.95) and 84.8% had at least
some college education.
The two prediction frames, “University B has a 30% chance of
winning” and “University A has a 70% chance of winning”, are
logically equivalent. Similarly, the two outcome frames, “University
A lost to University B” and “University B defeated University A”
represent the same outcome. Moreover, we can see that the Brier score
was the same (0.72 = 0.49) in all combinations of
conditions. Therefore, if subjects evaluated the predictions based on
a standard similar to the Brier score, then across all conditions, the
predictions should be categorized as wrong in similar proportions, and
receive similar accuracy ratings. However, as discussed earlier, I
hypothesize that predictions stated in congruent frames would be rated
as more accurate, compared to those in incongruent frames. Whether a
prediction is congruent or not is determined by the combination of the
qualitative component of the prediction (i.e., whether A or B will
win) and the outcome of the event. In this experiment, the two
outcome-frame conditions contains the same logical outcome (University
A lost or University B won). Therefore, while congruency varied
between the two prediction-frame conditions, congruency was the same
for both outcome-frame conditions.
In the congruent condition the qualitative component (University B
wins) matches the outcome irrespective of the outcome-frame condition
(whether University A lost or University B won). In contrast, in the
incongruent condition, the qualitative component of the prediction
(University A wins) does not match the outcome for either
outcome-frame conditions. Hence I hypothesize that subjects would
rate the prediction in the congruent frame as more accurate, compared
to that in the incongruent frame. In comparison, the two different
outcome frames contains the same gist information. Therefore, I
hypothesize that different outcome frames would not influence people’s
judgments.
I first performed a χ2 test of independence to examine whether
the prediction frames are associated with whether subjects consider
the predictions to be wrong. In the congruent condition, 12 of 56
(21.4%) subjects judged the prediction to be wrong, compared to 29 of
56 (51.8%) in the incongruent condition, a difference which was
significant (χ2(1, N=112) = 11.119, p = 0.001, φ = 0.315). This indicates
that subjects in the congruent condition were less likely to think
that the prediction was wrong, even though both predictions had the
same Brier score.
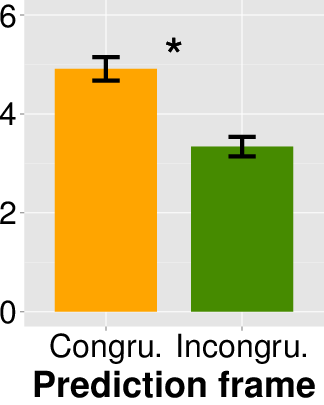
Next I examined whether predictions in the congruent frame would be
rated as more accurate. The mean rating in the congruent prediction
frame was 4.91 (s.d. = 1.79), higher than that of the incongruent
prediction frame at 3.34 (s.d. = 1.47), and this difference was
significant (t(110) = 5.077, p = 0.000, Cohen’s d = 0.968). This again supports
the hypothesis that people would rate the congruent prediction to be
more accurate than the incongruent prediction. The upper left panel
in Figure 1 illustrates this result graphically.
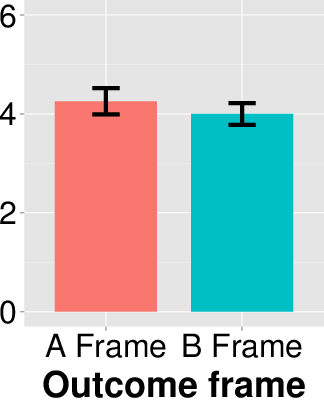
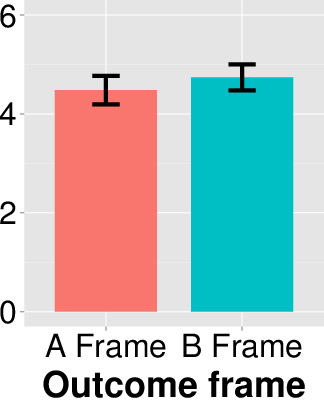
I then examined the differences in the responses between different
counter-balanced conditions in the outcome frames. In the
forced-choice question of whether the prediction was wrong, there was
no significant difference between different outcome frames
(χ2(1, N=112) = 0.198, p = 0.656, φ = 0.042). Moreover, I found the mean
accuracy rating—4.25 (s.d. = 1.96) for the A frame and 4.00
(s.d. = 1.66) for the B frame, respectively—to be quite similar,
and there was no significant difference
(t(110) = 0.742, p = 0.460, Cohen’s d = 0.142). Additionally, there was no
interaction between prediction frame and outcome frame
(F(1, 108) = 0.319, p = 0.573, η2 = 0.002). These results suggest that
how the outcome was framed did not influence people’s choices and
ratings.
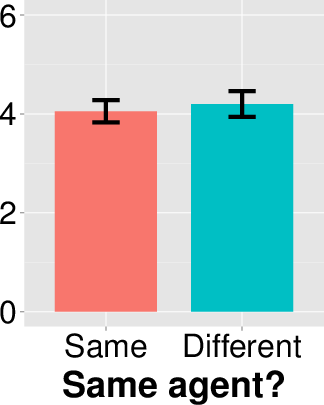
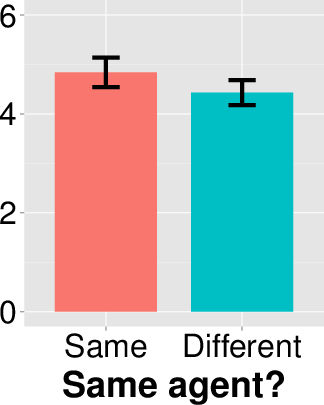
I also carried out a post-hoc analysis on whether having the same
agent in the prediction frame and outcome frame would lead to higher
accuracy ratings, as it might be easier for people to process
prediction/outcome pairs involving the same agents. I found this to
not be the case. There were no significant differences in the
forced-choice question about whether the prediction was wrong
(χ2(1, N=112) = 0.003, p = 0.958, φ = 0.005). Moreover, the mean accuracy
rating of subjects who had the same agent in both frames was lower
(4.05, s.d. = 1.69) than those with different agents (4.20, s.d. =
1.94), and the difference was not significant
(t(110) = 0.429, p = 0.669, Cohen’s d = 0.082). These results are plotted in the
top row of Figure 1.
Self-reported football knowledge was quite evenly spread over the
4-point scale. There were 32, 33, 23, and 24 responses, from the
least knowledgeable to the most knowledgeable, respectively. To
investigate whether there was an interaction between football
knowledge and the prediction frame on accuracy ratings, I carried out
an ANCOVA analysis. The results indicated that there was no
significant interaction (F(1) = 0.696, p = 0.41).
Figure 1: Results of Experiments 1A and 1B. The top row shows the
results for Experiment 1A and the bottom for Experiment 1B. Each
graph plots a comparison of accuracy ratings for a different
factor. Orange and green colors represent the ratings for the
congruent and incongruent predictions, respectively; salmon and
cyan represent unhypothesized ones. Error bars represent ± 1s.e. Asterisks indicate significant differences.
Experiment 1A
Experiment 1B
3.3 Discussion (Experiment 1A)
This experiment was the first test for the main hypothesis and the
results strongly supported it. Although both predictions were
logically equivalent—both predicted that there was a 30% chance of
the eventual outcome occurring—the prediction in the congruent
condition was less likely to be labeled as wrong, and was rated as
more accurate. At the same time, the way the outcome was presented was
found to have no influence on how the prediction was rated. Similarly,
whether the same agent was used in the prediction and the outcome did
not influence people’s judgments. The results of Experiment 1A
suggest that frames significantly change people’s evaluations of those
predictions—people consider a prediction that are stated congruently
with the outcome to be more accurate than one that are stated
incongruently.
Nonetheless, some issues remain that could not be addressed by this
experiment alone. The most important is whether this result can be
replicated in a more controlled environment, and therefore I carried
out a replication in a university lab.
3.4 Methods (Experiment 1B)
The main objective of Experiment 1B was to replicate the results of
Experiment 1A in a lab setting. I recruited subjects from a large
university in Beijing, China. I kept the design of Experiment 1A
unchanged and simply translated the stimuli into Chinese. The only
notable difference is that I changed the target of prediction from an
American football game to a basketball game. Not only is basketball a
more popular sports in China, it also cannot end in ties, therefore
satisfying the two-outcome requirement. The experiment material was
translated and back-translated by two native Chinese
speakers. Discrepancies in the original and back-translated versions
were reviewed and resolved by these two native speakers. Subjects
were paid 15 RMB (~US$2.5) for their participation in
a package of several experiments. This experiment was the first within
the package. Most finished all experiments in 10-20 minutes.
3.5 Results and discussion (Experiment 1B)
Out of a total of 137 subjects, 62 (45.3%) failed the attention
check, leaving 75 data points. The portion of subjects failing the
attention check was quite high, which resulted in the experiment
having weaker power than expected. However, as we will see, the
pattern of results was quite similar to that of Experiment 1A.
I first used a χ2 test of independence to ask if the
prediction frame influenced whether the subjects considered the
prediction to be wrong. Although the result was in the right
direction—a higher proportion of the subjects in the congruent
condition (26 of 31, or 83.87%) considered the prediction to not be
wrong than did those in the incongruent condition (30 of 44, or
68.2%)—the effect was not quite significant
(χ2(1, N=75) = 2.367, p = 0.124, φ = 0.178). This result was the only one
that deviated from the results of Experiment 1A. All other tests
concerning the main hypothesis resulted in the same direction and
significance as in Experiment 1A.
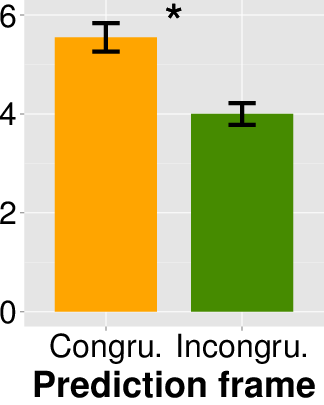
Congruency had a significant effect on accuracy ratings, with the
ratings for the congruent frame (M = 5.55, s.d. = 1.61)
significantly higher than those for the incongruent frame (M = 4.00,
s.d. = 1.46; t(73) = 4.331, p = 0.000, Cohen’s d = 1.016). Also similar to
Experiment 1A, the outcome frames (t(73) = 0.634, p = 0.528, Cohen’s d = 0.150)
and whether the prediction and outcome had the same agent
(t(73) = 1.045, p = 0.299, Cohen’s d = 0.241) had nonsignificant effect. The
results are shown in the bottom row of
Figure 1. By comparing the top (Experiment 1A)
and bottom (Experiment 1B) rows, we can see that the results from
these two experiments were quite similar. The similarity of the
pattern of results across the two different settings suggests that
these results are robust.
3.6 Discussion
The results from these two experiments provide initial evidence
supporting the congruency effect. In both the internet-based data
collected in the United States and the lab-based data collected in
China, predictions stated in the direction congruent with the outcome
were rated as more accurate than those stated in the incongruent
direction, even though all predictions were logically
equivalent. Moreover, I found that people’s judgments were not
affected by which agent was used in the outcome or whether the same
agent was used in both prediction and outcome.
4 Experiment 2
Experiment 2 used a simple design to address an alternative
explanation due to the phrasing in the stimuli of Experiment 1.
Negative phrasing (“Was the prediction made by the other student
wrong?”) was chosen for the forced-choice question in Experiment 1
because the performance of the predictions in both conditions was
lower than chance. However, negatively phrased questions may be
somewhat unnatural to subjects, and might not be representative of how
evaluations are usually elicited in everyday life. Previous research
has found that positively and negatively framed procedures do not
necessarily give the same result (Yaniv & Schul, 1997; Choi, Dalal,
Kim-Prieto, & Park, 2003). Moreover, there is a possibility that the
negative phrasing in the forced-choice question could have even
influenced how subjects responded to the accuracy ratings question
that followed. Therefore I carried out Experiment 2 to eliminate this
potential issue.
4.1 Methods
I recruited subjects from Amazon Mechanical Turk and used a procedure
that was mostly identical to that in Experiment 1A. The subjects were
given the same stimuli about a prediction from another student about
an upcoming football game. The only difference lay in how I elicited
the forced-choice response regarding the prediction; I asked, “Was
the prediction made by the other student right?”
4.2 Results
Experiment 2 had a total of 78 subjects (34.6% female), after
discarding data from nine individuals (10.3%) for failing the
attention check. The mean age was 29.03 (s.d. = 12.73) and 88.5%
had at least some college education.
The main objective of this experiment was to test whether the
congruency effect could be replicated when the forced-choice question
were elicited in positive terms. I first analyzed the results of the
forced-choice question in which the subjects were asked whether the
prediction was right. In the congruent condition, 22 of 40 (55.0%)
responded affirmatively, whereas in the incongruent condition, only 8
of 38 subjects (21.1%) responded so. χ2 test showed that this
difference was significant (χ2(1, N=78) = 9.488, p = 0.002, φ = 0.349).
The accuracy ratings for the two conditions painted a similar
picture. The mean accuracy rating for the congruent condition was 5.05
(s.d. = 2.06), compared to a rating of 3.39 (s.d. = 1.72) for the
incongruent condition, a difference that was significant
(t(76) = 3.841, p = 0.000, Cohen’s d = 0.882).
4.3 Discussion
Experiment 2 focused on whether the congruency effect holds when
people are asked to evaluate predictions in positive terms. Results
indicated that this is indeed the case—the pattern of results found
in Experiments 1A and 1B was replicated in this experiment. This
suggests the congruency effect to be robust regardless of the valence
in which evaluations were elicited.
5 Experiment 3
Table 1: Design of Experiment 3.
Agent
Outcome
Probability
Full prediction
Congruency
NRT
Wins
p
NRT wins @ 80%
Incongruent
NRT
Loses
1−p
NRT loses @ 20%
Congruent
CTS
Wins
1−p
CRT wins @ 20%
Congruent
CTS
Loses
p
CRT loses @ 80%
Incongruent
Note: Each row represents a combination of the congruency condition and the agent condition. The first three columns indicate the various parts of the predictions and the fourth gives a schematic representation of the prediction produced by combining the three. The fifth column indicates the congruency for each row, by comparing the qualitative component of the prediction against the actual outcome (the CRT party won).
The main objectives of Experiment 3 were to extend the findings of
Experiments 1 and 2 and to explore whether the congruency effect could
be further generalized. Many different logically equivalent
predictions can be constructed by altering the components in a
prediction. For example, in Experiments 1 and 2, I compared the
predictions “University A has a 70% chance of winning” against
“University B has a 30% chance of winning”. However, predictions
such as “University A has 30% chance of losing” or “University B
has a 70% chance of losing” are also logically equivalent to the
first two. If the results we have seen are indeed due to the
difference in congruency, as I hypothesize, then we should expect the
same pattern of results with other logically equivalent predictions as
well.
I limited the scope of this experiment to two-subcomponent predictions.
In this setup, there are four logically equivalent ways of stating a
prediction without using verbal negation (e.g., “not win”). These
four ways are shown in Table 1. The
first column displays the agents in the predictions and the second
column matches them to one of the two possible outcomes. The third
column displays the stated probability (p) of the event occurring
(we assume p > 0.5). The fourth column combines the first three to
form a prediction. If congruency indeed influences people’s accuracy
ratings, then the predictions in the two congruent conditions should
be rated as more accurate than the predictions in the two incongruent
conditions.
5.1 Methods
I recruited a total of 138 subjects from Amazon Mechanical Turk. Each
subject was paid US$0.40. This experiment used a cover story about an
election. Before the experimental section, the subjects completed an
attention check similar to the one described in Experiment 1. The
experiment had a 2 × 2 (congruency × agent)
between-subjects design. The congruency factor indicates whether the
prediction frame was congruent, and is the main focus of the
experiment. The agent factor indicates whether the agent of the
prediction was the eventual winner or loser, and served as a
counter-balancing factor. The instructions were as follows:
Acme Inc. is a company that conducts public opinion polls in
Europe. Recently there was a general election in a small European
country. The two major parties involved were the NRT and CTS
parties. Other than these two major parties, all other parties are
much smaller and had no chance of winning the election. Before the
election Acme Inc. had predicted that the [[ (Congruent/Winner)
CTS party had a 20 percent chance of winning |||
(Congruent/Loser) NRT party had a 20 percent chance of losing
||| (Incongruent/Winner) CTS party had an 80 percent chance of
losing ||| (Incongruent/Loser) NRT party had an 80 percent
chance of winning ]].
Results from the election showed that the CTS party has won.
In Experiment 3 I focused on the accuracy ratings given by the
subjects and therefore did not give the forced-choice question about
whether the prediction was right or wrong, as I did in the Experiments
1 and 2. This has the additional benefit of testing whether the same
pattern of results on accuracy ratings would be produced without the
forced-choice question appearing prior to the accuracy rating
question. The experiment prompted the subjects with a question “How
accurate was the prediction?” and the answers were elicited using a
9-point scale (from “Extremely Inaccurate” to “Extremely
Accurate”). Finally the subjects completed a demographics survey.
5.2 Results
Five subjects (3.8%) failed the attention check, leaving 133
subjects. The mean age was 30.74 (s.d. = 10.41) and 34.59% was
female.
I first tested the main hypothesis—whether congruency indeed
influenced people’s judgments. Although the predictions in all four
conditions had the same Brier score (0.82), the predictions in the
congruent conditions were rated as more accurate as hypothesized: The
mean accuracy rating of the two congruent conditions was 4.32 (s.d. =
2.15), higher than those of the two incongruent conditions at 2.42
(s.d. = 1.8), and the difference was significant, with a strong
effect size similar to those in previous experiments
(t(131) = 5.528, p = 0.000, Cohen’s d = 0.959).
I carried out a more stringent post-hoc test of the hypothesis by
comparing the lower rated congruent condition against the higher rated
incongruent condition. The accuracy ratings of the Congruent/Winner
condition was lower among the two congruent conditions (M = 3.72,
s.d. = 2.14) whereas the ratings of the Incongruent/Loser condition
was higher among the two incongruent conditions (M = 2.72, s.d. =
2.14). The difference between the two conditions was in the right
direction, although not quite significant
(t(62) = 1.866, p = 0.067, Cohen’s d = 0.466, two tailed). All other pairwise
t-tests between conditions of opposite congruencies resulted in
significant differences in the right direction. These results provide
further support for the main hypothesis.
I then carried out some additional post-hoc analyses. I first
compared the ratings given to predictions between the two
counter-balancing conditions in the agent factor—predictions with
either the eventual winner or the eventual loser as the agent—and
found that there was no significant difference
(t(131) = 0.719, p = 0.474, Cohen’s d = 0.125).
I also performed a post-hoc check for an interaction between
congruency and predicted outcome (whether the prediction was for a win
or for a loss) and found that the result was nonsignificant
(F(1, 129) = 0.760, p = 0.385, η2 = 0.005).
5.3 Discussion
In Experiment 3 I investigated whether the congruency effect can be
generalized more broadly to other variations of congruent and
incongruent frames. Predictions in all four conditions in this
experiment were logically equivalent, but two were framed congruently
and two incongruently. As hypothesized, subjects rated the congruent
predictions to be more accurate than the incongruent predictions. The
results demonstrated that the congruency effect can be observed in the
contrast between various variations of logically equivalent
predictions, and is not limited to the particular pair of predictions
used in Experiments 1 and 2.
6 Experiment 4
I carried out Experiment 4 with the following objectives. First, so
far I have tested only two-subcomponent predictions: Predictions that
involve an agent (e.g., Team A, the NRT party, etc.) and an outcome
(e.g., winning). In Experiment 4, I wanted to test the congruency
effect in predictions composed of a single qualitative subcomponent,
ones with an indivisible outcome.
Second, in Experiments 1–3 the congruent predictions were stated
with probability values that were below chance (<50%) whereas the
incongruent predictions, using the numerical complements of the
congruent version, were stated with probability values that were above
chance. For example, in Experiments 1 and 2 the congruent prediction
was stated with a probability of 30%, whereas the incongruent
prediction was stated with a probability of 70%. Although there are
no a priori reasons that the congruency effect would not apply if
these values were reversed, I would like to formally test against
this possibility.
Third, while previous experiments investigated people’s evaluation of
different predictions with respect to one of the two possible outcomes
in a binary event, Experiment 4 contrasts the judgments for
predictions with respect to both outcomes. In cases concerning binary
events, a prediction that is congruent with one outcome would be
incongruent with an opposite outcome. It follows that, if there are
two logically equivalent predictions about a binary event but with
opposite qualitative components (X% chance of A occurring and
1−X% chance of ¬ A occurring), one of these two predictions
would be congruent under one of the possible outcomes, while the other
prediction would be incongruent. Therefore, if A indeed occurs, the
hypothesis predicts that the first prediction will be rated as more
accurate than the second one, and vice versa. However, the
experiments thus far used either exactly one outcome (Experiment 3),
or a group of logically equivalent outcomes (Experiments 1 and 2), and
have not compared evaluations of predictions with respect to different
outcomes. Therefore in the current experiment I elicited judgments
about the accuracy of the same predictions with respect to both
possible outcomes in order to directly compare judgments when
different outcomes occur, and to test whether the main hypothesis would
continue to hold.
6.1 Methods
Table 2: Design and results of Experiment 4.
Original scenario
Alternative scenario
Prediction
Outcome
Congruency
Mean
s.d.
Outcome
Congruency
Mean
s.d.
70% Pass
Pass
Congruent
5.97
1.02
Fail
Incongruent
2.74
1.24
30% Fail
Pass
Incongruent
3.79
1.61
Fail
Congruent
4.07
1.58
70% Pass
Fail
Incongruent
2.64
1.39
Pass
Congruent
5.49
1.28
30% Fail
Fail
Congruent
3.74
1.55
Pass
Incongruent
4.00
1.75
Note: Each row represents a combination of the prediction condition and the outcome condition. The top two and bottom two rows are separated to emphasize the difference in the order the outcomes were given to the subjects. Each subject gave judgments to both possible outcomes—the first listed under Original scenario and the second under Alternative scenario. The stated prediction is shown in the left-most column. The outcomes, congruency, ratings are indicated within each column groups. All predictions were logically equivalent: 70% chance of passing or 30% chance of failing.
Amazon Mechanical Turk was again used to recruit subjects for this
experiment. The beginning of this experiment was similar to the
previous ones. After giving consent, the subjects were given an
attention check, and were then given instructions as follows, with the
prediction factor and the outcome factor indicated using double
brackets and parentheses:
Imagine that you are a college student and you have just arrived a
little early for a new class on the first day of the
semester. Another student was already there. The two of you started
talking and the conversation turned to a closely contested
proposition about student bus passes in the upcoming student council
election. The other student predicted that there is a [[
(Prediction: 70% Pass) 70% chance that the proposition will pass
||| (Prediction: 30% Fail) 30% chance that the proposition
will fail ]].
The election took place later that week and the proposition [[
(Outcome: Pass) passed ||| (Outcome: Fail) failed ]].
I then asked subjects to rate the accuracy of the other student’s
prediction on a 7-point scale (from “Extremely Inaccurate” to
“Extremely Accurate”) with respect to the outcome (the
original scenario). As I was interested in understanding how
people would rate the predictions if the outcome was reversed, I then
elicited their responses for an alternative scenario (which was
shown in a new web page so that they cannot see their previous
responses):
If instead, the proposition had [[ (outcome: Fail) failed
||| (outcome: Pass) passed ]], how accurate do you think
the other student’s prediction was?
Note that in the alternative scenario the subjects were always given
an outcome that was the opposite of what they read previously. This
second accuracy rating was also elicited using the same 7-point
scale. Finally, subjects were given a short demographics survey.
6.2 Results
There was a total of 136 subjects. Twelve individuals (8.8%) failed
the attention check and therefore their data were not used in the
following analyses, leaving 124 subjects.
Results from Experiment 4 are shown in
Table 2. Each row of the table crosses a
prediction condition with an outcome condition (both
between-subjects). The two column groups in the table represent the
original and the alternative scenarios (within-subjects), each
associated with one of the two possible outcomes.
In this experiment, the predictions in all conditions, listed in the
left-most column, were either “70% pass” or “30% fail”, and were
thus logically equivalent. The top two and bottom two rows are
separated, however, to emphasize that not only the outcome conditions
are different, the order of the presentation of the outcomes was
different—subjects in the conditions represented by the top two rows
were told that the result was pass in the original scenario,
and fail in the alternative scenario, and the results were
reversed for the bottom two rows. Within each column group, the
prediction and the outcome were compared to determine congruency,
which was followed by the mean and s.d. of the accuracy ratings.
I first analyzed the overall difference between congruencies by
aggregating the responses over all scenario and outcome
conditions. Here the mean accuracy rating of the congruent condition
(M = 4.84, s.d. = 1.64) was higher than that of the incongruent
condition (M = 3.27, s.d. = 1.61), and the difference was
significant (t(246) = 7.570, p = 0.000, Cohen’s d = 0.961). The result here
showed that taken altogether, predictions that are congruently framed
are indeed rated as more accurate than those incongruently framed.
I then examined the simple effects organized by the scenario and
outcome factors. I begin by analyzing the judgments under the
original scenario, separately at each of the two levels of the outcome
factor (either pass or fail). For the conditions in
which the outcome is pass, the contrast is displayed in the
first and second rows in Table 2, under
the original scenario column group. Similar to previous experiments,
I predicted that the congruent prediction to be rated as more
accurate. As expected, between these two high accuracy conditions
(Brier score = 0.32), the congruent condition (M = 5.97,
s.d. = 1.02) was rated significantly higher in accuracy than
the incongruent condition (M = 3.79, s.d. = 1.61;
t(58) = 6.294, p = 0.000, Cohen’s d = 1.626). I then compared the two
conditions in which the original scenario was fail, represented
in third and fourth rows under original scenario. Between these two
low accuracy conditions (BS = 0.72), the congruent condition (M =
3.74, s.d. = 1.55) was also rated significantly higher in
accuracy than the incongruent condition (M = 2.64, s.d. =
1.39; t(62) = 3.011, p = 0.004, Cohen’s d = 0.753).
The responses for the alternative scenario were almost a mirror image
of those for the original one. I first examined the simple results in
which the outcome was pass (third and fourth rows under
alternative scenario column group). Between these high accuracy
conditions (BS = 0.32), the congruent prediction was rated as more
accurate (M = 5.49, s.d. = 1.28) than the incongruent
prediction (M = 4.00, s.d. = 1.75), and this difference was
significant (t(58) = 3.635, p = 0.001, Cohen’s d = 0.939). I then compared the
low accuracy conditions in which the outcome was fail (BS =
0.72; first and second rows). Here the accuracy ratings for the
congruent prediction (M = 4.07, s.d. = 1.58) were also
significantly higher than those of the incongruent prediction (M =
2.74, s.d. = 1.24; t(62) = 3.892, p = 0.000, Cohen’s d = 0.973). In
all four simple effects tested, and overall, the congruently framed
prediction was rated as more accurate than the incongruently framed
prediction, demonstrating that the congruency effect to be robust
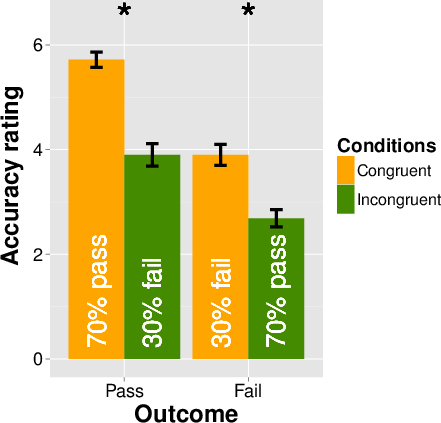
across different outcomes. I aggregated the responses across the two
scenarios, and displayed the results graphically in
Figure 2.
Next I evaluated the overall effects between the two predictions,
“70% pass” and “30% fail”. I aggregated over all results for
both outcome conditions and for both the original and the alternative
scenarios. The overall mean accuracy rating of the predictions “70%
pass” (M = 4.2, s.d. = 1.96) and “30% fail” (M = 3.9,
s.d. = 1.61) were not significantly different
(t(246) = 1.325, p = 0.186, Cohen’s d = 0.168), indicating that there was no
overall prediction effect. I then tested whether the two different
predictions might interact with congruency using a 2 × 2
ANOVA. The results showed that the interaction was significant,
suggesting that the congruency effect is stronger with the “70%
Pass” condition than with the “30% Fail” condition
(F(1, 244) = 68.948, p = 0.000, η2 = 0.177).
I also tested if the order of the response—whether the prediction
was evaluated first or last—might influence people’s assessment of
the predictions. The order had no effect
(t(246) = 0.352, p = 0.726, Cohen’s d = 0.045). A 2 × 2 ANOVA on
congruency and order show that there was no interaction effect either
(F(1, 244) = 0.297, p = 0.587, η2 = 0.001). These results suggest that
the effect observed cannot be explained by the experimental design
(namely, the fact that two responses were elicited from each subject).
Although the primary objective of this paper is to contrast
differently framed predictions that are logically equivalent (that is,
predictions with identical Brier scores), comparing predictions that
have different Brier scores could give us insights about people’s
behavior in more general cases. Hence, I conducted a post-hoc
analysis comparing the accuracy assessment for predictions that had
the “pass” outcome with predictions that had the “fail” outcome.
For both predictions, a “pass” outcome is associated with a better
Brier score, therefore I expected predictions would be evaluated as
being more accurate when the outcome was “pass” (BS = 0.32),
compared to when the outcome was “fail” (BS = 0.72). The result
confirmed my expectation, with a mean rating of 4.84 (s.d. = 1.7)
when the outcome was “pass”, compared to a mean rating of 3.27
(s.d. = 1.55) when the outcome was “fail”. A t-test
confirmed that the difference was indeed significant
(t(246) = 7.570, p = 0.000, Cohen’s d = 0.961). This result confirms the
intuition that people’s evaluation of the accuracy of predictions
depend greatly on the outcome.
Figure 2: The accuracy ratings organized by outcome and congruency, and aggregated over the scenario factor, in Experiment 4.
The white wordings inside the bars indicate the predictions.
Given an outcome, predictions framed congruently were rated as significantly more accurate.
Note that congruency depends on the interaction between the prediction and the outcome.
Error bars represent ± 1s.e.
6.3 Discussion
In this experiment I tested the congruency effect on one-subcomponent
predictions. I elicited people’s accuracy judgments about various
logically equivalent predictions with respect to both possible
outcomes of a binary-outcome event. I found that, first, the
congruency effect holds for one-subcomponent predictions as
well—people’s accuracy ratings for congruent predictions are higher
than for logically equivalent incongruent predictions, both with
respect to specific outcomes and overall. Together with the results
from the previous experiments, this shows that the congruency effect
applies to both one- and two-subcomponent predictions.
Second, the congruency effect is not limited to cases in which the
congruent predictions are stated with lower probabilities than those
for the incongruent predictions.
Third, when aggregated over the two possible outcomes, there is no
overall difference in accuracy ratings between a pair of logically
equivalent predictions that are opposite in their qualitative
component. Fourth, if a pair of logically equivalent predictions are
made about a binary-outcome event and their qualitative component are
logical complements of each other, one of the predictions would be
rated as more accurate if one outcome occurs, and the other
predictions would be rated as more accurate otherwise. These two
findings illustrate that the consequences of the congruency effect can
be observed only with respect to a specific outcome.
7 Experiment 5
The first four experiments in this paper have demonstrated that when
people are asked to evaluate the accuracy of predictions, those
presented in a congruent frame would be judged to be more accurate.
Experiment 5 investigates whether this can be extended to choice
tasks—here two predictions, one in a congruent frame and one in an
incongruent frame, were presented simultaneously, and subjects were
asked to choose which of the two was the more accurate.
In addition, this experiment explores two other factors that might
shed light on the mechanism of the congruency effect. First, much
prior research suggested that numeracy plays an important role in
judgment and decision making. One example is the attribute-framing
effect, in which a single attribute presented in two logically
equivalent frames of opposing valence (e.g., beef that was labeled as
“75% lean” or “25% fat”) can change people’s evaluations about
the target (Levin & Gaeth, 1988). Subjects higher in numeracy were
found to be less susceptible to the attribute framing effect (Peters,
Västfjäll, Slovic, Mertz, Mazzocco & Dickert, 2006). Although the
framing effect studied in the current paper concerns different kinds
of judgments, it is possible that numeracy similarly moderates the
link between frames and choice.
Second, when two logically equivalent predictions are being evaluated
with respect to the outcome, the one stated with higher strength of
belief might be thought to be made by someone more confident about his
or her prediction, and this might potentially influence assessment of
the accuracy ratings. Specifically, it is possible that due to their
higher perceived confidence, they are judged more harshly (Paulhus,
1998; Tenney, Spellman, & MacCoun, 2008). To investigate the
influence of these two factors, in Experiment 5 I also assessed
subjects’ numeracy and perceptions about the predictor’s confidence.
7.1 Methods
Subjects were recruited through Amazon Mechanical Turk. In previous
experiments, logically equivalent predictions of different
congruencies were presented between-subjects. However, in this
experiment I presented subjects a choice task with both congruent and
incongruent frames side-by-side as two options; a setup with such total
equivalence might seem contrived. Furthermore, I wanted to test
whether the congruent frame would be favored even if it was logically
inferior. Hence the stimuli were set up so that the prediction in the
incongruent frame was logically superior to that of the congruent
frame. Additionally, in order to make the scenarios more realistic, I
added two distractor predictions to each option. The instructions in
one of the conditions read:
Imagine that you are an analyst at an investment firm. Currently you
are evaluating predictions made a year ago by two of your
subordinates concerning a technology company called Acme Corp.
Analyst A predicted that in the coming year:
Acme would buy out their supplier SuperTech Company.
Acme would expand into the European Union.
There was an 80% chance that Acme would become a public company.
Analyst B predicted that in the coming year:
Acme would license crucial technology patents from their competitor CompX Company.
Acme would build another manufacturing plant within the U.S.
There was a 15% chance that Acme would not become a public company.
The last predicted outcome—whether Acme would become public or
not—was common for both analysts, and was the focus of the current
experiment. In addition to the common predicted outcome (expressed as
an incongruently framed prediction by one analyst and as a congruently
framed prediction by the other), there were two unique distractor
predictions from each analyst. Therefore there were six different
predictions, but only five distinct predicted outcomes.
There were four (2 × 2) counter-balanced conditions. First,
the order of the congruent and incongruent options was randomized
between subjects. Second, one of the two distractors from each of the
analysts would turn out to be true, and they are counter-balanced. For
roughly half of the subjects the supplier buyout and new
U.S. manufacturing plant turned out to be true, and European Union
expansion and patent licensing turned out to be false; for the other
half the predictions that were correct (and those that were incorrect)
were reversed.
In all conditions, Acme would not become public. In the
counter-balancing condition shown above, Analyst A predicted that
there was an 80% chance of the target event (Acme becoming a public
company) occurring. Analyst B, in contrast, predicted that there was a
15% chance of the target event not occurring. Since the target event
did not occur, the prediction by Analyst A (BS = 0.82) was
logically superior to the analogous prediction by Analyst B (BS =
0.852). As the outcomes and accuracy about the distractor
predictions were balanced, Analyst A should be evaluated as being more
accurate, if prediction frames had no influence on people’s judgments.
After the subjects had read about the outcome, I asked them “Which
analyst do you think made the better predictions?” and “Which
analyst do you think was more confident about the predictions?” Both
questions were forced-choice questions with the two analysts as
response options. Following these questions I presented (in a new web
page) a memory test, in which I asked the subjects to indicate whether
each of the five predicted events actually occurred. In the
instructions for the memory test I explicitly informed the subjects
that they would not be penalized even if they did not remember
correctly. Then, to investigate the influence of subjects’ numeracy
on their judgments, I gave the 8-item abbreviated numeracy scale
(Weller, Dieckmann, Tusler, Mertz, Burns, & Peters, 2013). After the
numeracy section, subjects answered a few demographic questions,
including two questions about their level of knowledge concerning
stock trading and technology.
7.2 Results
There were 110 subjects (60% female, with one who declined to
self-identify along this dimension). I discarded data from 25 (22.7%)
subjects: 24 for failing the attention check and 1 for leaving over
80% of the answers blank,4 resulting in 85 subjects used in the
following analysis. The mean age was 33.1 (s.d. = 12.87), and 87.1%
had at least some college education.
The portion of workers who failed the attention check was somewhat
higher than those of previous experiments.5 To alleviate concerns about the quality of the current
sample, and to better assess whether subjects who passed the attention
check were attentive during the experiment, I examined the results of
the memory test. The possible range of the memory score was from 0 to
5, representing the number of test questions answered correctly. The
mean memory score of the remaining subjects was quite high at 4.25,
indicating that the subjects paid attention during the experiment and
remembered most details about the stimuli. I also note that subjects
were not informed of the memory test prior to it. Hence it is likely
that they did not memorize the outcomes for the purpose of passing the
memory test, but have remembered them as a result of having processed
the stimuli in order to make the accuracy and confidence
judgments. Based on these results, I believe that the subjects who
passed the attention check likely did pay sufficient attention to the
task, and proceeded with the analysis using the data from these
subjects.
The main objective of this experiment was to test whether the
congruency effect could be extended to a choice task. More subjects
(n = 56; 65.9%) chose the analyst in the congruent condition as
more accurate than the one in the incongruent condition (n = 29;
34.1%). A χ2 test showed that this result was significantly
different from chance (χ2(1, N=85) = 8.576, p = 0.003, φ = 0.318),
indicating that the congruency effect applies to choice tasks as well.
I then examined whether perception of confidence was related to the
congruency effect. If the lower evaluation of the accuracy of
incongruent options was due to a perception of overconfidence on the
part of the analyst, then subjects’ choice of the more accurate
analyst and the more confident analyst would not be independent. Of
the 56 subjects who chose the congruent option as being more accurate,
32 (57.1%) judged the incongruent analyst to be the more confident,
compared to 18 of the 29 (62.0%) subjects who chose the incongruent
option. This result was not significant
(χ2(1, N=85) = 0.191, p = 0.662, φ = 0.047), which suggests that
perception of predictors’ confidence was not a factor in subjects’
judgments of prediction accuracy.
A post-hoc analysis is then carried out to study the effects of order
of presentation. When the incongruent option was presented first, the
number of subjects who chose the incongruent option (n=20) as being
the more accurate was approximately the same as the number who chose
the congruent option (n=21). However, when the congruent option was
presented first, 35 subjects judged the congruent option to be more
accurate, while only 9 chose the incongruent option. This interaction
was significant (χ2(1, N=85) = 7.576, p = 0.006, φ = 0.299), indicating
that order of presentation significantly influenced evaluation of
accuracy. In contrast, order of presentation did not have a significant effect on
the evaluation of confidence (χ2(1, N=85) = 0.243, p = 0.622, φ = 0.053).
Table 3: Relationship between numeracy and the congruency effect in Experiment 5.
Numeracy score
1
2
3
4
5
6
7
Congruent choice
1
3
14
8
15
10
4
Incongruent choice
1
0
2
4
4
12
6
Note: This contingency table displays, for each numeracy score, the number of subjects who chose either the congruent or the incongruent option as the more accurate one.
I then investigated the effect of numeracy on people’s judgments. As
there are eight questions in the abbreviated numeracy scale, the range
of possible scores is from 0 to 8. On average the subjects answered
4.76 questions correctly, compared to 4.09 for the subjects in Study 1
of Weller et al. (2013). I compared the percentages of subjects who
answered each question correctly for Weller et al.’s and the present
results. On a per-question basis, the mean absolute difference was
11.34%, and this small difference suggests that the numeracy and
motivation of the subjects in this experiment were comparable to those
in Weller et al.’s experiment.
Table 3 displays a contingency table
of the numeracy scores crossed with subjects’ judgments about who was
the more accurate analyst. The mean (and s.d.) of the numeracy
score for subjects who chose the congruent or incongruent options as
more accurate were 4.43 (s.d. = 1.45) and 5.41 (s.d. = 1.45),
respectively. I performed a logistic regression analysis with the
choice of the more accurate analyst as the dependent variable. A
likelihood ratio test comparing a model with numeracy against a model
with only the intercept showed that the difference was significant (B
= 1.64, p < 0.01), indicating that there is an association between
numeracy and choosing the congruent option—people of lower numeracy
are more likely to judge the analyst in the congruent condition to be
more accurate.
The effect of self-reported knowledge about stock trading and
technology on choice of the more accurate analyst was found not to be
significant in either case (p = 0.80 and p = 0.56).
7.3 Discussion
The key objective of this experiment was to investigate whether the
congruency effect would hold in a choice task. I also put the main
hypothesis to a stronger test by presenting the congruent option
against a logically superior incongruent option. Significantly more
subjects chose the logically inferior congruent option, suggesting
that the congruency effect applies to choice tasks as well as rating
tasks. I also found that the evaluators’ perception of the
predictors’ confidence did not explain the congruency effect. However,
numeracy was a moderating factor. The result suggested that people who
are higher in numeracy might be less susceptible to the congruency
effect, corresponding to a similar finding about the attribute framing
effect (Peters et al., 2006).
8 Experiment 6
So far in this paper I have asserted that the congruent and the
incongruent frames are logically equivalent. However, I have not
confirmed that people in general would agree with this
assertion. Therefore, the first objective in the final experiment is
to examine whether naïve subjects do indeed consider these frames
to be logically equivalent. For the ease of exposition, I call this
condition—whether logically equivalent statements of different
congruencies are considered to be equivalent by the general
population—naïve equivalence.
Secondly, while we know from previous experiments that evaluations
of prediction accuracy depend on which of the two possible frames, the
congruent frame or the incongruent frame, is presented, we do not have
data on whether their ratings would deviate from the observed pattern
if people are aware of both ways to frame a prediction. To explore
this question, in Experiment 6 I first give subjects a prediction
stated in either a congruent or incongruent frame, elicit their
accuracy judgment, then restate the prediction using the opposite
frame while bringing to their attention the correspondence between the
two, and finally, elicit their accuracy judgments again. While there
could be a spectrum of possible outcomes, here I will sketch two
extremes. One possibility is that people would maintain their
original evaluation even after being exposed to the second and
alternative frame. This would suggest that people have adopted the
first frame as their frame of reference. At the other end of the
spectrum is the possibility that people would completely integrate the
two frames, in which case their second judgment would likely to be
different from their first. Using this experimental design, we can
find out which one of these two possibilities (or one lying between
the two extremes) corresponds more closely to people’s behavior.
Finally, I also used this experiment to explore a few secondary
objectives concerning people’s perception and beliefs about frames,
including the naturalness of frames of different congruencies, and the
degree to which people think the frames influence their own and other
people’s judgments.
8.1 Methods
Subjects were recruited from Amazon Mechanical Turk. The beginning of
the experiment was essentially identical to the previous
ones—subjects were asked to give consent and were given an attention
check. Afterwards they read a cover story that was similar to that of
Experiment 3. The instructions for the first judgment task were as
follows:
Imagine that some time in the past there was a general election in a
European country. The two major parties involved were the NRT and
CTS parties. All other parties besides these two were much smaller
and had no chance of winning. Therefore one of these two parties
would definitely win the election.
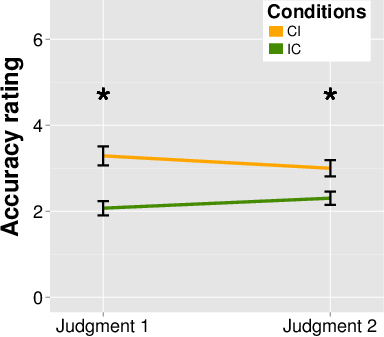
You talked to your friend Chris about this election before it was
held. Chris predicted that there was [[ (CI condition) a 20%
chance that the NRT party would win ||| (IC condition) an 80%
chance that the CTS party would win ]] the election.
Results from after the election indicated that the NRT party won.
The names of the conditions indicate the order of the frames given:
Whether subjects were first shown a congruent frame followed by an
incongruent one (CI), or an incongruent frame followed by a congruent
one (IC). I note that, at this point in the experiment, the subjects
were not aware that they would be given a second prediction later.
All responses in the experimental section used a 7-point scale. Unless
otherwise specified, the level labels ranged from “Extremely
Inaccurate” to “Extremely Accurate”. For the first judgment, I
began by eliciting subjects’ ratings about the accuracy of the
prediction: “How accurate do you think Chris’ prediction was?”
Then, in the next screen, I revealed the alternative frame. For
example, subjects in the CI condition read:
In the previous page, the prediction was given to you as follows:
Chris predicted that there was a 20% chance that the
NRT party would win the election.
However, as only two parties had the chance to win this election,
there is another way that this prediction could be stated:
Chris predicted that there was an 80% chance that the
CTS party would win the election.
Subjects in the IC condition read similar instructions but with the
appropriate terms reversed.
I was interested in whether subjects would consider the two frames to
be logically equivalent and therefore I then asked “Do you agree that
these two ways of stating the prediction are logically the same?”
(labels here ranged from “Strongly Agree” to “Strongly Disagree”),
and I asked subjects to explain their judgments. To study which frame
the subjects found more natural, I next asked “Which of the two
statements sounds more natural to you?” using a 7-point scale. The
labels were “Chris predicted that there was a 20% chance that that
the NRT party would win the election” on one end, and “Chris
predicted that there was an 80% chance that the CTS party would win
the election” on the other, with the middle one labeled “About the
same”.
I then asked subjects to give a second judgment about the accuracy of
the prediction that they first read (i.e., the congruently framed
prediction for the CI group and the incongruently framed one for the
IC group), using the same question as in the first judgment. The
subjects were informed that they were free to change or not change
their answers. However, they were not reminded of what their previous
answers were. Next I asked two questions about subjects’ perception
of the influence of the frames on themselves and on their peers: “How
much do you think that these two different ways of stating the
prediction affected your evaluations?” and “Imagine that one of your
friends also participated in this experiment. How much do you think
that the different ways of stating the prediction might affect his or
her judgments?” (labels ranged from “Not at all” to “Extremely”,
with “Moderately” in the middle). Finally, subjects were given a
short demographics survey similar to those given in previous
experiments.
8.2 Results
There were 125 respondents. Ten individuals (8%) failed the attention
check and their data were removed from analysis, leaving 115 subjects,
59 in the CI condition and 56 in the IC condition.
I first compared the accuracy ratings from the CI and IC conditions in
the first judgment. As the prediction was congruent in the CI
condition but incongruent in the IC condition, I expected that the
accuracy ratings would be higher in the CI condition. Indeed, the
accuracy ratings in the CI condition (M = 3.29, s.d. = 1.71) were
higher than those in the IC condition (M = 2.07, s.d. = 1.25), and
a t-test indicated that the difference was significant
(t(113) = 4.334, p = 0.000, Cohen’s d = 0.809). This replicated the results from
previous experiments.
More interesting, however, was whether this difference persisted after
the alternative frames were revealed to subjects. At this point
subjects in both conditions had seen the same two predictions, with
the major difference being the target of judgment (congruently framed
prediction for the CI condition and incongruently framed prediction
for the IC condition). Results showed a difference still in the same
direction (congruent: M = 3.00, s.d. = 1.45; incongruent: M =
2.30, s.d. = 1.16) and still significant
(t(113) = 2.836, p = 0.005, Cohen’s d = 0.529), although the effect size did
become somewhat smaller. The results are shown in
Figure 3.
Figure 3: Subjects’ judgments about the accuracies of the prediction
before and after the alternative frame were revealed (Judgements 1
and 2, respectively). In both judgments, the prediction in the
congruent frame (the CI condition) was rated as significantly more
accurate. Error bars represent ± 1s.e.
To investigate whether congruency moderated subjects’ change in
judgments before and after I revealed the alternative frames, I
compared between the two conditions the difference in each subject’s
two judgments. I found that the mean rating in the CI condition
decreased by 0.29 (s.d. = 1.3) while the mean rating in the IC
condition increased by 0.23 (s.d. = 1.09). The difference in
changes between the two conditions was significant
(t(113) = 2.314, p = 0.022, Cohen’s d = 0.432), indicating that the ratings
changed in different directions after I revealed the alternative
frames. However, 67 (58.26%) of the subjects did not change their
rating between the first and second judgments. Together with the
result that showed congruency remains significant in the second
judgment, these findings suggest that, while the effect weakened when
alternative frames were brought to the subjects’ attention, congruency
remained a strong influence on subjects’ judgments.
I then examined the issue of naïve equivalence—whether the
subjects considered the two frames to be equivalent. Overall, most
subjects agreed that the two frames were logically equivalent, with 42
(36.52%) responding with “Strongly Agree”, and 43 (37.39%)
responding with “Agree”. The mean rating, from 1 (Strongly Agree) to
7 (Strongly Disagree), was 2.2. This result suggests that the
subjects largely agreed that predictions in congruent and incongruent
frames were logically equivalent, and therefore the stimuli I used
throughout this paper satisfied the naïve equivalence condition.
A post-hoc analysis was carried out to address a potential alternative
explanation originally raised concerning the risky choice framing effect and related
effects (Mandel, 2014; Teigen & Nikolaisen, 2009).
In the context of the current research, it might be possible that numeric
quantifiers (probabilistic terms in predictions) are spontaneously
interpreted by most people as lower bounded, e.g., “80%” could be
interpreted as “at least 80%”. If this was indeed the underlying
factor driving the results, then we should expect to see this given as
explanations by the subjects who did not agree that about the
equivalence of the frames. Of the 16 cases who disagreed or were neutral
regarding the equivalence of the frames,
5 mentioned minor parties (thus ignoring the instructions, which stated
that one of the two parties would win), 3 explained why the statements
were in fact the same (thus indicating that they had responded
incorrectly to the question), 3 referred to intuition without further
specifics, and the remaining 5 gave unclear answers. No subject mentioned
that the numbers were meant as upper or lower bounds (as found by Mandel,
2014, Experiment 3, for the Asian disease problem).
Next I analyzed subjects’ responses about the naturalness of the
predictions. As subjects in both conditions had seen the same two
frames in different orders the result of this analysis could inform us
whether the order of presentation influences judgments of naturalness.
The results were roughly in a tri-modal distribution
(Figure 4). The major mode was the neutral
response (“About the same”), followed by the extreme end of the
“80% CTS” frame (“an 80% chance that the CTS party would win”),
then the extreme end of the “20% NRT” frame (“a 20% chance that
the NRT party would win”). There was more mass on the “80% CTS”
side of the graph (p=0.001 by Wilcoxon test). I coded the responses
from −3 (“80% CTS”) to 3 (“20% NRT”), with the neutral
response as 0. The mean naturalness response for the CI condition was
−0.14 (s.d. = 2.11), whereas the mean naturalness
response for the IC condition was −1.21 (s.d. =
1.33), and the difference here was significant
(t(113) = 3.256, p = 0.001, Cohen’s d = 0.607).6 As subjects in both conditions had seen the
same two frames, the major difference between these two conditions
lies in which frame was presented first. This indicates an order of
presentation effect—that people’s judgments about the naturalness of
frames depend on which frame they were exposed to first. Moreover, it
implies that the first exposure might change how they process
subsequent predictions.
Figure 4: Subjects’ judgments about which of the two frames sounded more natural (Experiment 6). Bars of different colors indicate the frequency of judgments in each condition.
Finally, I examined the degree to which subjects believed the frames
influenced their own and other people’s judgments. The mean rating as
to the influence on selves was 2.55 (s.d. = 1.60; with a higher value
representing a larger influence), whereas the mean rating as to the
influence on friends was 3.30 (s.d. = 1.61). A paired t-test
comparing the difference between these two ratings was significant
(t(114) = 6.693, p = 0.000, Cohen’s d = 0.466), indicating that subjects
believed that the frames would have a bigger effect on their friends
than on themselves. This result agrees with previous research in which
people have been shown to believe that they have greater abilities and
better performance than other people (Alicke & Govorun, 2005; Moore
& Healy, 2008; Svenson, 1981).
8.3 Discussion
Logical equivalence does not necessarily entail naïve
equivalence—whether people in general would consider logically
equivalent predictions to be so. Without naïve equivalence, the
findings in this paper would not be very surprising—predictions that
are different, as might be expected, should lead to different
evaluations. However, this experiment demonstrated that subjects
indeed agreed that the congruently and incongruently framed
predictions in the present experiments were equivalent. Moreover, I
found no evidence of people interpreting probability terms as lower
bounds. Consequently, I argue that the findings from this experiment,
and the paper as a whole, demonstrate inconsistency in subjects’
judgments and choices.
The result of the first judgment replicated findings from previous
experiments—predictions framed congruently were rated as more
accurate. Before the second judgment, I revealed to subjects the
prediction framed with the opposite congruency, thus exposing the same
two predictions to both groups. I then elicited judgment ratings from
subjects again for the prediction that they read first. Subjects in
the congruent condition again rated the prediction to be more accurate
than did those in the incongruent condition. This result indicates
that the congruency effect persisted even after subjects were
explicitly informed of and had processed the alternative frames.
Additionally, the order of presentation influenced subjects’ judgment
about the naturalness of the frames. This finding corroborates what I
found in Experiment 5—the order of presentation moderates the effect
of frames.
Kühberger (1998) found that one of the contributing factors of the
risky choice framing effects is that people fail to infer the logical
complement of options. The current experiment provided some indirect
evidence as to whether this applies to prediction evaluation as
well. Here subjects were given frames in which both the qualitative
and quantitative components were logical complements to each
other. Moreover, their complementary relationship was explicitly
brought to the subjects’ attention. While the subjects agreed that the
two predictions were logically equivalent, the prediction stated in
the congruent frame was rated as more accurate. This suggests that the
failure to infer logical complements cannot explain the congruency
effect.
9 General discussion
In this paper I proposed and tested a hypothesis about how predictions
about binary-outcome events are judged in light of their outcomes. I
decomposed probabilistic predictions into qualitative and quantitative
components, and theorize that these predictions can be categorized into two
classes—congruent and incongruent—based on whether the qualitative
component of the prediction agrees with the eventual outcome. I
hypothesized that predictions made in congruent frames would be
evaluated as more accurate compared to logically equivalent
predictions made in incongruent frames. I labeled this phenomenon the
prediction-assessment congruency effect, and carried out seven
experiments to test it.
All experiments strongly supported this effect, regardless of whether
the judgments were elicited using a rating task (all experiments
except for Experiment 5) or a choice task (Experiment 5); whether the
instructions were phrased in positive valence (Experiment 2 and
others) or not (Experiment 1); whether the predictions involved one
(Experiments 4) or two subcomponents (the rest). It even persisted
when the prediction in the congruent frame was logically inferior to
the one in the incongruent frame (Experiment 5), and after the
alternative frames were revealed to the subjects (Experiment 6). A
similar pattern of results was observed in samples composed of
university students in China (Experiment 1B) and internet users in the
United States (the rest), and the effect might be especially strong
for people who are low in numeracy (Experiment 5). Throughout these
experiments, I found consistent supporting evidence with large effect
sizes in favor of the main hypothesis. Taken together, this
demonstrates a robust and reliable result that should be broadly
generalizable.
The results of these experiments suggest that overall, people do not
evaluate the goodness of predictions in ways consistent with the
principle captured in the Brier score. Instead, they overweigh the
qualitative component of a prediction while underweighing its
quantitative component. While the Brier score was never intended as a
characterization of how predictions are evaluated by people, a gap
between a scoring rule designed by experts and judgments by laymen is
an interesting finding in and of itself. The findings in this paper
might have important implications in domains where evaluation of
predictions play an important role, such as medical decision-making
(Reyna, Nelson, Han, & Dieckmann, 2009) and personal and corporate
finances (Johnson, Jamal, & Berryman, 1991).
I developed and tested the main hypothesis based on the concept of
logical equivalence, which refers to the condition that any one member
from a group of statements necessarily entails the others. Moreover,
Experiment 6 established that the experimental paradigm satisfied
naïve equivalence—subjects recruited from the general population
agreed that predictions of different congruencies were equivalent.
McKenzie and colleagues argued that there is a distinction between
logical equivalence and information equivalence (Sher & McKenzie,
2006; McKenzie & Nelson, 2003). Information equivalence requires
that, in addition to satisfying logical equivalence, no
choice-relevant information can be drawn from the speaker’s choice of
using one frame instead of others (Sher & McKenzie, 2006). According
to this view, there are no general normative problems with logically
equivalent descriptions leading to different choices, as long as the
descriptions are information non-equivalent.
Having established the core results concerning the congruency effect
in the present paper, I am currently investigating approaches towards
building a comprehensive theory that integrates these different
perspectives. However, I emphasize that, even with a lack of
information equivalence, the violation of invariance in judgments and
choices under logical and naïve equivalence is problematic with
respect to prediction evaluation.
In order to further our understanding of the congruency effect, it
would be useful to examine its relationship with several related
theories, in addition to the fuzzy-trace theory that motivated the
main hypothesis. One such theory is the compatibility theory, which
has been shown to exert great influence on people’s behavior (Shafir,
1995). In the realms of judgment and choice, the principle of
compatibility suggests that people overweigh attributes that are
compatible with the required response, and studies have found this
compatibility phenomenon to indeed influence people’s judgment and
choices (Tversky, Sattath, & Slovic, 1988; Slovic, Griffin, &
Tversky, 1990). In the context of the present research, it might be
easier to map the qualitative components (e.g., “A will win”) to the
outcomes (e.g., “A won”), than to map the quantitative components
(e.g., “70%”) to these outcomes. Consequently, the goodness of the
match between the qualitative component and the outcome can be
compared more easily, relative to the match between the quantitative
component and the outcome. As a result, the match between the
qualitative component and the outcome would be overweighed. This
point might be especially relevant in interpreting the results of
Experiment 5, as subjects compared the two predictions to the
outcome.7 Furthermore, process models could yield important
insights and help contrast various qualitative models that make
similar predictions (Bhatia, 2013).
Prior research has suggested that important personal decisions are
less influenced by frames (Marteau, 1989) and therefore this would be
a good test for the boundary conditions of this effect. It would also
be interesting to explore whether experts might be influenced by
frames in the same way as the naïve subjects studied in the
current paper. Additionally, I am also currently examining what roles
selective attention (Levin, 1987) and the encoding of information
(Levin & Gaeth, 1988) might play in bringing about the congruency
effect.
Understanding the relationship between these results and past findings
will give us a fuller picture of the mechanism, the antecedents, and
the boundary conditions of the effect, and can ultimately help us to
develop interventions to reduce the effect, or to take advantage of it
to improve people’s decision-making (Thaler & Sunstein, 2008).
The findings in this paper demonstrate the psychological impact of
frames on the way people evaluate predictions with respect to
outcomes. When predictions are described in frames that are congruent
with the eventual outcome, people consider the predictions as more
accurate than if they were described in incongruent frames. This
observation is not captured by previous literature and highlights the
need for a better understanding of the processes that underlie this
phenomenon.
References
Alicke, M. D., & Govorun, O. (2005). The better-than-average effect. In M. D. Alicke, D. Dunning, & J. Krueger (eds.), The self in social judgment (pp. 85–106). New York, NY: Psychology Press.
Bhatia, S. (2013). Associations and the accumulation of preference. Psychological Review, 120(3), 522–543.
Brier, G. W. (1950). Verification of forecasts expressed in terms of probability. Monthly Weather Review, 78(1), 1–3.
Chandler, J., Mueller, P., & Paolacci, G. (2013). Nonnaïveté among Amazon Mechanical Turk workers: Consequences and solutions for behavioral researchers. Behavior Research Methods, 1–19.
Choi, I., Dalal, R., Kim-Prieto, C., & Park, H. (2003). Culture and judgment of causal relevance. Journal of Personality and Social Psychology, 84(1), 46–59.
Johnson, P. E., Jamal, K., & Berryman, R. G. (1991). Effects of framing on auditor decisions. Organizational Behavior and Human Decision Processes, 50(1), 75–105.
Kühberger, A. (1998). The influence of framing on risky decisions: A meta-analysis. Organizational Behavior and Human Decision Processes, 75(1), 23–55.
Kühberger, A., & Tanner, C. (2010). Risky choice framing: Task versions and a comparison of prospect theory and fuzzy-trace theory. Journal of Behavioral Decision Making, 23(3), 314–329.
Kuhn, K. M. (1997). Communicating uncertainty: Framing effects on responses to vague probabilities. Organizational Behavior and Human Decision Processes, 71(1), 55–83.
Levin, I. P. (1987). Associative effects of information framing. Bulletin of the Psychonomic Society, 25(2), 85–86.
Levin, I. P., & Gaeth, G. J. (1988). How consumers are affected by the framing of attribute information before and after consuming the product. Journal of Consumer Research, 15(3), 374–378.
Levin, I. P., Schneider, S. L., & Gaeth, G. J. (1998). All frames are not created equal: A typology and critical analysis of framing effects. Organizational Behavior and Human Decision Processes, 76(2), 149–188.
Mandel, D. R. (2001). Gain-loss framing and choice: Separating outcome formulations from descriptor formulations. Organizational Behavior and Human Decision Processes, 85(1), 56–76.
Mandel, D. R. (2005). Are risk assessments of a terrorist attack coherent? Journal of Experimental Psychology: Applied, 11(4), 277–288.
Mandel, D. R. (2008). Violations of coherence in subjective probability: A representational and assessment processes account. Cognition, 106(1), 130–156.
Mandel, D. R. (2014). Do framing effects reveal irrational choice? Journal of Experimental Psychology: General, 143(3), 1185–1198.
Marteau, T. M. (1989). Framing of information: Its influence upon decisions of doctors and patients. British Journal of Social Psychology, 28(1), 89–94.
McKenzie, C. R. M., & Nelson, J. D. (2003). What a speaker’s choice of frame reveals: Reference points, frame selection, and framing effects. Psychonomic Bulletin & Review, 10(3), 596–602.
Meyerowitz, B. E., & Chaiken, S. (1987). The effect of message framing on breast self-examination attitudes, intentions, and behavior. Journal of Personality and Social Psychology, 52(3), 500–510.
Moore, D. A., & Healy, P. J. (2008). The trouble with overconfidence. Psychological Review, 115(2), 502–517.
Murphy, A. H., & Winkler, R. L. (1977). Reliability of subjective probability forecasts of precipitation and temperature. Applied Statistics, 26, 41–47.
Oppenheimer, D. M., Meyvis, T., & Davidenko, N. (2009). Instructional manipulation checks: Detecting satisficing to increase statistical power. Journal of Experimental Social Psychology, 45(4), 867–872.
Paulhus, D. L. (1998). Interpersonal and intrapsychic adaptiveness of trait self-enhancement: A mixed blessing? Journal of Personality and Social Psychology, 74(5), 1197–1208.
Peters, E., Västfjäll, D., Slovic, P., Mertz, C. K., Mazzocco, K., & Dickert, S. (2006). Numeracy and decision making. Psychological Science, 17(5), 407–413.
Reyna, V. F., & Brainerd, C. J. (1991). Fuzzy-trace theory and framing effects in choice: Gist extraction, truncation, and conversion. Journal of Behavioral Decision Making, 4(4), 249–262.
Reyna, V. F., & Brainerd, C. J. (1995). Fuzzy-trace theory: An interim synthesis. Learning and Individual Differences, 7(1), 1–75.
Reyna, V. F., Nelson, W. L., Han, P. K., & Dieckmann, N. F. (2009). How numeracy influences risk comprehension and medical decision making. Psychological Bulletin, 135(6), 943–973.
Savage, L. J. (1971). Elicitation of personal probabilities and expectations. Journal of the American Statistical Association, 66(336), 783–801.
Shafir, E. (1995). Compatibility in cognition and decision. Psychology of Learning and Motivation, 32, 247–274.
Sher, S., & McKenzie, C. R. M. (2006). Information leakage from logically equivalent frames. Cognition, 101(3), 467–494.
Slovic, P., Griffin, D., & Tversky, A. (1990). Compatibility effects in judgment and choice. In Insights in decision making: A tribute to Hillel J. Einhorn (pp. 5–27). Chicago, IL: University of Chicago Press.
Svenson, O. (1981). Are we all less risky and more skillful than our fellow drivers? Acta Psychologica, 47(2), 143–148.
Teigen, K. H., & Brun, W. (1999). The directionality of verbal probability expressions: Effects on decisions, predictions, and probabilistic reasoning. Organizational Behavior and Human Decision Processes, 80(2), 155–190.
Teigen, K. H., & Nikolaisen, M. I. (2009). Incorrect estimates and false reports: How framing modifies truth. Thinking & Reasoning, 15(3), 268–293.
Tenney, E. R., Spellman, B. A., & MacCoun, R. J. (2008). The benefits of knowing what you know (and what you don’t): How calibration affects credibility. Journal of Experimental Social Psychology, 44(5), 1368–1375.
Thaler, R. H., & Sunstein, C. R. (2008). Nudge: Improving decisions about health, wealth, and happiness. New Haven, CT: Yale University Press.
Tversky, A., & Kahneman, D. (1981). The framing of decisions and the psychology of choice. Science, 211(4481), 453–458.
Tversky, A., Sattath, S., & Slovic, P. (1988). Contingent weighting in judgment and choice. Psychological Review, 95(3), 371–384.
Weller, J. A., Dieckmann, N. F., Tusler, M., Mertz, C. K., Burns, W. J., & Peters, E. (2013). Development and testing of an abbreviated numeracy scale: A Rasch analysis approach. Journal of Behavioral Decision Making, 26, 198–212.
Yaniv, I., & Schul, Y. (1997). Elimination and inclusion
procedures in judgment. Journal of Behavioral Decision Making, 10(3), 211–220.
Institute of Education, Beijing Institute of Technology, Beijing, China.
Email: saiwing.yeung@gmail.com
Part of this work was presented at the 35rd Annual Conference of the Cognitive
Science Society. This paper benefited from helpful discussions with Christopher G.
Lucas, Emily Jantz, Jianwei Zhang, Hongchuan Zhang, Yuxin Liu, members of the
Institute of Education at Beijing Institute Technology. I also thank Jonathan Baron,
David Mandel, and an anonymous reviewer for their comments. The author also would
like to acknowledge the assistance in data collection by Ya Liu, and translation by
Ya Liu and Jing Yu. This research was supported by the Basic Research Funds from the
Beijing Institute of Technology, National Natural Science Foundation of China
(program code: 71373020), Beijing Program of Philosophy and Social Science (program
code: 13JYB010), and the Learning Science and Educational Development Laboratory at
the Institute of Education, Beijing Institute of Technology.
The two-subcomponent condition does not
require one of the subcomponents to be an agent. It simply requires
the two subcomponents to be crossed in a mutually exclusive
fashion. I focus on predictions of the type agent × outcome
because these are the most commonly encountered. The findings can
readily be generalized to predictions without agents.
A
quantitative component is considered as binary-valued in the context
of this paper, as I am contrasting only its original value (p%)
and its numerical complement (1−p%).
There was no a priori reason to suspect that the subjects in
this experiment were different in any meaningful way from those in
the previous ones. Moreover, in all MTurk experiments in the
current paper, the attention check was the second question in the
entire experimental procedure, after only a question eliciting their
MTurk ID. Therefore up to the attention check, the experimental
procedures of all the MTurk experiments were essentially the
same. These observations suggest that the higher attention check
failure rate might be due to factors exogenous to the experimental
design.