Gender differences in the endowment effect: Women pay less, but won’t accept less
Alice Wieland*
James Sundali#
Markus Kemmelmeier#
Rakesh Sarin$
We explore different contexts and mechanisms that might promote or
alleviate the gender effect in risk aversion. Our main result is
that we do not find gender differences in risk aversion when the
choice is framed as a willingness-to-accept (WTA) task. When the
choice is framed as a willingness-to-pay (WTP) task, men are willing
to pay more and thus exhibit lower risk aversion. However, when the
choice is framed as a willingness to accept task, women will not
accept less than men. These findings imply gender differences in
the endowment effect. We also find that the effect size of the
gender difference in risk aversion is reduced or eliminated as the
context changes from tasks framed as gambles to other domains; and that attitudes toward gambling mediate the gender effect in gambling framed tasks.
It is well-accepted that women are more risk averse than men (Croson
& Gneezy, 2009; Eckel & Grossman, 2008). Yet, most of the research
suggesting this conclusion originates from the economic literature,
which normally uses known probability gambles to measure risk
aversion. For example, a common experimental task used to measure risk
aversion is asking a subject how much she is willing to pay (WTP)
for a 50/50 chance to win $100. Anyone indicating less than the
expected value of $50 (0.50*$100) for this gamble is considered risk
averse. The less a subject is willing to pay for the gamble, the
more risk averse the subject is assessed to be. Women normally
provide lower average valuations for gambles than men (Byrnes, Miller,
& Schafer, 1999; Croson & Gneezy, 2009; Eckel & Grossman, 2002,
2008; Schubert, Brown, Gysler & Brachinger, 1999), resulting in the
conclusion that women are generally more risk averse than
men. However, it should be noted that not all studies find a gender
difference in risk aversion (Carr & Steele, 2010; Demaree, DeDonno,
Burns, Feldman & Everhart, 2009; Fehr-Duda, De Gennaro & Schubert,
2006).
Additionally, even though the majority of published research on gender
and risk aversion does find statistically significant differences,
effect sizes necessary to determine if the difference is large enough
to be practically important (Hyde, 2005; Miller & Rodgers, 2008;
Nelson, 2012; Ziliak & McCloskey, 2004) are normally not reported.
The published research may also suffer from a false-positive bias
(Simmons, Nelson & Simonsohn, 2011; or “file drawer” problem as
described by Rosenthal, 1979), such that significant gender
differences are more likely to be published (Hyde, 2005). These
factors may lead to biased conclusions about the magnitude and
generality of gender effects.
We therefore sought to explore the gender difference in risk aversion:
What are its boundary conditions? What are the mechanisms driving it?
Is it a large effect worthy of policy interventions, or a minute effect
with little practical importance? This research explores these
questions.
1.1 Elicitation method: WTP vs. WTA
Most studies on gender and risk aversion utilize
gambling tasks, in which payment is required to play some gamble with a
known probability outcome. These tasks are termed “willingness to
pay” (WTP) tasks. However, risky decisions occur in a much broader set
of circumstances which are not framed as gambles and do not necessarily
require subjects to pay; rather, some decisions concerning risk involve
subjects being willing to accept (WTA) payment in exchange for
something risky, e.g., selling an inherited risky investment.
Economic theory suggests the gap between WTP and WTA should be small
or nonexistent (Willig, 1976, Haneman, 1991). Kahneman, Knetsch, and
Thaler (1990) showed that subjects are willing to pay a lot less
for a coffee mug (or to forego a gain in return for the mug) than they
would accept to sell the same mug. Knetsch and Sinden (1984) showed
similar results for a risky lottery ticket. Much subsequent research
has confirmed that required payments in WTA tasks tend to be
considerably higher than offered payments in WTP tasks (see Sayman &
Öncüler, 2005 for a meta-analysis).
Although there are competing hypotheses, the WTP/WTA discrepancy is
commonly interpreted as an ownership phenomenon termed the
endowment effect (Thaler, 1980). The endowment effect refers
to the well-established finding that individuals are willing to pay
less for something than the amount they require to sell the same item
if they own it. The endowment effect is thought to be due to loss
aversion: when we sell something it’s a loss of a possession (and a
gain of money), when we buy something it’s a gain of a new possession,
(and a loss of money). According to prospect theory, loss
aversion arises because losses hurt more than gains make us
happy. Thus sellers require higher compensation for losing the
possession than buyers are willing to pay for acquiring it.
Active risk-taking has been referred to as an “attribute of the
masculine psychology” (Wilson & Daly, 1985), and is suggested to be
a means for a man to gain positions of power. As such, men may be more
comfortable taking risks, as may be required in WTP tasks. Since no
strong theories suggest that protecting against losses would appeal
more to one gender than the other, we have no reason to expect gender
differences in WTA tasks. As such, we would expect a gender difference
in WTP tasks involving risk, but not necessarily in WTA tasks with
risk. Yet, an alternative expectation is that if women are truly more risk averse,
it follows that they would also require a smaller payments in WTA tasks to sell
a risky option.
A competing hypothesis to the endowment effect explaining WTP/WTA
differences argues that ownership of a good creates an association
between the item and the self and this link increases the value of the
good owned (Belk, 2010; Pierce, Kostova & Dirks, 2003). The stronger
the link between the self and the item, the more one would be willing
to pay or require to sell an item. A recent study (Dommer &
Swaminathan, 2013) of how gender and identity influences buying and
selling prices found that while both genders exhibited the endowment
effect, men were actually less susceptible to the effect in
conditions where the item was not congruent with their identity. Women
on the other hand, were equally susceptible to the effect in both the
identity congruent and incongruent conditions (Dommer & Swaminathan,
2013). However, buying gambles, and options with risk, versus buying
non-risky goods are very different contexts and may have differential
effects on men and women.
1.2 Domain: Gambling vs. non-gambling frames
As predicated by much prior research, we expect that the domain and frame of
the task affects risk aversion (Blais & Weber, 2006; Byrnes et
al., 1999; Powell & Ansic, 1997). A meta-analysis by Byrnes and
colleagues (1999) found that different contexts produced different
effect sizes in risk-taking behaviors between genders. Since
risk-taking varies by domain, it is probable that risk-aversion
also varies by domain (e.g., Weber, Blais & Betz, 2002). Thus, we explore the
domains that are more versus less likely to result in gender
differences in risk aversion.
1.3 Mechanisms
We hypothesize that women are more gambling averse than men are.
Research suggests that gambling has historically been considered a
male activity (McCormack, Shorter & Griffiths, 2014), and finds that
the majority of pathological gamblers are men (Gonzalez-Ortega,
Echeburua, Corral, Polo-Lopez & Alberich, 2013; Grant, Chamberlain,
Schreiber & Odlaug, 2012; Ibáñez, Blanco, Moreryra & Saiz-Ruiz,
2003; Wong, Zane, Saw & Chan, 2013). Additionally, research related
to gender stereotypes in gambling tasks indicates that women are stereotyped to be more
risk averse for these tasks (Eckel & Grossman, 2002, 2008). Even research related to
parental attitudes toward gambling found that fathers are more likely
to engage in gambling activities (betting on competitive sports) with
their sons (Shead, Derevensky & Meerkamper, 2011). To determine if
attitudes toward gambling account for the gender difference in risk
aversion we include various measures of this construct in all three
studies. We include the gambling sub-scale of the Domain-Specific
Risk-Taking Scales (DOSPERT: Weber et al., 2002). We also
include a 3-item measure specifically designed to measure attitudes
toward gambling in Study 3 (see Appendix A) which includes such items
as “I enjoy gambling” and “Gambling is fun”.
Additionally, the gender difference in risk aversion may arise from
women’s lower numeracy, or self-efficacy about simple math concepts
(e.g., Pajares & Miller, 1994). To determine if numeracy or math
self-efficacy is an explanatory factor in women’s risk aversion,
we included the Math Self-Efficacy Scale (Nielsen & Moore,
2003), in Studies 1 and 2.
In summary, we hypothesize that gender differences in risk aversion may
be affected by elicitation method (WTP vs. WTA) and the frame/context
of the experimental task (gambling vs. non-gambling). Additionally we
explore which mechanisms are implicated in these decisions.
1.4 Empirical tests
The following three experiments explore the gender difference in risk
aversion. Before commencing this set of studies we conducted a pilot
study consisting of 3 within-subject gambles with probabilities of
winning of 1/3, 1/2 and 2/3, replicating prior work related to
gender and risk aversion (Croson & Gneezy, 2009; Eckel & Grossman,
2002, 2008; Holt & Laury, 2002; Schubert et al., 1999) and confirmed
the appropriateness of a sample from Amazon Mechanical Turk (MTurk)
to study this phenomena. We found that men pay roughly twice as much
as women for risky options framed as gambles.1 Building on
this pilot study we sought to explore the boundary conditions of the
effect. Study 1 explores interventions designed to eliminate the
gender effect and tests for mediators. Study 2 clarifies the role of
potential moderators (value elicitation method and gambling vs.
non-gambling contexts) and tests mediation. Study 3 uses incentive
compatible payments and adds a non-risky option to the domains
examined.
2 Study 1: Effect sizes and domain tests
The pilot study confirmed that the effect size of the gender difference
in gambling framed WTP tasks is large to very large. Study 1 was
designed to determine if any of several theoretically motivated
interventions might be effective in reducing or eliminating the gender
effect noted in the pilot. We explored five between-groups conditions.
These included three conditions framed as gambles in a WTP format: one
control condition and two conditions designed to cue subjects to
provide a valuation closer to the expected value. One of these
conditions sought to prime subjects to think about the expected
value of the gamble over the long term, and thereby avoid myopic loss
aversion (Benartzi & Thaler, 1999; Venkatraman, Aloysius & Davis,
2006), and the other condition sought to avoid priming stereotype
threat for women by providing the gamble information pictorially
(Steele, 1997). We also included two conditions that changed the frame
from gambles to non-gambling contexts, with one of these scenarios
framed as WTP and the other framed as WTA. Additionally, we sought to
explore the mechanisms responsible for the gender effect. As noted
above, we hypothesized that attitudes toward gambling might mediate the
gender effect in gambling framed valuations, and tested whether women’s
lower math self-efficacy may be partly responsible for the gender
difference.
2.1 Method
Table 1: Study 1 Means, SD and Cohen’s d by gender and
condition.
Female
Male
M
(SD)
M
(SD)
F/t
d
Control 50/50 Gamble WTP
9.75
(9.85)
23.27
(16.26)
13.97***
.89
Expected value WTP
14.78
(14.23)
34.18
(27.42)
11.06**
.87
Picture Prime WTP
8.88
(9.94)
20.00
(17.59)
8.79**
.70
Restaurant WTP
16.88
(16.90)
24.71
(19.15)
2.76+
.43
Shoes WTA
47.52
(23.42)
48.76
(19.15)
.05
.06
***p<.001, **p<.01, *p<.05, +p<.10.
Three-hundred and thirty-five subjects (124 women, 211 men) were
recruited and paid through MTurk, and the study was administered
online. After consenting to participate in the research, subjects
were randomly assigned to one of the five conditions. Condition 1 was
a control condition which replicated the 50/50 gamble in our pilot
study. Condition 2 was an Expected Value Condition, which we
anticipated would prime subjects with the expected value of the
gamble and thereby encourage both men and women to value the gamble
closer to its expected value ($50). This condition reframed the
perception of the expected outcome from a one-time event to a repeated
event in order to encourage an expected value computation (Benartzi &
Thaler, 1999; Venkatraman et al., 2006). We framed this condition as
follows: “If you were to play this gamble 100 times, what
would your average (per play) payoff be?” For Condition 3 in
addition to the 50/50 gamble wording from the control condition we
also showed a picture of what the distribution of balls in the bag
looked like. The large literature on stereotype threat suggests that
math is a domain in which many women experience threat (Carr &
Steele, 2010; Martens, Johns, Greenberg & Schimel, 2006; Spencer,
Steele & Quinn, 1999; Steele, 1998; Steele & Aronson, 1995). We
presented the information visually to avoid arousing stereotype threat
which could occur when only presenting the data in numerical form.
Conditions 4 and 5 were designed to test whether the gender difference
in risk aversion held for non-gambling decisions, so we changed the
context to non-gambling contexts. Condition 4 reframed the
decision to have the same expected value but for a restaurant gift
card instead of cash. This condition was framed as,
“Imagine you are waiting for a table at your favorite
restaurant with your significant other on a Saturday evening. To
entertain the waiting guests on this busy evening management is
auctioning off some tickets at the bar. Each ticket provides a 50%
chance of winning $100 gift card for the restaurant that can be
used anytime, and a 50% chance of receiving nothing. Management has
assured the guests that all the proceeds will be donated to local
charities. What is the most you will pay
for a ticket?” Condition 5 framed the risky choice as a decision
related to a store credit, but in a willingness to accept (WTA)
frame instead of the willingness to pay (WTP) frame that was used for
Conditions 1–4. This condition was framed as follows: Imagine
you are about to buy a $100 pair of shoes. You get the checkout
counter and the cashier informs you that you are the lucky 100th
shopper of the day and then hands you a scratch off ticket. The
cashier tells you that it is equally likely (a 50% chance of each)
that the ticket will say: ”You will receive $100 off your purchase”,
or, ”Thanks for being our 100th customer today, we appreciate your
business”. The customer behinds you says, “Wow, I wish I had that
scratch off ticket. How much would you be willing to sell me the
scratch off ticket for?”
In all conditions the expected value of the risky option is
consistent: a 50% probability of winning $100 (cash or value). This
design allowed us to explore whether some conditions/contexts mitigate the
gender effect.
After subjects responded to the above randomly assigned condition,
they responded to the questions designed to test mediation. Specifically,
we created a composite measure of 4-items to test gambling attitudes. Two items
were used from the DOSPERT Gambling subscale(Weber et al., 2002),
(likelihood of ‘Betting a day’s income at the horse races’ and ‘Betting a day’s income
at a high-stake poker game’) and the two additional items included to specifically
measure gambling attitudes “I enjoy gambling
because I have the chance to multiply my money” and “I
believe gambling is a waste of money because the odds are against me
for most games” (reverse scored). To test whether women’s math
self-efficacy mediated the gender effect we included the Math
Self-Efficacy Scale (Nielsen & Moore, 2003), and a self-report measure of math competence. After subjects
responded to the above measures, they were asked to provide some
demographic information, thanked and provided a code for MTurk
payment.
2.2 Results and discussion
Table 1 shows the means, standard deviations and effect sizes by
gender and condition. ANOVA showed significant effects for condition,
F(4, 324) = 33.06, p < .001,
ηp2 = .29, and gender,
F(1, 324) = 26.21, p < .001,
ηp2 = .08, while the
interaction is almost significant, F(4, 324) = 2.02,
p = .092, ηp2 =
.024. To test for gender differences within conditions we use a series
of simple effects tests. There was a significant difference in the WTP
tasks between genders in Conditions 1, 2 and 3 and the effect size is
large: men provided valuations which are about twice the amount of
women’s valuations in the gambling conditions. Interventions designed
to improve calibration (Conditions 2 and 3) did not substantively
reduce the gender effect but did increase valuations for both genders
in Condition 2 (Expected Value). A smaller gender difference,
approaching statistical significance, was found for Condition 4
(Restaurant) (Mmen = $24.71 vs.
Mwomen = $16.88; p =
.095). However, in Conditions 5 (Shoes) men and women provided
essentially identical valuations (Mmen =
$48.76 vs. Mwomen = $47.52; p =
.80), and the effect size is zero. The average valuation of $48.36
in Condition 5 (Shoes) is quite close to the risk neutral value of
$50, suggesting that both genders are much less risk averse when the
risky option is owned and they are in a position to sell it, perhaps
implicating the endowment effect (Kahneman et al., 1990; Thaler,
1980).2
Table 1 illustrates the systematic decline of the gender difference
in valuations across conditions. As the task moves from gamble
valuations to non-gambling contexts and finally, to a decision in a
willingness to accept (WTA) frame, both the significance and the effect
size of the gender difference diminishes until it disappears. These
results suggest that the gender difference in risk aversion is robust
in gambling framed decisions, but less so in other contexts.
We examined whether attitudes toward gambling and math self-efficacy
mediated the gender difference in risk aversion observed in the gambling
frames. We found support that the composite measure of gambling attitudes
did, in fact, mediate the gender difference in risk aversion in gambling
framed decisions. In other words, women’s less favorable attitudes toward
gambling are driving the gender effect in all the conditions framed as gambles.
However, we did not find any support to suggest that numeracy, or math self-efficacy was related to the gender effect in risk aversion. Please see
Appendix A for a full discussion on the mediation analysis.
3 Study 2: Moderator testing: Elicitation method or decision domain
Table 2: Study 2 means, SD and Cohen’s d by gender and
condition.
Female
Male
M
(SD)
M
(SD)
F/t
d
Gamble WTP
10.67
(13.47)
24.22
(22.69)
13.88***
.73
Shoes Discount WTP
6.26
(13.38)
12.03
(15.19)
4.21*
.40
Gamble WTA
40.15
(22.84)
41.09
(18.87)
.06
.04
Shoes Discount WTA
50.34
(26.72)
46.50
(21.89)
.68
.16
***p<.001, *p<.05.
Study 1 presented evidence that the gender effect may be
due to the decision domain, gambles vs. non-gamble contexts, or could
possibly be due to the value elicitation method used (WTP or WTA).
Study 2 was designed to identify whether the gender difference in risk
aversion arises from either or both of these factors. Therefore, the
study design was 2 (elicitation method: WTP vs. WTA) x 2 (decision
domain: gamble vs. shoe discount) x 2 (gender) factorial design.
Following Study 1, we hypothesized that the gender difference would
arise in gambling framed decisions, and not in non-gambling contexts.
Our expectations regarding the elicitation method differential were
less clear because, in spite of the immense amount of research on the
endowment effect (Kahneman et al., 1990), only one study we came across
noted a gender difference, in which women named larger sums
in general regardless of whether they were buyers or sellers (Dommer &
Swaminathan, 2013). That noted, the results of Study 1 indicate that the
gender effect in the WTA (Shoes) condition was not even close to
significance. Therefore, Study 2 explores whether men and women respond
differently depending on the elicitation method employed.
3.1 Method
Four hundred and fifty-four (180 women, 274 men) were recruited and
paid via MTurk, and the study was administered online. All subjects
are included in the analysis. Using a 2 (elicitation method) x 2
(decision domain) x 2 (gender) factorial design, subjects were
randomly assigned to one of the four following conditions: (1) the
control condition, the 50-50 bag of balls gamble (50% chance to win
$100) used in Studies 1 and 2 with the WTP elicitation method,
(What is the most you would pay for this gamble?);
(2) the same 50-50 bag of balls gamble with a WTA elicitation method
(Imagine someone wanted to buy this opportunity from you. What
is the minimum amount you would accept to sell
this gamble?); (3) the shoe buying scenario used in Study 1, with
the WTP elicitation method (What is the most you’d be
willing to pay for the scratch off ticket?); and, (4) the shoe
buying scenario with the WTA elicitation method (What is theminimumamount you’d be willing to sell the
scratch off ticket to the customer behind you for?).
After providing their valuation, subjects completed the gambling subscale
of the DOSPERT (Weber et al., 2002), and answered demographic questions.
The items in the DOSPERT Gambling Subscale ask the likelihood of: Betting a day’s income at the horse races, Betting a day’s income at a
high-stake poker game, and Betting a day’s income on the outcome
of a sporting event. Subjects were then thanked and provided a code for MTurk.
3.2 Results
Table 2 shows the mean valuation responses in each experimental
condition by gender. A three-factorial ANOVA revealed a main effect for
gender, F(1, 451) = 4.61, p = .032,
ηp2 = .01, indicating that,
overall, women reported lower monetary values than men
(MWomen= 25.88, SD = 27.16
vs. MMen = 31.66, SD =
23.92). Consistent with the endowment effect, there was main effect for
elicitation method, F(1, 451) = 266.58, p<
.001, ηp2 = .38; subjects
indicated lower values in WTP conditions versus WTA conditions
(MWTP = 14.20, SD = 18.38
vs. MWTA= 43.57,
SD = 20.42, respectively). This effect was qualified by
domain, F(1, 451) = 17.73, p< .001,
ηp2 = .04; subjects were
willing to pay less for the shoe discount than the gamble
(MShoes = 9.57, SD = 14.67
vs. MGamble = 18.50, SD =
20.40), pairwise p< .001, yet required more to
sell the shoe discount than the gamble
(MShoes = 48.04, SD = 23.90
vs. MGamble = 40.77, SD =
20.22), pairwise p = .01.
Importantly, gender interacted with elicitation method, F(1,
451) = 8.44, p< .01,
ηp2 = .02. In WTP conditions,
women offered significantly less money than men
(MWomen = 8.54, SD = 13.54
vs. MMen = 18.36, SD =
20.32), pairwise p< .001. However, in WTA
conditions, this effect disappeared
(MWomen = 45.49, SD = 25.33
vs. MMen= 43.57, SD =
20.42), pairwise p = .53. Neither the Gender by Domain
interaction, F(1, 451) = 2.67, p = .10,
ηp2 = .01, nor the three-way
interaction, F < 1, were
significant.3
We hypothesized that again we would find a gender difference in gambling
domains due to women’s less favorable attitudes toward gambling, and we
wanted to further explore whether gender differences in numeracy might
also be partly responsible for the gender effect in WTP conditions.
As in Study 1, we found that Math Self-Efficacy did not mediate the gender
effect, but the 3-item DOSPERT gambling subscale did mediate the
effect. See Appendix A for detailed results of the mediation
analysis.
4 Study 3: Elicitation method or decision domain with incentive
payment
Study 2 presented evidence that the gender effect may be due to the
elicitation method, WTA vs. WTP, while Study 1 suggested that domain of
the decision may also matter. Study 3 was designed to replicate the
effects of Study 2 with a larger sample size to determine whether the
evidence in Study 2 was obtained by chance or if the effect was valid
(Simonsohn, 2013). In addition, since Study 1 implied that decision
frame matters to the WTP valuations, we sought to change the framing to
a different type of gamble from the bag of balls, and include a similar
risky task framed as a promotion for a Visa Gift card instead of framed
as a gamble. Finally, to explore whether the gender difference noted in
risk aversion in WTP conditions extended to non-risk domains (women may
just be more conservative with all their purchases), we included a
condition that provided subjects the opportunity to buy or sell a $100 Macy’s Gift
Card. Therefore, the experimental design was a 2 (elicitation method:
WTP vs. WTA) x 3 (decision domain: gamble, Visa Card, or Macy’s Card) x
2 (gender) factorial design. Following Study 2, we hypothesized that
the gender difference would arise in WTP gambling framed decisions, and
would not arise in any WTA framed decisions. However, we were less sure
whether the gender difference would arise in WTP tasks not framed as
gambles; Study 2 implied it might. All subjects in this study
received incentive compatible payment based on their answers and
valuations made during the study. Additionally, we also included a
purely attitudinal measure of gambling dispositions to test for
mediation with a measure theoretically distinct from the DOSPERT.
4.1 Method
Subjects.
Four hundred and forty-seven (183 women, 264
men) subjects were recruited and paid via Mturk, and the study was
administered online. In this study an attention check question was
included. Subjects were told how they would be incentivized during the
study, and the starting bonus amount (before bet payments were
deducted and the outcomes of gambles owned were played) was explained
to subjects. On the next page, subjects were then asked to confirm what
their starting bonus payment was ($0.75). If
subjects answered this question incorrectly they were excluded from
the analysis for not paying attention. Forty-three subjects were
excluded for answering the attention check question incorrectly. The
responses of 8 subjects came from repeat IP addresses. We coded the
second responses from the same IP address as repeats, and 4 additional
responses were excluded. Finally, one residual value for the WTP value
was more than 3 SD from the mean and was coded as an outlier and
excluded from the analysis. The final sample included 399 subjects
(155 women, 244 men). As an alternative, less restrictive analysis, we
confirmed the results in the larger dataset only excluding two subjects:
these cases had not only the same IP address but also the same age and sex.
Design.
This was a within-subjects design with subjects
first randomly assigned to 1 of 6 cells in the 2 (WTP vs. WTA)
x 3 (Gamble, Visa Card, Macy’s Card) design. After their first
decision/valuation they received a second valuation task such that if
they had seen a WTP question first, their second would be WTA and vice
versa; and if they had seen a Gamble first, their second could be the
Visa or the Macy’s Card; such that subjects would have responses in
two, non-overlapping cells of the design. All subjects received
both a WTP and WTA valuation task (but the order in which these were
shown was random), and subjects responded to 2 of the 3 domains
(Gamble, Visa or Macy’s Card). In addition, the mediator questions
were randomly presented either before subjects were asked to respond to the
dependent variables or after they had already responded to these items.
After subjects consented to be part of the study, they received the
following information explaining how they would earn the incentive
compatible payment: To incentivize you, we are providing you an
additional 75 cents that can be used to purchase promotions with. In
the context of this survey, each cent is worth $1 (i.e. your $0.75 is
equivalent to $75 in the context of the offers/promotions.) There may
be gains or losses based on the decisions you make about the
promotions; these will be added or subtracted from your bonus payment
of $0.75 (again each $1 is worth $0.01 in bonus payment, so if you
win $100 in this survey, you’ll receive $1 in actual bonus payment).
On the very next page, subjects were asked the attention check
question of how much their starting bonus was. After completing the
attention check, subjects were randomly presented either the two WTA/WTP
tasks followed by the mediator measures, or the mediator measures followed
by the dependent variables (WTA/WTP tasks). The measure of gambling
dispositions/attitudes in this study was composed of the following 3-items:
“I enjoy gambling”, “When gambling I have the real chance to
multiply my money”, and “Gambling is fun”. Finally,
subjects provided demographic information such as sex, age and
education, their Mturk Worker ID, then were thanked for their participation and
provided a code for MTurk.
Dependent Measures.
We told subjects that “We
are preparing a tourism study for Northern Nevada to determine the best
kind of promotions that are attractive to tourists, yet reasonably
priced for the local establishments. We will present you with some
promotions and ask you to state how much each is worth to you.” As
such, each of the dependent measures was phrased to reflect this
context, and subjects could pay up to $75 for each of the WTP
conditions and request up to $100 to sell their promotion in each of
the WTA conditions. The specific wording of the dependent measures is
described in Appendix B.
4.2 Results
Since this study was a within-subjects design, with each subject
responding to two of the six possible conditions, we included two
additional factors in our initial model: The order in which the
subject viewed the tasks, and the order in which the mediator
variables were presented to subjects (presented first half the time). Because each subject was
assigned two tasks, one WTP and one WTA, in two domains, we modeled
subject as a random factor in a mixed-effects model, though responses
from the same subject were not similar (intraclass correlation
r = −.03).
An initial 2 (Gender) x 2 (Elicitation) x 3 (Domain) x 2 (Position) x 2
(Mediator Order) analysis revealed that Mediator Order was involved in
two four-way interactions, though it never qualified the predicted Gender
x Elicitation interaction, all p>
.18.4
Because this variable did not moderate critical results, mediator
order was removed from the model.
The resulting four-way mixed factorial model did show a main
effect for elicitation, F(1, 379.4) = 135.13, p< .001. The sum that subjects were willing to accept in
exchange for their asset was consistently higher
(MWTA= 36.63) than what they were
willing to offer (MWTp = 21.00), thus
replicating the endowment effect (Kahneman et al., 1990). However, a
position main effect, F(1, 379.4) = 4.53, p = .034,
and especially a Position x Elicitation interaction, F(1,
384.7) = 5.50, p = .02, indicated that the endowment effect
was larger on the first task (MWTA =
37.12 vs. MWTP = 17.66), p< .001, than the second task
(MWTA = 36.15 vs.
MWTP = 24.36), p<
.001.
Table 3: Study 3 means, SD and Cohen’s d by gender and
condition.
Female
Male
M
(SD)
M
(SD)
F/t
d
1st position
Gamble WTP
8.64
(8.67)
15.85
(11.24)
8.48**
.72
Gamble WTA
21.18
(19.75)
18.05
(16.22)
0.46
−.17
Visa Card WTP
11.81
(13.09)
14.63
(12.94)
0.71
.22
Visa Card WTA
32.23
(20.74)
28.11
(20.20)
0.71
−.20
Macy’s Card WTP
24.15
(18.02)
30.80
(23.46)
1.49
.32
Macy’s Card WTA
63.60
(22.68)
59.64
(23.01)
0.43
−.17
2nd position
Gamble WTP
17.08
(15.40)
18.12
(13.69)
0.08
.07
Gamble WTA
23.44
(19.65)
23.28
(16.89)
0.001
−.01
Visa Card WTP
21.23
(17.41)
19.76
(15.71)
0.12
−.09
Visa Card WTA
25.86
(22.70)
35.95
(27.76)
2.54
.40
Macy’s Card WTP
33.05
(28.12)
37.38
(22.78)
0.48
.17
Macy’s Card WTA
50.10
(29.58)
58.03
(31.12)
1.14
.26
**p < .01. Significance test for pairwise comparisons were computed
using one-way ANOVA while controlling for the effect of position (first
vs. second task).
A pronounced Domain x Elicitation interaction, F(1, 692.26) =
16.03, p< .001, showed that the endowment effect
was weaker for gambles (MWTP = 15.11
vs. MWTA = 21.56), p = .013,
than for the VISA card (MWTP = 17.47
vs. MWTA = 30.40), p< .001, and the Macy’s card
(MWTP = 30.44 vs.
MWTA = 57.94), p<
.001. Not surprisingly, a Domain main effect, F(2, 546.06) =
123.26, p< .001, confirmed that larger amounts were
paid and demanded for non-risky (Macy’s card) as opposed to
risky (Gamble, VISA card) items.
There was no Gender x Elicitation interaction nor was there a Domain x Gender x Elicitation effect, both F< 1, even though the
anticipated gender differences for WTP Gambles was reliable when
subjects responded to this task first, p< .01
(Table 3). However, there was significant Gender x Elicitation x Position
interaction, F(1, 384.7) = 4.71, p = .031. For the
task that subjects worked on first, there was a gender difference for
WTP, such that women made lower offers compared to their male
counterparts (MWomen = 14.85 vs.
MMen = 20.47), p = .058.
Yet, there was no gender difference in regards to willing to accept
(Mwomen = 39.03 vs.
Mmen = 35.22), p =
.21. When subjects worked on the WTP task as the second task, there
was no gender difference (Mwomen =
23.74 vs. Mmen = 24.94), p
= .68, but when the WTA task was second, women were willing to accept
lower sums of money compared to men (M =
33.14Women vs.
MMen = 39.15), p = .04. We
caution the reader against assigning much significance to the latter
effect. Recall that there were order effects in the data that anchored
responses after the first task, such that it is not surprising to see
the initial effect replicated on the second valuation task.
Because of the interaction of Position with the main variables of
interest, we examined these variables for the first position only,
thus treating the experiment as a complete between-subject design (and
using standard models that did not treat subject as a random
effect). An initial model included Gender, Elicitation, Domain, the
interaction of Gender and Domain, and the interaction of Gender and
Elicitation. All main effects and interactions were significant at
p < .05. In particular, the predicted Gender x Elicitation
interaction was significant at p = .007; for the larger
sample with only two exclusions, p = .043.5
5 General discussion
Quite a bit of research has indicated that women are more risk averse
than men (e.g., Byrnes et al., 1999; Carr &
Steele, 2010; Croson & Gneezy, 2009; Dwyer, Gilkeson & List, 2002;
Eriksson & Simpson, 2010; Finger & Weber, 2011; Harris, Jenkins &
Glaser, 2006). General acceptance of this conclusion may be
potentially problematic because it becomes part of gender discussions
on topics such as competitiveness, management style, labor markets and
investment success (Booth & Nolen, 2012; Eckel & Grossman, 2008;
Kahan, Braman, Gastil, Slovic & Mertz, 2007; Kristof, 2009; Wieland
& Sarin, 2012). We set out to explore this effect and identify
mechanisms, effect sizes and boundary conditions. We found that the
Cohen’s d statistic is large to very large in gambles framed as WTP,
declines in WTP tasks not framed as gambles and is essentially zero in
tasks framed as WTA. This interesting result gives rise to a gender
difference in the endowment effect, due to women’s WTP amounts being
less than men’s (overall) but the same as men’s in WTA amounts. We
include 3 studies in this manuscript and find gender differences only
in WTP frames, but never in WTA frames, regardless of whether the task
is risky or not. We do note that when the task is framed as WTP risky
gambles, we always find a gender effect, consistent with current
research in this area (Byrnes et al., 1999; Croson & Gneezy, 2009;
Eriksson & Simpson, 2010); however, we do not always show this gender
difference in risk aversion in other decisions with risk that are not
framed as gambles. This may be a result of inadequate power in our
samples to detect small effects. However, the conclusion remains that
the largest effect sizes of the gender difference in risk aversion
are found in WTP Gambling type tasks.
We also set out to explore the mechanisms of the gender effect in risk
aversion when found. We hypothesized that due to societal gender norms
women are more gambling averse than men, and that perhaps gender
differences in math self-efficacy could be driving the gender difference
in risk aversion. In all 3 studies, with gambling attitudes measured
in 3 different ways (Study 1 used a composite of DOSPERT Gambling
Items with two attitudinal measures, Study 2 used the DOSPERT
Gambling subscale, and Study 3 used a 3-item attitudinal measure
which was randomly assigned to be presented before the dependent
variable for half the sample), we find that attitudes toward gambling,
which women score significantly lower on, mediate the gender
difference in risk aversion in WTP gambles. Objective probability
gambles have become the standard for measuring and quantifying risk
attitudes (Holt & Laury, 2002); however, due to underlying attitudes
toward gambling, this is the domain where gender differences are most
likely to be detected. As such, gambling framed decisions should be
used with caution when building general theories or conclusions about
gender differences in risk aversion. We also measured subjective
numeracy skills in Studies 1 and 2 with the Math Self-Efficacy scale
(Nielsen & Moore, 2003), and found no support for mediation in either
study, although women did score significantly lower than men on the
scale. Complete details of the mediation analyses are presented in
Appendix A.
What is most interesting in this research is the gender difference in
the endowment effect. In our review of the published literature, we
only found one study related to how gender identity issues relate to
the endowment effect (Dommer & Swaminathan, 2013).6 Our research is not qualified by issues of gender
identity: because that was not the focus of this research, we
did not even measure it. In each study conducted we noticed a gender
difference in the endowment effect, and were surprised at the lack of
published research noting it. However, these studies were designed to
explore the gender effect in risk aversion. Therefore, out of the 15
total conditions contained in this manuscript, only two were not related
to making a decision under risk (WTA and WTP for the Macy’s Card in Study 3). Since
the three-way interaction including Domain of the task was not significant
for Study 3, we have no evidence to suggest that the gender difference
in the endowment effect is limited to items with risk. However, since
our studies were designed to investigate risk aversion, future
research could replicate the effect with more non-risky items. The
pairwise comparisons in our one condition without risk (Macy’s Gift
Card) indicated no gender differences in WTP or WTA; however, our
power may not be adequate to detect a small effect, and when
considering the full dataset, the three-way interaction with Domain x Gender
x Elicitation is not significant.
We can only speculate why there is a gender difference in the
endowment effect. If it is being driven by women being more risk
averse than men, they would also sell risky options for lower prices
than men would. Yet, in none of the WTA experimental conditions were
women willing to accept less than men to sell the item/option. It is
possible that due to differences in the utility of money, women may be
revealing greater risk aversion only in situations where they would be
required to actually pay for a risky option. Additionally, as
suggested already, men may be more comfortable with taking risks to
gain positions of power due to gender norms and stereotypes, but when
it comes to protecting what one possess, no strong prescriptive gender
norms exist.
Summarizing, our results indicate that women may sometimes be more risk averse
when acquiring a risky assets, but are not any more willing than
men to trade away risk once its theirs for low offers (those much lower than the expected value).
Although simple, we believe this is a novel finding which
may have implications for many different types of outcomes. For
example, and certainly extrapolating, the results suggest women may be
less inclined to spend money on any good in which the utility is
uncertain (and therefore appear more frugal than men), while they
would not be willing to sell something with an uncertain utility for
any lower amount. Additionally, there may be implications for women’s
acceptance of risky professional positions as well as business
ventures; women may appear less willing to enter these tournaments,
but should not have differential dropout rates. Although some research
suggests that women anticipate more pain in a potential loss situation
(Croson & Gneezy, 2009), and this anticipatory emotion partially
mediates the gender difference in risk aversion (Eriksson & Simpson,
2010), there have not yet been any mechanisms suggested as to why the
effect would disappear in WTA situations. Certainly, more research
will be required to determine the mechanisms of the why women might
behave differently in WTA situations, and what the broader
implications may be.
Benartzi, S., & Thaler, R. H. (1999). Risk aversion or myopia? Choices
in repeated gambles and retirement investments. Management
Science, 45(3), 364–381.
Blais, A. R., & Weber, E. U. (2006). A domain-specific risk-taking
(dospert) scale for adult populations. Judgment and Decision
Making Journal, 1(1), 33–47.
Croson, R., & Gneezy, U. (2009). Gender differences in preferences.
Journal of Economic Literature, 47(2),
448–474. http://dx.doi.org/10.1257/jel.47.2.448.
Demaree, H. A., DeDonno, M. A., Burns, K. J., Feldman, P., & Everhart,
D. E. (2009). Trait dominance predicts risk-taking. Personality
and Individual Differences, 47(5), 419–422. http://dx.doi.org/10.1016/j.paid.2009.04.013.
Dommer, S. L., & Swaminathan, V. (2013). Explaining the endowment
effect through ownership: The role of identity, gender, and
self-threat. Journal of Consumer Research, 39(5), 1034–1050.
http://dx.doi.org/ 10.1086/666737.
Dwyer, P. D., Gilkeson, J. H., & List, J. A. (2002). Gender differences
in revealed risk taking: Evidence from mutual fund investors.
Economics Letters, 76(2), 151–158.
Eckel, C. C., & Grossman, P. J. (2002). Sex differences and statistical
stereotyping in attitudes toward financial risk. Evolution and
Human Behavior, 23(4), 281–295.
Eckel, C. C., & Grossman, P. J. (2008). Forecasting risk attitudes: An
experimental study using actual and forecast gamble choices.
Journal of Economic Behavior & Organization, 68(1), 1–17.
http://dx.doi.org/ DOI 10.1016/j.jebo.2008.04.006.
Eriksson, K., & Simpson, B. (2010). Emotional reactions to losing
explain gender differences in entering a risky lottery.
Judgment and Decision Making, 5(3), 159–163.
Finger, B., & Weber, E. U. (2011). Who takes risks when and why? :
Determinants of risk taking. Current Directions in
Psychological Science, 20(211), 211–216.
Gonzalez-Ortega, I., Echeburua, E., Corral, P., Polo-Lopez, R., &
Alberich, S. (2013). Predictors of pathological gambling severity
taking gender differences into account. European Addiction
Research, 19(3), 146–154. http://dx.doi.org/ 10.1159/000342311.
Grant, J. E., Chamberlain, S. R., Schreiber, L. R. N., & Odlaug, B. L.
(2012). Gender-related clinical and neurocognitive differences in
individuals seeking treatment for pathological gambling.
Journal of Psychiatric Research, 46(9),
1206–1211. http://dx.doi.org/10.1016/j.jpsychires.2012.05.013.
Harris, C. R., Jenkins, M., & Glaser, D. (2006). Gender differences in
risk assessment: Why do women take fewer risks than men? Judgment and
Decision Making, 1, 48–63.
Hayes, A. F. (2013). Introduction to mediation, moderation, and
conditional process analysis: A regression-based approach. New York:
Guilford.
Holt, C. A., & Laury, S. K. (2002). Risk aversion and incentive
effects. American Economic Review, 92(5), 1644–1655.
Ibáñez, A., Blanco, C., Moreryra, P., & Saiz-Ruiz, J. (2003). Gender
differences in pathological gambling. Journal of Clinical
Psychiatry, 64(3), 295–301.
Kahan, D. M., Braman, D., Gastil, J., Slovic, P., & Mertz, C. K.
(2007). Culture and identity-protective cognition: Explaining the
white-male effect in risk perception. Journal of Empirical
Legal Studies, 4(3), 465–505. http://dx.doi.org/ 10.1111/j.1740-1461.2007.00097.x.
Kahneman, D., Knetsch, J. L., & Thaler, R. H. (1990). Experimental
tests of the endowment effect and the coase theorem. Journal of
Political Economy, 98(6), 1325–1348.
Kristof, N. D. (2009, 12/31/2008). Mistresses of the universe,
The New York Times.
Martens, A., Johns, M., Greenberg, J., & Schimel, J. (2006). Combating
stereotype threat: The effect of self-affirmation on women’s
intellectual performance. Journal of Experimental Social
Psychology, 42(2), 236–243.
McCormack, A., Shorter, G. W., & Griffiths, M. D. (2014). An empirical
study of gender differences in online gambling. Journal of
Gambling Studies, 30(1), 71–88. http://dx.doi.org/ 10.1007/s10899-012-9341-x.
Miller, J. E., & Rodgers, Y. V. (2008). Economic importance and
statistical significance: Guidelines for communicating empirical
research. Feminist Economics, 14(2),
117–149. http://dx.doi.org/10.1080/13545700701881096.
Nelson, J. A. (2012). Are women really more risk-averse than
men? Global Development and Environment Institute. Working Paper.
Tuffs University.
Nielsen, I. L., & Moore, K. A. (2003). Psychometric data on the
mathematics self-efficacy scale. Educational and Psychological
Measurement, 63(1), 128–138. http://dx.doi.org/ 10.1177/0013164402239321.
Pajares, F., & Miller, M. D. (1994). Role of self-efficacy and
self-concept beliefs in mathematical problem solving: A path analysis.
Journal of Educational Psychology, 86(2),
193–203. http://dx.doi.org/10.1037/0022-0663.86.2.193.
Pierce, J. L., Kostova, T., & Dirks, K. T. (2003). The state of
psychological ownership: Integrating and extending a century of
research. Review of General Psychology, 7(1),
84–107. http://dx.doi.org/10.1037/1089-2680.7.1.84.
Schubert, R., Brown, M., Gysler, M., & Brachinger, H. W. (1999).
Financial decision-making: Are women really more risk-averse?
American Economic Review, 89(2), 381–385.
Shead, N. W., Derevensky, J. L., & Meerkamper, E. (2011). Your mother
should know: A comparison of maternal and paternal attitudes and
behaviors related to gambling among their adolescent children.
International Journal of Mental Health and Addiction, 9(3),
264-275. http://dx.doi.org/ 10.1007/s11469-010-9279-0.
Simmons, J. P., Nelson, L. D., & Simonsohn, U. (2011). False-positive
psychology: Undisclosed flexibility in data collection and analysis
allows presenting anything as significant. Psychological
Science, 22(11), 1359–1366. http://dx.doi.org/ Doi 10.1177/0956797611417632.
Spencer, S. J., Steele, C. M., & Quinn, D. M. (1999). Stereotype threat
and women’s math performance. Journal of Experimental Social
Psychology, 35(1), 4–28.
Steele, C. M. (1997). A threat in the air: How stereotypes shape
intellectual identity and performance. American Psychologist,
52(6), 613–629.
Steele, C. M. (1998). Stereotyping and its threat are real.
American Psychologist, 53(6), 680–681.
Steele, C. M., & Aronson, J. (1995). Stereotype threat and the
intellectual test-performance of african-americans. Journal of
Personality and Social Psychology, 69(5), 797–811.
Thaler, R. (1980). Toward a positive theory of consumer choice.
Journal of Economic Behavior & Organization, 1(1), 39–60.
Venkatraman, S., Aloysius, J. A., & Davis, F. D. (2006). Multiple
prospect framing and decision behavior: The mediational roles of
perceived riskiness and perceived ambiguity. Organizational
Behavior and Human Decision Processes, 101(1),
59–73. http://dx.doi.org/10.1016/j.obhdp.2006.04.006.
Weber, E. U., Blais, A. R., & Betz, N. E. (2002). A domain-specific
risk-attitude scale: Measuring risk perceptions and risk behaviors.
Journal of Behavioral Decision Making, 15(4),
263–290. http://dx.doi.org/Doi 10.1002/Bdm.414.
Wieland, A., & Sarin, R. (2012). Domain specificity of sex differences
in competition. Journal of Economic Behavior & Organization,
83(1), 151–157. http://dx.doi.org/ 10.1016/j.jebo.2011.06.019.
Wilson, M., & Daly, M. (1985). Comptitiveness, risk-taking and
violence: The young male syndrome. Ethology and Sociobiology,
6(1), 59–73.
Wong, G., Zane, N., Saw, A., & Chan, A. K. K. (2013). Examining gender
differences for gambling engagement and gambling problems among
emerging adults. Journal of Gambling Studies, 29(2), 171–189.
http://dx.doi.org/ 10.1007/s10899-012-9305-1.
Ziliak, S. T., & McCloskey, D. N. (2004). Size matters: The standard
error of regressions in the american economic review. The
Journal of Socio-Economics(33), 527–546.
Appendix A: Mediation results
We measured attitudes toward gambling in all studies in this
manuscript. Following are the results of the mediation analyses by
study.
Study 1: Mediation of gender effect
To test the hypotheses that attitudes toward gambling mediate the gender
difference, we created a summary measure of gambling attitudes
of four items, Cronbach’s α = .78, from two of the DOSPERT
Gambling Items (Weber et al., 2002), (likelihood of Betting a
day’s income at the horse races and Betting a day’s income at
a high-stake poker game) and the two additional items included to
specifically measure gambling attitudes (“I enjoy gambling
because I have the chance to multiply my money” and “I
believe gambling is a waste of money because the odds are against me
for most games” (reverse scored)). See Table A1 for the
correlations of this variable with the dependent variable of valuation.
As noted earlier, we also included the Math Self-Efficacy Scale (Nielsen
& Moore, 2003), and subjects’ self-ratings of competence related to
math. Including all potential mediators enables us to provide some
evidence, either for or against, hypothesized mediators that may be of
value to future researchers on the topic (or at least provide relevant
CI’s that may be used in meta-analysis).
Table A1: Correlations of 4-item measure of gambling attitudes and
dependent variable.
Women
Men
Control 50/50 Gamble WTP
.60**
.36*
Expected value WTP
.37
.05
Picture Prime WTP
-.08
.35*
Restaurant WTP
.32
.13
Shoes WTA
.02
.06
**p<.01, *p<.05.
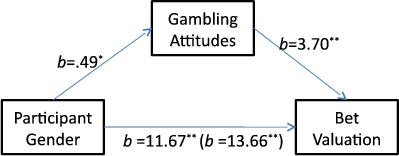
Figure 1: Mediation of gambling attitudes, Study 1. Results of
gender difference in risk aversion for Study 2: total effects of
gender on valuation b = 13.66 (p < .01); direct effect b = 11.67 (p <
.01); indirect effect through mediator b = 1.80 (p < .01).
Since we were interested only in what was driving the gender difference
in the experimental conditions which involved a gambling frame, only
Conditions 1, 2 and 3 were selected and a multiple linear regression
was performed to determine if experimental condition was a significant
predictor. Because condition was not a significant predictor, data were
collapsed across conditions. In accordance with Hayes (2013), all
potential mediators were investigated using a multiple mediation model
(Model 6) for the PROCESS macros in SPSS, requesting 10,000 iterations
for bootstrap confidence intervals. The results indicated that of the
hypothesized mediators, the only statistically significant partial
mediator of the gender effect on risk aversion was the subjects’
attitudes toward gambling, b = 1.80, se = 0.84, 95%
CI [0.45, 3.77]; p< .001 (Figure 1). Although women
did report significantly lower math self-efficacy
(Mwomen= 3.20 vs. Mmen
= 3.64, p <.001), and lower competence at
subjects that utilize math skills
(Mwomen = 3.27 vs.
Mmen = 3.63, p <.01)
neither of these measures were drivers of greater risk aversion in this
sample, CI’s [−0.35, 2.97] and [−0.43, 1.18], respectively. Since these
two measures are correlated (r = .66, p <
.01) the above analysis was executed using each independently, but the
results were essentially the same. Therefore, we conclude that these variables were not
significantly related to the amount subjects were willing to pay for the gamble.
Study 2: Mediation of gender effect
To investigate the mediators in Study 2 we again created
correlations of the main mediator variable with the outcome variable
(See Table A2). In this study we included both the DOSPERT Gambling subscale (Weber et al., 2002),
and the Math Self-Efficacy Scale as potential mediators. We
conducted the mediation analysis in two parts, again using the PROCESS
macro (Hayes, 2013) with 10,000 bootstrapped confidence interval
iterations. Using Hayes’s (2013) Model 4 and focusing only on the Gamble condition
we entered both the 3-item Gambling subscale and the Math Self-Efficacy scales as
potential mediators. Results indicated that while the DOSPERT Gambling subscale had a
robust indirect effect b = 1.66, se = 1.06, 95% CI [.18, 4.63], the Math
Self-Efficacy Scale did not b = .31, se = .53, 95%
CI [−.42, 1.87]. These results replicate those of Study 1: we find evidence that
a different measure of gambling attitudes also mediates the gender effect, but no support
for self-reported numeracy acting as a mediator. We therefore opted not to measure
Math Self-Efficacy (self-reported numeracy) in the last study.
Table A2: Correlations of DOSPERT 3-item gambling subscale and dependent
variable.
Women
Men
Gamble WTP
.47**
.15
Gamble WTA
.18
.26*
Shoes WTP
-.09
.20
Shoes WTA
-.08
.00
***p<.001, **p<.01, *p<.05, +p<.10.
Study 3: Mediation of gender effect
For Study 3, in response to reviewer feedback, we created a 3-item
attitudinal measure of gambling dispositions and counterbalanced the
presentation of the measure so that it was presented before the
experimental tasks for half of subjects, and after the
experimental tasks the other half. The 3-item measure included the
following items, and had good reliability (Cronbach’s α = .83):
“I enjoy gambling”, “When gambling I have the real chance to multiply
my money”, and “Gambling is fun”. As in the prior studies we created a
table of correlations between this measure of gambling attitudes and
the dependent variable (See Table A3).
Table A3: Correlations of 3-item measure of gambling dispositions and
dependent variable.
Women
Men
Gamble WTP
.28*
.41**
Gamble WTA
.03
.16
Visa Card WTP
.19
.10
Visa Card WTA
-.20
-.05
Macy’s Card WTP
.23
.07
Macy’s Card WTA
-.11
-.10
**p<.01, *p<.05.
We again sought to explore if this new measure, also mediated the
gender difference noted in gambling tasks. To do this, we selected to
include both conditions with risk, the gamble and the Visa Card. This
allowed for the results to be presented in a 2(Elicitation) X 2
(Domain) table because the factors are treated by the program as
dichotomous. We used PROCESS (Hayes, 2013), Model 19, again requesting
10,000 bootstrap itterations (Valuation as the Outcome, Subject Sex
as the Independent, Gambling Dispositions as the Mediator, Eliciation
and Domain as the Moderators, and Mediator Order and Position as
covariates). See Table A4 for the results of the mediation analysis by
condition. As shown in Table A4, the only confidence
interval that does not include 0 is that for Gambles in a WTP frame,
indicating that this new measure of gambling dispositions/attitudes
only mediates the gender effect in risk aversion in tasks
framed as WTP gambles.
Table A4: Mediation of gender effect by gambling disposition
measure.
b
s.e.
95% C.I.
Gamble WTP
.93
.48
[.20, 2.16]
Gamble WTA
.36
.34
[−.07, 1.35]
Visa Card WTP
.26
.35
[−.23, 1.26]
Visa Card WTA
-.48
.55
[−2.06, 0.28]
Appendix B: Study 3 conditions
The final study contained in this article contained incentive
compatible scenarios administered on MTurk. Below is the specific
wording used for these conditions.
All subjects were told:
We are preparing a tourism study for Northern Nevada to
determine the best kind of promotions that are attractive to tourists,
yet reasonably priced for the local establishments. We will present you
with some promotions and ask you to state how much each is worth to
you.
Then subjects were randomly assigned to two of the following
conditions:
Gamble WTP
We have several large Casino Hotels here in Northern Nevada. One of
these hotels is considering offering guests the following promotion
upon checking into the hotel:
A gamble with a 50% chance of winning $100, and a 50% chance of
winning $0.
What is the most you’d be willing to pay for the gamble?
Your answer will be randomly matched with another MTurker who has the
opportunity to sell this gamble. If they are willing to sell the gamble
at a price equal to or less than what you’re willing to pay for it, you
will have bought the gamble and the amount you bid will be deducted
from your bonus payment. The gamble will then be played and you will
receive the outcome of $0 or $100. (If they are unwilling to sell at
the price you offer, no transaction will occur and you will not pay for
or play the gamble.) Please note the maximum you can bid on this gamble
is $75 since this is the amount of bonus payment you have been given.
Gamble WTA
We have several large Casino Hotels here in Northern Nevada. One of
these hotels is considering giving guests the following promotion upon
checking into the hotel:
A gamble with a 50% chance of winning $100, and a 50% chance of
winning $0.
What is the least you’d be willing to sell the gamble to
another MTurker for?
Your answer will be randomly matched with another MTurker who has the
opportunity to buy this gamble. If they are willing to buy the gamble
at a price equal to or greater than what you’re willing to sell it for,
the amount they are willing to pay will be added to your bonus payment,
and they will play the gamble instead of you. (If they are unwilling to
purchase it at a price you’d accept, no transaction will occur and you will
play this gamble with an outcome of $0 or $100.)
Visa WTP
We have several large hotels here by Lake Tahoe. One of these hotels is
considering offering guests the following promotion upon checking into
the hotel:
A promotion that provides a 50% chance of winning $100 Visa Prepaid
Gift Card, and a 50% chance of winning nothing. The gift card can be
used at almost all restaurants, hotels and retailers in the Reno/Tahoe
area.
What is the most you’d be willing to pay to have this
promotion?
Your answer will be randomly matched with another MTurker who has the
opportunity to sell you the promotion. If they are willing to sell the
promotion at a price equal to or less than what you’re willing to pay
for it, the amount you bid will be deducted from your bonus payment and
the promotion opportunity will transfer to you. We will bonus whoever
has rights to this promotion it’s value when we pay bonuses. (If they
are unwilling to sell at the price you offer, no transaction will occur
and you will not get the promotion.) Please note the maximum you can
bid on this promotion is $75 since this is the amount of bonus payment
you have been given.
Visa WTA
We have several large hotels here by Lake Tahoe. One of these hotels is
considering giving guests the following promotion upon checking into
the hotel:
A promotion with a 50% chance of winning $100 Visa Prepaid Gift Card,
and a 50% chance of winning nothing. The gift card can be used at
almost all restaurants, hotels and retailers in the Reno/Tahoe area.
If another MTurker was willing to purchase this promotion from you, what
would be the least you’d be willing to sell it for?
Your answer will be randomly matched with another MTurker who has the
opportunity to buy this promotion. If they are willing to buy the
promotion at a price equal to or greater than what you’re willing to
sell it for, the amount they are willing to pay will be added to your
bonus payment, and they will receive the promotion instead of you. We
will bonus whoever has rights to this promotion it’s value when we pay
bonuses. (If they are unwilling to purchase it at a price you’d accept,
no transaction will occur and you will keep this promotion.)
Macy’s WTP
We’re thinking of selling $100 Macy’s Gift Cards when people arrive
into the local airport, bus terminal or check into their hotels.
What is the most you’d be willing to pay for $100 Macy’s Gift
Card?
Your answer will be randomly matched with another MTurker who has the
opportunity to sell this Macy’s Card. If you are willing to buy it at a
price equal to or greater than what they’re willing to sell it for, the
rights to this Gift Card will go to you, and the cost for it will be
deducted from your bonus payment. At the end of the experiment, we’ll
randomly choose 10% of respondents that have rights to the gift cards
to receive actual $10 Macy’s Gift Cards). Please note the maximum you
can bid on the Macy’s Card is $75 since this is the amount of bonus
payment you have been given.
Macy’s WTA
We’re thinking giving visitors a $100 Macy’s Gift Card when people
arrive into the local airport, bus terminal or check into their
hotels.
What is the least you’d be willing to sell the $100 Macy’s
Gift Card to another MTurk participant for?
Your answer will be randomly matched with another MTurker who has the
opportunity to buy this Macy’s Card. If you are willing to sell it at a
price equal to or less than what they’re willing to pay for it, the
rights to this Gift Card will go to them, and the price they are
willing to pay will be added to your bonus payment. At the end of the
experiment, we’ll randomly choose 10% of respondents that have rights
to the gift cards to receive actual $10 Macy’s Gift Cards.
The authors thank the two anonymous reviewers for
their helpful comments and suggestions. We also thank the
researchers that responded to our post on the Society of Judgment
and Decision Making for the information shared. Finally, we
are very grateful to Jon Baron for going over and above his
responsibilities as an editor and being supportive and encouraging
throughout the editorial process.
We noted a main
effect for gender, F(1, 104) = 25.90, p
< .001, ηp2 =
.20, with men willing to pay about twice as much for each
gamble. The gender difference was significant for all gamble
probability levels (33%: MP 1/3Women =
10.6, MP 1/3Men = 20.6; F(1,
104) = 15.22, p < .001, d =
.77; 50%: MP 1/2Women = 15.8,
MP 1/2Men = 29.7; F(1, 104)
= 18.98, p < .001, d = .85;
66%; MP 2/3Women = 21.4,
MP 2/3Men = 43.8; F(1, 104) =
31.95, p < .001, d = 1.11). Cohen’s
d indicated that the effect size was large to very large
for all gambles. A gender by condition interaction indicated that
the gender effect increases as the probability of winning the gamble
increases, F(2, 208) = 16.49, p < .001,
ηp2 = .14.
Although the standard deviations varied substantially
across the different cells of the design of Study 2, Levene’s
F(9, 324) = 5.68, p < .001, re-analysis
of pairwise comparisons using Welch’s F test confirmed the
above results without exception. An alternative analysis, in which
four outliers with standardized residuals greater than 3 were
removed (3 from the Expected Value condition, and 1 from the
Restaurant condition) also confirmed the above pattern, except that
the sex difference for Restaurant WTP became significant, F = 5.40,
p = .023, d = .64.
Since the large differences in variance between
cells violated ANOVA’s assumption of variance homogeneity (Levene’s
F(7, 452) = 6.38, p < .001), we repeated
the analysis with a generalized linear model using a 2 (elicitation
method) x 2 (domain) x 2 (gender) factorial design and an ordinal
link function (e.g., Cohen, Cohen, West & Aiken, 2003; Fox,
2008). This type of model assumes ordinal measurement level on the
part of the dependent variable, but does not make any assumptions
about the homogeneity of variances across conditions. Results
consistently corroborate the above findings. Critically, the gender
by elicitation method interaction was reliable, Wald
χ2(df = 1) = 16.09, p
< .001, resulting in a gender difference in WTP
conditions, p < .001, but not in WTA conditions,
p = .53.
Arguably,
the use of the first position only is post hoc and should be
corrected for multiple tests, in which case the p-value would
double. However, the hypothesis should also be considered
one-tailed, given that our purpose was to attempt to replicate the
result of Study 2, which would divide it by two, putting it back at
.043. We also noticed that women were significantly older in the
larger sample (means of 35.2 and 32.7 for women and men
respectively, t = 2.41, p = .016), and Age
interacted with Elicitation in a way that opposed the effect of
Sex. After adding the Age x Elicitation interaction to the model with
the larger sample, the Age x Elicitation interaction was significant
at p = .010, and the Gender x Elicitation interaction was
significant at p = .018.
Many
researchers have studied WTA and WTP in samples with both genders. We
were initially suspicious of our results concerning gender differences
in the endowment effect because nobody seems to have reported such
results before, despite having relevant data. We requested such data
on a mailing list and did receive one response with relevant
data. Barbara Mellers (personal communication, 2014) had data from a
study of participants in the California lottery, none of whom were
winners. A survey presented 14 hypothetical gambles varying in
stakes and probability of winning. She reported that “women showed
greater endowment effects than men in a study of participants who
served as controls and were later compared to winners of the CA
lottery …. These effects occurred with both smaller stakes
($100) and larger stakes ($25k).” Women had both lower buying
prices and higher selling prices for most gambles. This sample is
quite different from our Mturk sample and thus suggests that our
result is at least not a function of some idiosyncrasy of Mturk
workers.