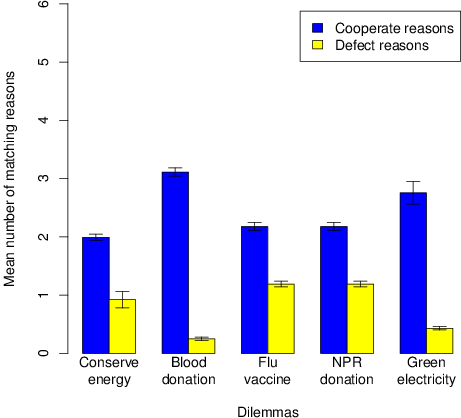
| Figure 1: Mean number of closed-ended reasons endorsed as “close match” for cooperation and defection. Error bars are ± 1 standard error of the mean. |
Judgment and Decision Making, Vol. 9, No. 4, July 2014, pp. 316-334
Reasons for cooperation and defection in real-world social dilemmasShahzeen Z. Attari* David H. Krantz# Elke U. Weber# $ |
Interventions to increase cooperation in social dilemmas depend on understanding decision makers’ motivations for cooperation or defection. We examined these in five real-world social dilemmas: situations where private interests are at odds with collective ones. An online survey (N = 929) asked respondents whether or not they cooperated in each social dilemma and then elicited both open-ended reports of reasons for their choices and endorsements of a provided list of reasons. The dilemmas chosen were ones that permit individual action rather than voting or advocacy: (1) conserving energy, (2) donating blood, (3) getting a flu vaccination, (4) donating to National Public Radio (NPR), and (5) buying green electricity. Self-reported cooperation is weakly but positively correlated across these dilemmas. Cooperation in each dilemma correlates fairly strongly with self-reported altruism and with punitive attitudes toward defectors. Some strong domain-specific behaviors and beliefs also correlate with cooperation. The strongest example is frequency of listening to NPR, which predicts donation. Socio-demographic variables relate only weakly to cooperation. Respondents who self-report cooperation usually cite social reasons (including reciprocity) for their choice. Defectors often give self-interest reasons but there are also some domain-specific reasons—some report that they are not eligible to donate blood; some cannot buy green electricity because they do not pay their own electric bills. Cooperators generally report that several of the provided reasons match their actual reasons fairly well, but most defectors endorse none or at most one of the provided reasons for defection. In particular, defectors often view cooperation as costly but do not endorse free riding as a reason for defection. We tentatively conclude that cooperation in these settings is based mostly on pro-social norms and defection on a mixture of self-interest and the possibly motivated perception that situational circumstances prevent cooperation in the given situation.
Keywords: social dilemmas, cooperation, social norms, self-interest.
Many situations confront people with tradeoffs between advantages for themselves versus advantages for others. Often these situations are structured such that, if many or most decision makers pursue advantages for themselves, most end up worse than if many or most had sacrificed some self-advantage to contribute toward benefits for others. Such situations, where private interests are at odds with collective interests, are called social dilemmas (Dawes, 1980; Kollock, 1998). In the United States, donation to National Public Radio (NPR) is a paradigmatic example. The broadcasts are a “public good”—one can listen without ever donating—but are supported in substantial part by listener donations to local NPR stations. If many or most listeners chose to donate little or nothing, allocating the money instead to personal needs or other causes, then NPR programming would decline and listeners would lose something they value (Weber & Murnighan, 2008).
Table 1: Five social dilemmas, with estimated percentage of cooperative choice.
Cooperative choice Conserve energy Donate blood Get flu vaccination Donate to NPR Buy green electricity
To simplify language, we use the term cooperation for choices in social-dilemma situations that lean strongly toward contribution toward benefits for others and use defection for contrary choices. Conditions that favor cooperation have been much studied, both in communities (Ostrom, 1990) and in laboratory settings (Fehr & Gachter, 2002; Weber & Murnighan, 2008). The present research used an Internet survey to examine commonalities and differences in cooperation across several different social-dilemma situations. In particular, we ask whether cooperation is at all correlated across real-world social dilemmas and also whether the reasons that people give for cooperation or defection are at all consistent across dilemmas.
There are often strong social norms that favor cooperation, yet people also often defect. There are several paths to defection. Benefits to others from the so-called cooperative choice may be hidden or disbelieved. For example, getting a flu vaccine is a social dilemma because vaccinated individuals cannot transmit the flu to others even though non-vaccinated individuals could do so even if asymptomatic (Hershey, Asch, Thumasathit, Meszaros, & Waters, 1994). Yet vaccination may be thought to benefit the recipient primarily, rather than vulnerable others and thus many people may not view getting a flu vaccination as a social dilemma (Chapman & Coups, 1999). Similarly, energy conservation reduces one’s own energy bills (regardless of any effect on CO2 emissions). Even if benefits to others are recognized, one may not wish to bear the costs. One may feel no obligation to help others or may believe that enough others will help, or that only those who might benefit should help. Finally, one may believe that benefits are attainable only via large-scale cooperation, and that this is unlikely, so personal sacrifices will be in vain.
Despite the fact that both cooperation and defection are commonplace, the factors underlying these choices, for a given dilemma and across dilemmas are understood only poorly. For example, 40–45% of the people in the U.S. claim to have given blood, but only 4-6% do so in any given year (Lee, Piliavin, & Call, 1999). What factors underlie the choices that generate such a pattern?
For each tested dilemma, our survey first asked participants to report cooperation or defection, then asked for their reasons (open-ended). The survey then probed self-reported defectors for that dilemma with a closed-ended list of six possible reasons for defection and cooperators with a complementary list of reasons favoring cooperation. The closed-ended list was formulated in terms of the different paths to defection mentioned above, and their contraries. We present these six reasons below. Additional questions asked about attitudes, beliefs, or other behaviors that we hypothesized might be related to the given dilemma.
Many social dilemmas require binding group decisions to promote cooperation. Examples include tax support for public schools, recycling programs paid for by local taxes, and prices imposed for smoking or for CO2 emissions. Because political leadership and ideology are often crucial in such cases, our present research focused on five familiar settings where cooperation is largely personal and voluntary and norms for cooperation are an emergent phenomenon. These five dilemmas are shown in Table 1, along with the self-reported cooperation estimates from our survey. These dilemmas differ among themselves on many dimensions, including whether they are commonly viewed as social dilemmas. Of course, percent cooperation (column 2) depends crucially on the detailed wording and grouping of response alternatives, which varied as seemed appropriate for each social dilemma.1
Table 2: Generic closed-ended reasons provided to participants in the cooperation branch and the defection branch for NPR.
Reasons Rationality Altruism Drop in bucket Sucker Free riding Reciprocity
We hoped to determine the extent to which each situation is in fact perceived as a social dilemma, the extent to which cooperation is a general trait or is related to situation-specific social norms, and the extent to which cooperation or defection in each situation is related to the six generic reasons that we probed. The reasons elicited by the open-ended questions and those endorsed in the closed-ended responses may be partial reconstructions of true goals, active at real-life decision points, or in some cases may be merely acceptable post-hoc justifications for behavior (Ericsson & Simon, 1980; Nisbett & Wilson, 1977). Interpretations are based on converging evidence and of course are far from certain.
For organizations that wish to promote cooperative behavior in particular settings (e.g., the American Red Cross or NPR) it is important to understand whether a particular action is perceived as possibly benefiting others and the extent to which reasons for and against that behavior are general (e.g., altruism) or specific to each setting or situational context. It would also be interesting to compare how closely the open-ended responses for defection match the given organization’s tailored interventions to facilitate cooperation. Of course our study does not fully inform the design of interventions, but the results shed light on perceived barriers for cooperation in each dilemma.
We recruited 1050 participants in June 2011 via Amazon’s Mechanical Turk. This article is based on results from the 929 participants who completed the entire survey. Each received a $10 gift certificate on completion. The participants’ mean age was 29.7 years; 46.7% were male; 46.3% percent had a college degree; and only about 5% reported family incomes over $140,000 per year. The participants were thus younger and better educated than a representative U.S. sample (U.S. Census Bureau, 2011). About half self-identified as politically liberal, with the others split about equally between moderate and conservative.
The survey provided question blocks regarding each of the five social dilemmas. These five question blocks were presented in different random order for each subject. As an example, in the NPR donation block, NPR was first briefly described using the following text:
“National Public Radio’ (NPR) is a non-profit media organization that provides free public radio broadcasts to listeners around the United States. NPR radio stations are primarily supported by listener donations.”
This was followed by a question asking participants if they had ever donated to NPR (with a dichotomous Yes/No response option). Participants who said yes were branched to the cooperation arm of the NPR questions, where they were asked first to provide their main reasons for donation to NPR. If they reported never donating to NPR, they were branched to the defection arm and asked to provide their main reasons for not donating.
After entering their open-ended reasons for cooperating or defecting, the participants then rated how closely each of six generic reasons matched their own reasons for donating (or not donating) to NPR. The generic reason wording in the cooperation and defection branches for NPR is shown in Table 2; the wording for both branches for all five dilemmas is given in the Appendix. Note that each arm provided parallel but opposite reasons (i.e., the reasons in cooperation arm are contraries of the reasons provided in the defection arm). Each reason was rated on a three-point scale: “close match”, “somewhat match”, or “does not match”. The six generic reasons were presented for rating simultaneously but in random top-to-bottom order for each participant and dilemma.
The six reasons were chosen and labeled primarily to explore possible paths to defection that the authors had encountered frequently in conversations about social dilemmas. The labels were not shown to survey participants and do not necessarily reflect the perceptions of these reasons by participants. In particular, “sucker” and “free riding” involve opposite assumptions about an assumed descriptive norm. For “sucker”, the assumed norm is that most people defect (only suckers cooperate). This is encountered as a reason for defection, often coupled with “drop in the bucket”. For those who are willing to go contrary to the presumed norm, it can be a reason for cooperation. For “free riding”, the assumed norm is that most cooperate. This also serves as a reason for defection (everyone else cooperates so they don’t need me). Contrariwise, conformity to the assumed norm can be a reason for cooperation.
Following the endorsements of any or all of the above reasons for their choice, participants were asked questions about how willing they would be to penalize others who listen to NPR but did not contribute and how angry they would be if they donated and others did not. These questions were included to gauge whether punishment (or punitive attitude) is an important characteristic for cooperation in social dilemmas, as implied by the existence of a social norm for cooperation (Bicchieri, 2005). These questions concluded the NPR block of the survey. Participants completed a similar block of questions for each of the five social dilemmas.
After their responses to all five social dilemmas, participants completed the Self Reported Altruism (SRA) scale (Rushton, Chrisjohn, & Fekken, 1981), questions about their perceptions of social norms related to each of the five social dilemmas, and finally a few socio-demographic questions.
The complete survey is presented in the supplement.
Self-reports of cooperation ranged from 8% (buying green electricity) to 92% (conserving energy) as shown in Table 1. The 10 pairwise correlations of cooperation for the five dilemmas are all positive but low. Below, we also present a brief multivariate analysis of the five-way table based on cooperate/defect dichotomies.
We analyzed the correlates of cooperation for each of the five dilemmas, using multiple logistic regression. Four types of variables were considered in these analyses: the demographic variables;2 a general attitudinal variable (self-reported altruism [SRA]); domain-specific attitudes and beliefs (specified below for each dilemma), and for three dilemmas, self-reports of related behavior (frequency of listening to NPR, using green electricity in the home, or whether or not one had received a blood transfusion). The regression results will be presented in detail, but can be summarized briefly in the following overview.
For each dilemma, one or more demographic variables have statistically significant associations with cooperation, but all the effect sizes are small. SRA is strongly associated with cooperation in each dilemma. The major variables associated with cooperation are domain-specific attitudes, beliefs, and related behaviors. Despite this domain specificity, some unity can be discerned. There seems to be a strong pro-social norm associated with cooperation in each dilemma, although it emerges from responses that are specialized for the given domain.
We next analyze the open-ended reasons given for cooperation or defection. These reasons reinforce the finding of the regression analyses that social/moral norms underlie cooperation, while defection is tied to self-interest.
Finally, we briefly analyze the endorsement of closed-ended reasons for cooperation or defection. Surprisingly, cooperators endorse many closed-ended reasons, while defectors endorse few, and seem not to recognize the relationship between self-interest and free riding.
Pairwise correlations for reported cooperation in different dilemmas were low but positive (estimated Cronbach α = 0.26). There was a small but statistically reliable bunching of participants at both ends of the 0–5 count of cooperation reports: of 929 participants, 76 cooperated on four dilemmas and 10 on all five (compared with expected frequencies only 51.6 and 2.8, respectively, under independence). Similarly, 23 defected on all five dilemmas and 224 on four of five (respective expectations under independence would be only 14.6 and 200.2). Despite the low estimate of α, the 0–5 count correlated +0.39 with SRA. We return to this correlation below, when discussing the effect of measures of attitude and belief.
The logistic regression results for each dilemma are summarized by a sequential analysis of deviance, in which the 10 demographic variables are placed first, the SRA variable next, then some domain-specific attitudes and beliefs, and finally, the domain-related behavior (if any). To illustrate and explain this analysis strategy we use the example of donation to NPR. Here, the situation specific attitudes and beliefs consisted of two variables: percentage of listeners who should donate to NPR and punitive attitudes (described in detail below).
Table 3: Sequential analysis of deviance: logistic regression for NPR donation
df 10 51.9 1 29.9 2 44.3 1 260.7 914 447.6
Table 3 displays the sequential analysis-of-deviance for NPR donation using the above four groups of variables.
To understand these results, note first that all the deviance reductions are statistically significant. The 1% level of significance (assuming a χ2 distribution for deviance reduction under the null hypothesis) is attained for a deviance reduction of 6.64, 9.21, 13.3, 11.3, and 23.2, for 1, 2, 3, 4 and 10 df respectively. (We report magnitude of successive deviance reductions, which serves as an index of the size of the effects.)
Because of correlations among the explanatory variables, any variable or group of variables turns out to produce a larger deviance reduction if placed earlier in the analysis. Thus, the preceding analysis shows a huge deviance reduction for the domain-relevant behavior, listening to NPR, even after accounting for the effects of demographic and attitude/belief variables first. The situation-specific attitudes and beliefs produce a much smaller but still very substantial deviance reduction after accounting for demographics and SRA, while SRA produces a substantial reduction after accounting for demographics. This same order of sequential analysis is used for each dilemma, because it accounts for as much as possible using a common set of variables (demographics and SRA) before introducing dilemma-specific variables. The latter remain very important even when tested on the background of other variables.
The same 10 demographic variables were included in the logistic regression analysis for each dilemma. In each case, 0–3 of the 10 variables show at least marginal statistical significance; yet none is related to more than one of the five dilemmas. For NPR, participants who are older, for whom English is their first language, and who have lived in the U.S. for many years are more likely to donate (see Appendix). The individual regression coefficients for demographic variables can scarcely be viewed as reliable: statistical significance is marginal in most cases (see Appendix) and there is multicollinearity among the explanatory variables. Yet, overall, demographic variables do show some effects, and collectively would remain statistically significant at the 5% level or beyond (with 10 df) even if the group of variables were inserted last into the sequential analysis.
We could not perform a similar fully uniform analysis across all 5 dilemmas for the domain-specific attitudes, beliefs, and behaviors, because our questionnaire design was not sufficiently exhaustive with respect to beliefs and behaviors. For each dilemma, we probed punitive attitudes toward defection through four items: willingness to punish, willingness to punish at a cost to oneself, anger at defectors, and anger at self if one cooperated and most others defected (this last was reverse-coded). These four items were averaged to form an index of punitive attitude; this index was one of the explanatory variables included under domain-specific attitudes and beliefs. However we lacked the foresight to probe situation-specific beliefs similarly for each social dilemma. For NPR, we asked only for the percentage of people who should donate. By contrast, for blood donation we used three items: percentage who should donate, percentage that do donate, and effectiveness of blood donation. Thus, the group of variables for domain-specific attitudes and beliefs consisted of only two variables for NPR but four variables for blood donation. Other dilemmas were related to two or three domain-specific beliefs. Details are discussed in connection with the sequential analysis of deviance for each dilemma below.
Note that the mean percentage that people believed should donate ranged from 53% for NPR, to 64% for blood donations, and 83% for people who should buy energy efficient technology. In contrast, people believe that the actual descriptive norm is far less (in the two cases that we checked), the mean believed percentage that currently do buy efficient technologies was 33% and the mean believed percentage that currently do donate blood was 30%.
We probed situation-related behavior for only three of the five dilemmas: frequency of listening to NPR, having ever received a blood transfusion, and use of alternative energy (such as solar panels or micro wind turbines) in one’s home (this last is related to buying green electricity).
The situation-related behavior of listening to NPR is particularly powerful and interesting in its effect. The “listeners should donate” question yielded rather high rates of affirmation. Among donors, 86% respond at 50% or higher, while in the much larger group of non-donors, 69% nonetheless give such answers. Political attitudes seemed to have no effect: 77 out of 106 (73%) non-donors who rated themselves as Conservative or Extremely Conservative give answers of 50% or higher. This item thus seems to express a prevalent injunctive moral norm: “If you listen, you should probably donate.” Since this norm is expressed even more strongly among donors than non-donors, this attitude is one of the explanatory variables for donation. We view this as a reciprocity norm and return to it in our analysis of the open-ended reasons for cooperation.
If people apply the reciprocity norm to themselves, one would expect donation rate to increase as a function of how often the respondent reports listening to NPR. Indeed, reported donation rate increases from about 2% among those who seldom or never listen, to 20% or 25% among monthly listeners, to about 50% among weekly listeners, and about 70% among those who listen more often than weekly. Thus, frequency of listening to NPR has a very strong positive association with donation to NPR.
The above analysis of NPR donation illustrates a general finding across all five dilemmas and dictates a general strategy for explanatory models for cooperation. We fitted analogous models for the other four dilemmas, always including all 10 demographic variables, SRA score, situation-specific Punitive Attitude, and one or more other situation-specific attitudes, beliefs, or behaviors. Demographic variables are sometimes statistically significant in isolation, and some remain so in combination with other types of variables, but are never found to be strongly explanatory. The SRA score correlates positively with cooperation in every dilemma, no matter what else is included in the model, but is also never strongly explanatory. The variables most strongly explanatory are situation specific: punitive attitudes toward defectors, specific beliefs (e.g., that flu shots are or are not highly effective), and dilemma-related behaviors, such as listening to NPR, when available.
Table 4: Sequential analysis of deviance: logistic regression for blood donation.
df 10 43.5 1 97.0 4 49.6 1 1.5 913 1094.6
The model includes all 10 demographic variables, SRA, two situation-specific attitudes variables (Punitive Attitude and the percentage who should donate blood), two belief variables (the percentage of Americans who do donate in any given year and how effective blood donations are), and a behavioral marker, whether the respondent has ever received a blood transfusion. We thought that having received a blood transfusion might be analogous to listening often to NPR, i.e., it would induce a reciprocity goal: having received, one should give. Table 4 shows the sequential analysis. In this case, the behavioral variable has negligible effect; surprisingly (to us), it correlated strongly with SRA. The high deviance reduction for SRA is partly due to the fact that the SRA scale includes a blood donation item. If that item is excluded, the deviance reduction falls to 47.8 and the deviance reductions attributed to situation-specific attitudes, and having received blood increase a bit (but remains non-significant). Respondents who reported having had a transfusion show considerably higher mean SRA than others (6.9 ± 1.7 points, which is over ½ a standard deviation on the SRA scale; this difference is reduced only slightly when the blood donation item is excluded). The two belief variables correlated strongly with blood donation, as does the attitudinal norm (% who should donate). Again, Punitive Attitude, though included in the model, had a coefficient of only +0.13 ± 0.14.
Among the 10 demographic variables, male and highly educated participants are more likely to donate blood.
Table 5: Sequential analysis of deviance: logistic regression for flu vaccination.
df 10 31.1 1 16.0 4 426.3 914 810.5
The model again included the 10 demographic variables, SRA, and four situation-specific attitudes or beliefs. We did not ask a behavioral question relevant to a reciprocity norm—most people probably cannot guess whether they have benefited in the past from others’ flu vaccinations. Table 5 shows the results.
In this dilemma, the situation-specific attitudes included two similar questions about norms for flu shots: What percentage of people should be vaccinated, and how many groups of people should be vaccinated (0–5, ranging from no one, children, people 50 years of age or older, pregnant mothers, healthy adults, and everyone). Even though these are highly correlated (+0.72), their effects on the outcome of getting vaccinated are sharply separable (logistic coefficients are +0.023 ± 0.004 and +0.47 ± 0.08 respectively). Here, Punitive Attitude was also a strong correlate (+1.18 ± 0.17). Belief about the effectiveness of flu vaccination, which is correlated with the normative and punitive attitudes, also showed an almost-significant effect. Surprisingly, participants who had children were less likely to get a flu vaccine, and those who had a higher income were more likely to get a vaccine.
Table 6: Sequential analysis of deviance: logistic regression for energy conservation
df 10 32.9 1 19.0 4 82.9 914 419.5
The model in this case had only one situation-specific attitude, Punitive Attitude toward those who do not conserve, but three situation-specific beliefs, first, about the effect of not conserving energy, second, what percentage of people do conserve energy (a “descriptive norm”), and third, what percentage of people should conserve energy (an “injunctive norm”). Table 6 shows the results.
None of the 10 demographic variables strongly correlated with energy conservation. However, Punitive Attitude and percentage that do conserve, were both positively correlated to cooperating, and the negative effect of not conserving was positively correlated to cooperating.
Table 7: Sequential analysis of deviance: logistic regression for buying green energy
df 10 20.2 1 12.5 3 220.4 1 12.7 913 250.6
The model again included the 10 demographic variables, SRA, and four situation-specific behaviors, attitudes or beliefs (do you use alternative energy in your home, do you know about alternative energy, percentage of people who should buy green electricity, and Punitive Attitudes). Here, as with many of the other dilemmas, situation-specific behaviors, attitudes and beliefs account for the largest reduction in deviance. Table 7 shows the results. Using alternative energy, knowing about alternative energy, and the percentage of people who should buy green electricity all positively correlated with cooperation. None of the 10 demographic variables are associated with cooperating.
Table 8: Top three open-ended reasons for defecting and cooperating for each social dilemma.
Dilemma Top 3 reasons for defecting Top 3 reasons for cooperating Conserve 26% 58% energy 18% 18% 16% 6% Blood 28% 53% donation 16% 10% 12% 7% Flu 33% 50% vaccine 14% 12% 12% 12% NPR 29% 42% donation 23% 14% 14% 10% Green 23% 42% electricity 20% 10% 18% 10%
Open-ended reasons for cooperating and defecting were coded by one rater (929 participants x 5 dilemmas = 4645 responses). Even though we asked for the main reason, many participants provided more than one reason, which led to the rater coding up to 3 reasons.
Each dilemma has some idiosyncratic reasons for defection: for example, some people do not donate blood because they are afraid of needles and some are ineligible for medical reasons. Some do not buy green energy because they are not responsible for paying energy bills. There are also some unique reasons for cooperation. A coding scheme was devised for each dilemma, with 10–18 coding categories for each branch, cooperation or defection. The three most frequent categories for each dilemma and each branch are given in Table 8.
Table 9: Main social and non-social reasons for cooperating.
Social reason (any priority) Dilemma N Conditional % Conserve energy 304 35.6 Blood donation 372 77.8 Flu vaccine 60 13.9 NPR donation 159 100 Green electricity 61 76.2
This set of codes was developed in two stages. After the initial coding, a subset of the codes was checked by an independent coder. Inter-rater reliability was was calculated (using 3–7 coding categories). For 6 out of 10 cases, inter-rater reliability was good (κ ranging from .60 to .93, with the worst cases attributable to inconsistent use of “other” as a category). In one other case (flu defect) the main category is “self-interest”, so κ means little. In 3 cases, however, rater differences revealed ambiguities in the coding scheme; codes were modified. Only one coder provided the final codes. (Details and the full coding scheme are provided in the Appendix.) For some dilemmas, the coded open-ended reasons confirm findings from prior research. A common reason for getting a flu shot is to prevent illness (Nichol & Hauge, 1997) and a common reason for not donating blood is fear of needles and perceived ineligibility (Lemmens et al., 2009).
To further investigate the open-ended reasons, Table 9 summarizes the use of social reasons (actions for the collective good) as reasons for cooperation. To determine whether people view the problems provided as a social dilemma, we analyzed whether the open-ended reason provided was in fact a social reason. Only 304 participants out of 855 gave a reason (first or later) that relates to some sort of social reason or greater good in the Conserve Energy problem. Thus, while many people see this problem as a social dilemma, the majority seems not to, or at least do not articulate that view. An even more extreme case is the Flu Vaccine problem. Here, 434 respondents stated that they always or sometimes get flu shots, but most of the reasons had to do with personal health. Only 110 people, about 25%, mention protecting the health of others as one of their reasons.
On the other hand, Blood Donation and Green Electricity are perceived more widely in social terms. For example, in the Blood Donation problem, as seen in Table 8, majority of the reasons provided were justified by social reasons such as “it’s the right thing to do”, “to help people and save lives”.
Table 10: Main self-interest and non-self-interest reasons for defecting.
Self-interest reason (any priority) Dilemma N Conditional % Conserve energy 27 36.3 Blood donation 193 42.8 Flu vaccine 327 66.0 NPR donation 233 30.2 Green electricity 227 26.6
Only NPR donators give exclusively social reasons; for Blood Donation and Green Electricity there is a not-so-small minority who give only personal benefit as a reason. In the case of NPR, however, the dominant social reason is reciprocity (“I listen to NPR”), rather than more abstract concern for public good (“right thing to do” or the like).
Thus social reasons do often account for why people cooperate in social dilemmas, especially in the case of NPR (where 100% of the participants donate because of implicit reciprocity), green electricity (save the earth), blood donation (to help others and save lives). In these cases the problem seems to be perceived widely as a social dilemma. Cooperation also arises from perceived self-interest, especially in the case of flu shot (protect health) and energy conservation (save money). In such cases, the problem is not perceived as a social dilemma.
Self-interest does somewhat account for why people defect when they face social dilemmas, especially in the case of flu vaccines (where 66% of the defectors think they are not vulnerable to the flu). Table 10 shows the main reasons for defecting across the social dilemmas. Surprisingly, defection often results from factors other than self-interest: ideology, eligibility, availability, beliefs about effectiveness, or non-reciprocity.
From the open-ended qualitative analysis, “drop in the bucket” and “sucker” arguments for defection are rare. “Greater good” arguments for cooperation are frequent, but far from universal, because of the numerous cases of self-interest.
The logistic regressions presented earlier, with cooperation as dependent variable, highlight the importance of altruism (as assessed by the SRA scale) and of several social norms, including the reciprocity norm and beliefs that people should cooperate and that non-cooperators should be punished. The open-ended reasons that people give for cooperation or defection partly support these conclusions from the regression analyses. While some of the five problems are viewed as social dilemmas only by a minority, cooperation is often linked to moral norms or reciprocity, and defection is often linked to a predominance of self-interest reasons.
After entering one or more open-ended reason(s) for cooperating or defecting, a participant then indicated how closely each of six closed-ended reasons matched the reason(s) for cooperation or defection just given. These reasons are shown in Table 2, for NPR only, and in the Appendix for all dilemmas. Responses used a three-point scale: “close match”, “somewhat match”, and “does not match”. These a priori closed-ended reasons were worded to be contraries of one another for cooperation and defection. Preserving this symmetry of reasons allowed us to take reasons that we thought were important for defection, such as free riding and not wanting to be a sucker, and to provide similar opposing reasons for cooperation, such as not wanting to free ride and not minding being a sucker.
Figure 1 shows that on average, cooperators found several reasons to be a “close match” but defectors often found no such matches or often only one.
Thus the set of a priori reasons for cooperation fits the participants’ stated reasons fairly well, almost too well—to cooperators, several potentially distinct a priori reasons sound about right. The a priori reasons for defection, however, fit the stated reasons poorly. This indicates that people may not have a distinct idea of why they cooperate, so are willing to endorse several reasons as correct, whereas defectors have rather specific reasons, and resist classifying these reasons as free riding or avoiding being a sucker. This latter point is shown in Figure 2, where the fraction endorsing each type of a priori reason is shown, averaged across the five dilemmas.
Three types of reason, altruism, sucker, and free ride, are used very infrequently as matches to the reason for defection. Notably, these three are also least used as matches for cooperation, but the latter proportions are much higher. These three types all refer to other people in one-way or another (see Table 1), and are thereby perhaps more complex conceptually than the three that refer only to the dilemma directly. Nonetheless, it seems important that about 1/6 of cooperators, on average, endorse free ride (others cooperate, so I should), while many fewer defectors endorse this reason. One reason they might not endorse it is that they do not agree with assumed descriptive norm—i.e., that many others cooperate. If so, then they should agree with the assumed opposite—few cooperate—and might thus be led to endorse sucker as a reason for their choice. In fact, they endorse neither, while a substantial fraction of cooperators for any given dilemma endorse either free ride or sucker.
Figure 1: Mean number of closed-ended reasons endorsed as “close match” for cooperation and defection. Error bars are ± 1 standard error of the mean.
Figure 2: Proportion endorsing each closed-ended reason as “close match” for cooperation and for defection (averaged across the 5 dilemmas). 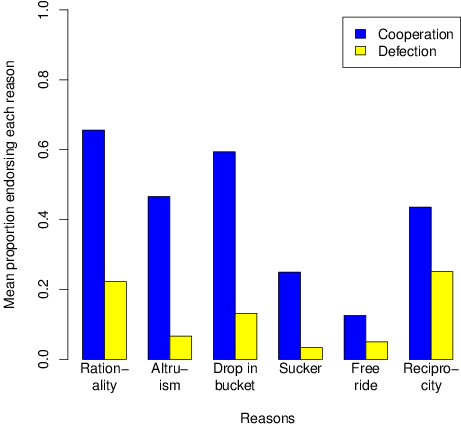
What does trying to conserve energy have to do with supporting NPR by donations? On the surface, not much; and indeed, our data show only a weak correlation (+.12 ± .03) between these behaviors and a considerable difference in the main reasons that people cite for doing them. 92% of our subjects say that they try to conserve energy, and of these, 59% list a self-interested justification, saving money, as a major reason. By contrast, only 1 in 6 donate to NPR, and 45% of these donors mention reciprocity explicitly—I listen, therefore I should donate. There are, however similarities between the two situations. Self-reported altruism correlates with cooperation in both cases, as does punitive attitude toward violators of the domain-specific norms. About 35% of energy conservers list an environmental reason for their action, possibly in addition to a self-interested reason. In the case of NPR, a social norm is quite explicit—most people, regardless of political orientation or attitude toward NPR, believe that those who listen should donate. For energy conservation, the presence of a social norm can be inferred from punitive attitudes: among those who report that they conserve, about 27% are quite willing or extremely willing to penalize those who don’t and about 24% express strong or extreme anger at those who don’t.
The comparison of NPR donation and energy conservation was selected to illustrate an underlying commonality in social reasons for cooperation despite the considerable difference in cooperation rates and in self-interest justifications. Our data in fact suggest that social attitudes and norms are important for cooperation in all five dilemmas: cooperation correlates positively with SRA for each, and all but blood donation show a positive relation to punitive attitudes vis-à-vis defectors. In the case of blood donation we have the surprising finding that those who have received blood tend to have substantially higher SRA scores (which may mediate a somewhat greater willingness to donate blood). This raises the question of whether recipients of benefits in other domains also show higher SRA scores. This could only be answered by separate research directed toward this question.
Some lessons about method for studying social norms emerge from our results. In isolation, a stated reason or justification for behavior may or may not reflect a true underlying goal—it can also reflect social desirability or a goal that appears rational. Our inferences about social norms are produced by converging evidence: correlates of self-reported choices, open-ended statements about justification, and willingness to endorse one or several reasons (related to free riding, reciprocity, etc.) in a closed-ended probe task. In this latter regard, it is interesting to contrast the endorsement by cooperators of several different reasons from the list we provided with the rejection of the contrary putative defection reasons by defectors. The failure of our list of putative defection reasons may involve two factors. On one hand, there are highly domain-specific reasons for defection, such as ineligibility for blood donation, or unavailability (real or perceived) for green energy. The second factor is failure to acknowledge free-riding. Many reasons for defection are ones that one might label as free-riding, but are not recognized as such, either out of ignorance (people don’t understand that they benefit from others’ flu shots) or through motivated cognition.
Finally, we note the importance of domain-specific norms, attitudes and beliefs in these five dilemmas. Someone wanting to promote pro-social behavior would proceed quite differently for NPR donation versus blood donation versus getting flu shots and for promoting energy conservation versus increasing sales of green energy. NPR donation depends heavily on a reciprocity norm widely held among both donors and non-donors: if you listen, you should donate. Thus, NPR correctly depends on radio appeals to listeners—those who listen often hear these appeals and are the main source of donations. Blood donation appeals can also attempt to use reciprocity: you or one of your loved ones may need a blood transfusion some day. At the same time, campaigns for blood donation might benefit from clarification about who is eligible to donate and from efforts to reduce fear of the process of drawing blood. “Come with your closest friends and donate together” might help alleviate fear. For flu shots it seems clear that benefits to others should be emphasized, since so many people seem unaware of the social dilemma and treat the question as one of their personal vulnerability to flu. Energy conservation can probably be promoted usefully by emphasizing the combination of environmental and future-generation benefits with long-term cost savings. Finally, green energy suffers from lack of marketing efforts—people simply are unaware of the possibility.
The open-ended reasons provided by defectors offer a window into domain-specific issues that may need to be addressed in each dilemma. For example, many people state that they do not donate blood because they are afraid of needles (28%) or believe they are ineligible for health reasons (16%). We suggested above the possibility of reducing fear of needles and clarifying eligibility; other paths to these ends may be found. Similarly, some people believe that energy conservation measures are too expensive (26%); emphasizing longer time horizons is a possible remedy. Other domain-specific reasons seem irrefutable – one who does not pay for electricity cannot simply elect to buy green. Research is needed both to test methods for overcoming domain-specific barriers and to test the extent to which domain-specific reasons represent motivated cognition—reasons constructed to retain a pro-social self-image.
Bicchieri, C. (2005). The grammar of society: The nature and dynamics of social norms. New York: Cambridge University Press.
Chapman, G. B., & Coups, E. J. (1999). Predictors of influenza vaccine acceptance among healthy adults. Preventive medicine, 29(4), 249-262.
Dawes, R. M. (1980). Social dilemmas. Annual Review of Psychology, 31(1), 169–193.
Ericsson, K. A., & Simon, H. A. (1980). Verbal reports as data. Psychological Review, 87(3), 215.
Fehr, E., & Gachter, S. (2002). Altruistic punishment in humans. Nature, 415, 137–140.
Hershey, J. C., Asch, D. A., Thumasathit, T., Meszaros, J., & Waters, V. V. (1994). The roles of altruism, free riding, and bandwagoning in vaccination decisions. Organizational Behavior and Human Decision Processes, 59(2), 177–187.
Kollock, P. (1998). Social dilemmas: The anatomy of cooperation. Annual review of sociology, 24(1), 183–214.
Lee, L., Piliavin, J. A., & Call, V. R. (1999). Giving time, money, and blood: Similarities and differences. Social Psychology Quarterly, 276–290.
Lemmens, K., Abraham, C., Ruiter, R., Veldhuizen, I., Dehing, C., Bos, A., & Schaalma, H. (2009). Modelling antecedents of blood donation motivation among non-donors of varying age and education. British Journal of Psychology, 100(1), 71–90.
Nichol, K. L., & Hauge, M. (1997). Influenza vaccination of healthcare workers. Infection Control and Hospital Epidemiology, 189–194.
Nisbett, R., & Wilson, T. (1977). Telling more than we can know: Verbal reports on mental processes. Psychological Review, 84(3), 231-259.
Ostrom, E. (1990). Governing the commons: The evolution of institutions for collective action. New York: Cambridge University Press.
Rushton, J., Chrisjohn, R., & Fekken, G. (1981). The altruistic personality and the self-report altruism scale. Personality and Individual Differences, 2(4), 293–302.
U.S. Census Bureau. (2011). American Community Survey Retrieved May 2, 2013, from http://www.census.gov/acs/www/.
Weber, J. M., & Murnighan, J. K. (2008). Suckers or saviors? Consistent contributors in social dilemmas. Journal of Personality and Social Psychology, 95(6), 1340.
Appendix
Cooperate branch | Defection Branch |
NPR | |
1. The amount I donate to NPR will make a difference. 2. I listen to NPR, so I need to donate. 3. The benefits of donating to NPR outweigh the costs of donating. 4. Many people do not donate to NPR—so I need to donate. 5. Other people donate to NPR, so I need to donate too. 6. I donate to NPR because it benefits others even at a cost to myself. | 1. The amount I donate to NPR will not make a difference. 2. I do not listen to NPR, so I do not need to donate. 3. The costs of donating to NPR outweigh the benefits of donating. 4. Many people do not donate to NPR—so I do not need to donate either. 5. Other people donate to NPR, so I do not need to donate. 6. I do not donate to NPR because it benefits others at a cost to myself. |
Conserve energy | |
1. The amount of energy I conserve will make a difference. 2. I use a lot of energy at home, so I need to conserve. 3. The benefits of conserving energy outweigh the costs of conserving. 4. Many people do not conserve energy in their homes, so I need to conserve energy. 5. Other people conserve energy in their homes, so I need to conserve energy too. 6. I conserve energy because it benefits others even at a cost to myself. | 1. The amount of energy I conserve will not make a difference. 2. I do not use a lot of energy at home, so I do not need to conserve. 3. The costs of conserving energy outweigh the benefits of conserving. 4. Many people do not conserve energy in their homes, so I do not need to conserve energy either. 5. Other people conserve energy in their homes, so I do not need to conserve energy. 6. I do not conserve energy because it benefits others at a cost to myself. |
Green electricity | |
1. If I buy green electricity it will make a difference. 2. I am affected by the outcome, so I need to buy green electricity. 3. The benefits of buying green electricity outweigh the costs of buying green electricity. 4. Many people do not buy green electricity, so I need to buy green electricity. 5. Other people buy green electricity, so I need to buy green electricity too. 6. I buy green electricity because it benefits others even at a cost to myself. | 1. If I buy green electricity it will not make a difference. 2. I am not affected by the outcome, so I need not buy green electricity. 3. The costs of buying green electricity outweigh the benefits of buying green electricity. 4. Many people do not buy green electricity, so I do not need to buy green electricity either. 5. Other people buy green electricity, so I do not need to buy green electricity. 6. I do not buy green electricity because it benefits others at a cost to myself. |
Blood donation | |
1. The amount of blood I donate will make a difference. 2. I may need a blood transfusion, so I need to donate blood. 3. The benefits of donating blood outweigh the costs of donating blood. 4. Many people do not donate blood, so I need to donate blood. 5. Other people donate blood, so I need to donate blood too. 6. I donate blood because it benefits others even at a cost to myself. | 1. The amount of blood I donate will not make a difference. 2. I may not need a blood transfusion, so I do not need to donate blood. 3. The costs of donating blood outweigh the benefits of donating blood. 4. Many people do not donate blood, so I do not need to donate blood either. 5. Other people donate blood, so I do not need to donate blood. 6. I do not donate blood because it benefits others at a cost to myself. |
Flu vaccination | |
1. If I get vaccinated it will make a difference. 2. I do not have a good immune system, so I need to get vaccinated. 3. The benefits of being vaccinated outweigh the costs of being vaccinated. 4. Many people do not get vaccinated, so I need to get vaccinated.. 5. Other people get vaccinated, so I need to get vaccinated too. 6. I get vaccinated because it benefits others even at a cost to myself. | 1. If I get vaccinated it will not make a difference. 2. I have a good immune system, so I do not need to get vaccinated . 3. The costs of being vaccinated outweigh the benefits of being vaccinated. 4. Many people do not get vaccinated, so I do not need to get vaccinated either. 5. Other people get vaccinated, so I do not need to get vaccinated. 6. I do not get vaccinated because it benefits others at a cost to myself. |
Logistic regression results: Analysis of maximum
likelihood estimates
| Predictor | Estimate | SE |
| Intercept | -7.32 | 1.8 |
| Listen NPR | 0.97 | 0.073 |
| Per SDonate NPR | 0.015 | 0.005 |
| NPR Puny | 0.42 | 0.25 |
| SRA | 0.039 | 0.01 |
| Children | 0.15 | 0.32 |
| Env Org | -0.38 | 0.40 |
| PV | -0.067 | 0.082 |
| Male | 0.16 | 0.27 |
| Age | 0.032 | 0.014 |
| Years in US | -0.41 | 0.16 |
| White | 0.087 | 0.36 |
| English | 1.34 | 0.76 |
| Income | -0.036 | 0.085 |
| Education | 0.0098 | 0.12 |
| Predictor | Estimate | SE |
| Intercept | -6.08 | 1.17 |
| Blood Trans | 0.28 | 0.19 |
| Blood Puny | 0.077 | 0.14 |
| Per SDonate Blood | 0.018 | 0.0036 |
| Per Donate Blood | -0.010 | 0.0042 |
| Blood Effect | -0.39 | 0.11 |
| SRA | 0.059 | 0.0070 |
| Children | -0.30 | 0.18 |
| Env Org | 0.12 | 0.29 |
| PV | 0.04 | 0.048 |
| Male | 0.40 | 0.16 |
| Age | 0.0013 | 0.008 |
| Years in US | 0.22 | 0.12 |
| White | 0.14 | 0.20 |
| English | 0.32 | 0.42 |
| Income | 0.028 | 0.048 |
| Education | 0.15 | 0.070 |
| Predictor | Estimate | SE |
| Intercept | -7.93 | 2.16 |
| Alt Energy | 1.43 | 0.41 |
| Know Alt Energy | 4.68 | 0.62 |
| Per SBuy Green | 0.028 | 0.0071 |
| Green Puny | 0.32 | 0.25 |
| SRA | 0.014 | 0.015 |
| Children | 0.20 | 0.41 |
| Env Org | -0.43 | 0.48 |
| PV | 0.11 | 0.11 |
| Male | 0.31 | 0.35 |
| Age | 0.001 | 0.02 |
| Years in US | -0.14 | 0.20 |
| White | -0.20 | 0.46 |
| English | -0.68 | 0.90 |
| Income | 0.037 | 0.10 |
| Education | 0.085 | 0.14 |
| Predictor | Estimate | SE |
| Intercept | -5.57 | 1.36 |
| Flu Puny | 1.18 | 0.18 |
| WhoVac | 0.47 | 0.079 |
| Flu Effect | -0.24 | 0.12 |
| Per SVaccine Flu | 0.023 | 0.0043 |
| SRA | 0.024 | 0.0078 |
| Children | -0.40 | 0.22 |
| Env Org | 0.070 | 0.36 |
| PV | -0.014 | 0.058 |
| Male | 0.17 | 0.18 |
| Age | 0.0009 | 0.0096 |
| Years in US | 0.034 | 0.13 |
| White | 0.048 | 0.24 |
| English | -0.19 | 0.47 |
| Income | 0.17 | 0.059 |
| Education | 0.066 | 0.083 |
| Predictor | Estimate | SE |
| Intercept | -1.48 | 2.15 |
| Per SBuy EE | -0.0007 | 0.005 |
| Per Buy EE | 0.021 | 0.0076 |
| EE Effect | -0.75 | 0.17 |
| sCon Puny | 1.02 | 0.25 |
| SRA | 0.046 | 0.013 |
| Children | -0.22 | 0.36 |
| Env Org | -0.070 | 0.65 |
| PV | 0.14 | 0.09 |
| Male | -0.27 | 0.28 |
| Age | 0.016 | 0.016 |
| Years in US | 0.16 | 0.18 |
| White | -0.18 | 0.35 |
| English | 0.24 | 0.67 |
| Income | -0.056 | 0.080 |
| Education | 0.050 | 0.12 |
Open-ended coding of reasons provided for cooperation and defection for each social dilemma.
Note that the counts for all reasons are equally weighted, when
multiple reasons are provided.
Reason | First reason | Second reason | Third reason | Total | Percentage of all mentioned reasons |
Listen to programs/like program content | 84 | 3 | 0 | 87 | 41.8% |
To support NPR/believe in NPR/Like NPR | 15 | 12 | 3 | 30 | 14.4% |
Other Category | 14 | 7 | 0 | 21 | 10.1% |
Warm glow/right thing to do/doing my part/like to contribute | 13 | 5 | 1 | 19 | 9.1% |
Want to keep them around | 4 | 12 | 2 | 18 | 8.7% |
For benefit of others | 8 | 3 | 0 | 11 | 5.3% |
Independent public radio without corporate influence is important | 7 | 2 | 0 | 9 | 4.3% |
Worth listening to/worthy cause | 4 | 3 | 0 | 7 | 3.4% |
To support independent artists | 2 | 1 | 0 | 3 | 1.4% |
Freedom of information without government influence is important | 3 | 0 | 0 | 3 | 1.4% |
Reason | First reason | Second reason | Third reason | Total | Percentage of all mentioned reasons |
Don’t listen to/watch NPR programs | 239 | 20 | 0 | 259 | 28.8% |
Cannot afford to | 182 | 24 | 2 | 208 | 23.1% |
Don’t know about NPR | 123 | 7 | 0 | 130 | 14.4% |
Other Categories | 65 | 16 | 1 | 82 | 9.1% |
Prefer other local organizations | 43 | 21 | 2 | 66 | 7.3% |
Gain no personal benefit/ no reason to give/ not interested/no reason | 46 | 3 | 0 | 49 | 5.4% |
Did not know NPR accepted donations | 28 | 9 | 1 | 38 | 4.2% |
Don’t agree with their viewpoint | 21 | 2 | 0 | 23 | 2.6% |
Haven’t been able to but most likely in the future | 2 | 12 | 3 | 17 | 1.9% |
Never had the opportunity | 15 | 1 | 0 | 16 | 1.8% |
NPR receives funds from my taxes/NPR does not need my money | 5 | 2 | 0 | 7 | 0.8% |
Funds will not be used efficiently | 5 | 0 | 0 | 5 | 0.6% |
Reason | First reason | Second reason | Third reason | Total | Percentage of all mentioned reasons |
To help others/Save lives | 282 | 46 | 5 | 333 | 52.6% |
Right thing to do | 48 | 18 | 0 | 66 | 10.4% |
Other category | 36 | 9 | 0 | 45 | 7.1% |
To help increase supply | 26 | 5 | 2 | 33 | 5.2% |
I might need blood one day myself or know someone needed blood in the
past | 14 | 14 | 2 | 30 | 4.7% |
Easy/free to do | 25 | 0 | 4 | 29 | 4.6% |
Warm glow | 17 | 7 | 4 | 28 | 4.4% |
Blood drive at organization/community | 24 | 2 | 0 | 26 | 4.1% |
Donated for charitable purpose | 1 | 22 | 0 | 23 | 3.6% |
Monetary or other incentives | 8 | 6 | 0 | 14 | 2.2% |
For health reason | 2 | 2 | 0 | 4 | 0.6% |
Learned to donate from family | 1 | 1 | 0 | 2 | 0.3% |
Reason | First reason | Second reason | Third reason | Total | Percentage of all mentioned reasons |
Scared/dislike of needles/afraid of passing out/get sick afterwards | 126 | 13 | 0 | 139 | 28.0% |
Not eligible because of the health condition | 71 | 7 | 1 | 79 | 15.9% |
Did not have time | 58 | 2 | 1 | 61 | 12.3% |
Other category | 44 | 4 | 1 | 49 | 9.9% |
Did not have opportunity/Don’t have enough
information/inconvenience | 36 | 8 | 0 | 44 | 8.9% |
Weight disqualifies me | 32 | 1 | 0 | 33 | 6.7% |
Not eligible | 24 | 0 | 0 | 24 | 4.8% |
Not eligible because of medication | 12 | 3 | 0 | 15 | 3.0% |
Not eligible because of tatoo | 8 | 2 | 0 | 10 | 2.0% |
Not eligible because lived abroad | 9 | 0 | 0 | 9 | 1.8% |
Laziness | 8 | 1 | 0 | 9 | 1.8% |
Trouble with vein | 5 | 3 | 0 | 8 | 1.6% |
Not eligible because of International travel | 6 | 1 | 0 | 7 | 1.4% |
Concern about contracting disease | 3 | 3 | 0 | 6 | 1.2% |
Not eligible because of sexual orientation | 3 | 0 | 0 | 3 | 0.6% |
Reason | First reason | Second reason | Third reason | Total | Percentage of all mentioned reasons |
Save earth/less pollution/reduce carbon footprint | 33 | 6 | 0 | 39 | 41.5% |
Help increase renewable energy source/use | 7 | 2 | 0 | 9 | 9.6% |
To save money/tax credit | 8 | 1 | 0 | 9 | 9.6% |
Increase conservation effort/ Reduce use of energy | 7 | 1 | 0 | 8 | 8.5% |
Other Category | 5 | 1 | 1 | 7 | 7.4% |
Warm glow/I want to | 3 | 3 | 0 | 6 | 6.4% |
Forced to use renewable energy/convenient | 6 | 0 | 0 | 6 | 6.4% |
Promote sustainable development/For betterment of my community/Save
energy for future generation | 3 | 2 | 0 | 5 | 5.3% |
Reduce dependency on fossil fuels | 0 | 2 | 1 | 3 | 3.2% |
Efficient | 2 | 0 | 0 | 2 | 2.1% |
Reason | First reason | Second reason | Third reason | Total | Percentage of all mentioned reasons |
Expensive/not affordable/need to save | 191 | 68 | 4 | 263 | 22.8% |
Did not know it was offered | 205 | 26 | 3 | 234 | 20.3% |
Utility company does not offer it | 208 | 4 | 0 | 212 | 18.4% |
Don’t own property/ not the bill payer | 117 | 16 | 0 | 133 | 11.5% |
Never heard of green electricity/ I am not well informed about green
energy/product | 102 | 24 | 1 | 127 | 11.0% |
Will use in the future/Would use if made available | 2 | 44 | 11 | 57 | 4.9% |
Do not believe in it/ never considered buying green energy | 31 | 18 | 2 | 51 | 4.4% |
Inconvenient/Have not taken action to change | 18 | 9 | 0 | 27 | 2.3% |
Not interested/not necessary/not important | 14 | 4 | 1 | 19 | 1.7% |
Other Category | 6 | 1 | 0 | 7 | 0.6% |
Drop in the bucked/no benefit to me | 3 | 3 | 0 | 6 | 0.5% |
Inconvenient | 2 | 3 | 1 | 6 | 0.5% |
The mix is already green | 3 | 2 | 1 | 6 | 0.5% |
Have solar panel/Energy comes from hydroelectric/green power | 4 | 1 | 0 | 5 | 0.4% |
Reason | First reason | Second reason | Third reason | Total | Percentage of all mentioned reasons |
To avoid getting sick from flu | 281 | 23 | 3 | 307 | 49.8% |
Desire to not spread/ to protect others/ herd immunity (classroom,
public, co-workers, elderly) | 24 | 39 | 12 | 75 | 12.2% |
To protect my family/my children | 32 | 36 | 3 | 71 | 11.5% |
Health condition/For weak immune system/Doctor’s
recommendation | 34 | 4 | 0 | 38 | 6.2% |
To avoid down time | 14 | 20 | 0 | 34 | 5.5% |
Long-term Benefits/ Healthy life/ Less Chance of Disease/ Stronger
Immunity | 25 | 5 | 1 | 31 | 5.0% |
Convenience/Easy access to vaccine | 20 | 6 | 0 | 26 | 4.2% |
Vaccination is more cost effective than a trip to doctor | 10 | 3 | 0 | 13 | 2.1% |
Required at workplace | 10 | 1 | 0 | 11 | 1.8% |
Other Category | 10 | 0 | 0 | 10 | 1.6% |
Don’t have health insurance/don’t want
to pay out of pocket | 1 | 0 | 0 | 1 | 0.7% |
Reason | First reason | Second reason | Third reason | Total | Percentage of all mentioned reasons |
I don’t get sick from
flu/unnecessary/don’t want to | 187 | 34 | 6 | 227 | 33.2% |
Other category | 64 | 25 | 3 | 92 | 13.5% |
Vaccine is not effective | 57 | 23 | 3 | 83 | 12.1% |
To avoid risk of other complications/Danger of vaccination/Get sick from
vaccination | 44 | 10 | 3 | 57 | 8.3% |
Expensive/not cost effective/don’t want to pay | 31 | 14 | 2 | 47 | 6.9% |
Don’t take time to do it/no reason/waste of time | 27 | 4 | 1 | 32 | 4.7% |
Don’t like shots/afraid of needles | 23 | 5 | 0 | 28 | 4.1% |
Not in high risk group | 22 | 5 | 1 | 28 | 4.1% |
I have strong immune system | 13 | 10 | 0 | 23 | 3.4% |
Don’t trust government issued
vaccination/don’t trust vaccine | 12 | 9 | 1 | 22 | 3.2% |
Others need it more than I do/don’t want to contribute
to shortage | 5 | 13 | 2 | 20 | 2.9% |
Don’t have contact with others/ high risk population | 3 | 9 | 1 | 13 | 1.9% |
Don’t have insurance | 7 | 3 | 0 | 10 | 1.5% |
Would take it if offered/not offered in my area | 0 | 2 | 0 | 2 | 0.3% |
Reason | First reason | Second reason | Third reason | Total | Percentage of all mentioned reasons |
To save money/Conservation is not every expensive | 587 | 86 | 7 | 680 | 58.2% |
Protect environment/good for environment/concern for environment/to go
green | 108 | 95 | 4 | 207 | 17.7% |
Conserve energy/ resources - to avoid using up all resources | 37 | 34 | 3 | 74 | 6.3% |
Other category | 44 | 19 | 2 | 65 | 5.6% |
Doing my part | 18 | 14 | 0 | 32 | 2.7% |
Reduce energy waste, not consume that much | 16 | 13 | 0 | 29 | 2.5% |
Help next generation/save future | 16 | 9 | 4 | 29 | 2.5% |
Right thing to do | 15 | 10 | 0 | 25 | 2.1% |
Reduce carbon emission/carbon footprint | 7 | 6 | 0 | 13 | 1.1% |
Warm glow/Makes me feel good | 1 | 3 | 1 | 5 | 0.4% |
Convenience | 2 | 2 | 1 | 5 | 0.4% |
Learned from family | 3 | 0 | 0 | 3 | 0.3% |
Foreign oil | 1 | 0 | 0 | 1 | 0.1% |
Reason | First reason | Second reason | Total | Percentage of all mentioned reasons |
Expensive, cost outweigh benefit | 20 | 2 | 22 | 26.2% |
Other Category | 13 | 2 | 15 | 17.9% |
Not interested in energy conservation/Don’t think its
important | 11 | 2 | 13 | 15.5% |
Don’t own the property/Don’t pay
electric bill myself | 9 | 1 | 10 | 11.9% |
One person does not make a difference/drop in the bucket | 7 | 0 | 7 | 8.3% |
Don’t have information about how to conserve | 4 | 0 | 4 | 4.8% |
Lazy | 4 | 0 | 4 | 4.8% |
Inconvenience | 3 | 1 | 4 | 4.8% |
Nature takes care of us/World will be fine | 0 | 2 | 2 | 2.4% |
Did not have opportunity | 2 | 0 | 2 | 2.4% |
Don’t like energy efficient products | 1 | 0 | 1 | 1.2% |
| NPR | Con | Green | Blood | Flu | SRA | Child. | EnvOrg | PV | Male | Age | Years | White | Engl. | Inc. | |
| NPR | 1.00 | ||||||||||||||
| Con | 0.13 | 1.00 | |||||||||||||
| Green | 0.11 | 0.04 | 1.00 | ||||||||||||
| Blood | 0.10 | 0.08 | 0.06 | 1.00 | |||||||||||
| Flu | 0.05 | 0.01 | 0.06 | 0.05 | 1.00 | ||||||||||
| SRA | 0.21 | 0.21 | 0.11 | 0.34 | 0.15 | 1.00 | |||||||||
| Children | −0.03 | −0.13 | 0.04 | −0.14 | −0.07 | −0.21 | 1.00 | ||||||||
| EnvOrg | −0.11 | −0.06 | −0.11 | −0.03 | 0.00 | −0.14 | −0.08 | 1.00 | |||||||
| PV | −0.10 | −0.02 | −0.03 | 0.06 | 0.05 | 0.03 | −0.18 | 0.13 | 1.00 | ||||||
| Male | 0.04 | −0.05 | 0.04 | 0.02 | −0.01 | −0.08 | 0.23 | −0.03 | 0.07 | 1.00 | |||||
| Age | 0.11 | 0.11 | −0.06 | 0.10 | 0.06 | 0.21 | −0.46 | −0.01 | 0.12 | −0.12 | 1.00 | ||||
| Years in US | −0.05 | 0.05 | −0.10 | 0.10 | −0.03 | 0.02 | −0.05 | −0.03 | 0.00 | −0.05 | 0.07 | 1.00 | |||
| White | 0.04 | 0.03 | −0.02 | 0.08 | −0.03 | 0.05 | −0.03 | −0.06 | 0.07 | 0.01 | 0.10 | 0.34 | 1.00 | ||
| English | 0.03 | 0.02 | −0.06 | 0.08 | −0.03 | 0.04 | −0.02 | −0.07 | −0.02 | −0.04 | 0.06 | 0.54 | 0.32 | 1.00 | |
| Income | 0.03 | −0.01 | 0.01 | 0.06 | 0.11 | 0.06 | −0.03 | −0.01 | 0.07 | 0.14 | 0.01 | −0.03 | −0.02 | −0.01 | 1.00 |
| Educ. | 0.14 | 0.06 | 0.00 | 0.09 | 0.06 | 0.11 | −0.08 | −0.01 | −0.02 | −0.03 | 0.24 | −0.08 | −0.08 | 0.00 | 0.18 |
Copyright: © 2014. The authors license this article under the terms of the Creative Commons Attribution 3.0 License.
This document was translated from LATEX by HEVEA.