In four experiments we showed that investors are not only interested in
maximizing returns but have non-financial goals, too. We considered
what drives the decision to invest ethically and the impact this
strategy has on people’s evaluation of investment performance. In Study
1, participants who chose a moral portfolio (over an immoral one)
reported being less interested in maximizing their gains and more
interested in being true to their moral values. These participants also
reported feeling lower disappointment upon learning that a different
decision could have yield a better outcome. In Studies 2 and 3, we
replicated these findings when investors decided not to invest in
immoral assets, rather than when they choose to invest morally. In
Study 4, we found similar results using the same industrial sector in
both the moral and the immoral conditions and providing participants
with information about the expected return of the portfolio they were
presented with. These findings lend empirical support to the conclusion
that investors have both utilitarian (financial) goals and expressive
(non-financial) ones and show how non-financial motivations can
influence the reaction to unsatisfactory investment performance.
Despite doubts about the real advantage of following a socially
responsible strategy (Bello, 2005; Diltz, 1995; Grossman & Sharpe,
1986; Kempf & Osthoff, 2007; Statman, 2007), more and more funds are
now available that use moral criteria to screen stocks. For instance,
between 1995 and 2012 in the United States, the number of socially
screened funds increased from 55 to 720, while in the last two years,
socially responsible investments (SRI) assets rose 78 percent, from
$569 billion to $1,013 billion. This increase far exceeded that
obtained by the broader universe of assets under professional
management in the same period (US Social Investment Forum, 2012).
One of the key goals of SRI is to make money while also doing good.
Consistently, a possible psychological (aka non-financial) advantage of
investing morally is to help in coping with possible downturns and
negative performances. In other words, being true to one’s moral values
and the associated positive feeling of helping the community, the
environment, some minority groups, or other valuable aims should help
the investor feel lower disappointment in the face of a financial loss
or a missed gain. Using hypothetical scenarios, the goal of the present
paper was to demonstrate empirically the value of SRI in helping
investors cope with unsatisfactory investment returns. We also explored
the conditions in which this effect is more likely to happen and
expected it to be driven by the fact that investors are not always
motivated by the unique objective of maximizing their financial gains.
We hypothesized that, if an investor is mainly motivated by a financial
goal, she should find it more difficult to accept an unsatisfactory
outcome compared to an investor who has picked her investments based on
multiple criteria, including non-financial ones (such as being true to
her moral values).
Several surveys of investors’ behavior showed that individual
preferences can influence choices and interfere with a strategy based
on merely risk-return computations (see, Beal, Goyen, & Phillips,
2005; Lease, Lewellen, & Schlarbaum, 1976; Lewellen, Lease, &
Schlarbaum, 1977; Nagy & Obenberger, 1994; Warren, Stevens, &
McConkey, 1990). Investors’ choices for best of sector “ethical
funds”1 seem to
support the reasoning that they are willing to pay higher transaction
costs for what is essentially the same product as a regular mutual
fund simply to derive a higher benefit from the fact that the fund is
branded as socially responsible. Therefore, people who are willing to
purchase best of sector funds fit the profile of an investor who
expects to gain direct utility from investing ethically, and should be
driven by both financial returns and non-wealth factors (Cullis,
Lewis, & Winnett, 1992). Similarly, Williams (2007) provided evidence
that a significant portion of investors from five different countries
consider a company’s social and environmental behavior when making
investment decisions. This does not mean that these investors are
extremists and do not care about the financial performance of their
investments (Sparkes, 2001). A similar conclusion has been proposed by
McLachlan and Gardner (2004), who found that both socially responsible
as well as conventional investors give the same importance to
financial return on investment. However, socially responsible
investors rate twelve out of twelve ethical issues as more important
for their decision compared with the ratings provided by conventional
investors.
Consistent with the survey data reviewed so far, Statman (2004)
suggested that investments provide individuals with two different
benefits: utilitarian and expressive. On the one hand, high expected
returns and low risk are the prototypical exemplars of the utilitarian
benefits of investments. On the other hand, expressive benefits allow
people to express their values, social class, and lifestyle choices to
themselves and to others. We use the word “utilitarian” in the sense
of economic utility (e.g., an investor is utilitarian when she aims at
maximizing her gains), rather than with the meaning the word has in
normative ethical theory (that is, the greatest good for the greatest
number). And we use the term “expressive” (or “moral”) to include
benefits for others that result from the investment as well as
emotional benefits from the investor’s feelings of having financially
supported good things (Beal et al., 2005). The present paper adds to
the literature on SRI by manipulating the type of assets people invest
in and assessing their reactions when the financial performance is
unsatisfactory.
We maintain that, in the financial domain, if a decision is coded as
ethical, then the moral dimension becomes part of the allocation
process and investors are more likely to report that their decisions
are driven by the desire to be true to their moral values.
Consequently, we also hypothesized that when people are driven by a
moral motivation, they should feel lower disappointment when the
financial results of their investments are unsatisfactory. In
contrast, when people interpret the decision as driven by financial
motivations, the moral dimension should not affect the way they invest
their money because the decision is driven by the desire to maximize
their gains. However, by being focused mainly on the financial,
monetary outcome of their investments, these people must experience
the highest disappointment2 once they learn that a different
strategy could have yielded a better result. In other words, they do
not have any additional motivation, besides financial performance,
that is strong enough to help them cope with an unsatisfactory
outcome. On this basis, we hypothesized that investors who report
being more interested in being true to their moral values should feel
less disappointment than those who report being more interested in the
financial return, when their investments achieve unsatisfactory
results.
2 Study 1
In Study 1, we asked participants to choose among different investment
portfolios, then we measured their self-reported motivation to either
gain money or to be true to their moral values, and their
disappointment once informed that a different decision would have
yielded a better outcome.
2.1 Method
Participants.
One hundred fifty-two people (33%
female; mean age 28 years; SD = 7.29) took part in Study 1. They were
contacted on Amazon’s Mechanical Turk and paid $0.20. Amazon
Mechanical Turk is now commonly used to recruit adult participants for
online studies and has been validated by Buhrmester, Kwang, and Gosling
(2011), and Paolacci, Chandler, and Ipeirotis (2010). All participants
were from the United States.
Materials and procedure.
Participants were presented
with the following scenario:
Imagine you want to invest $10,000 in the stock market. Among the many
different alternatives you have looked at, you have found the following
portfolios. Which portfolio would you prefer to invest in?
PORTFOLIO 1: This portfolio is invested in the stocks of
two companies involved with fair trade. [Moral portfolio]
PORTFOLIO 2: This portfolio is invested in the stocks of
two companies that belong to the pornography sector. [Immoral
portfolio]
PORTFOLIO 3: This portfolio is invested in the stock of a
company that belongs to the pornography sector and the stock of a
company involved with fair trade. [Mixed portfolio]
Participants were asked to choose one of the three different
portfolios. Once participants made their choice, they were presented
with a new screen and asked to report the main motivation that drove
their decisions. Answers were provided on a 9-point scale, with the
two extremes labeled, respectively: “Being true to my moral values”
and “Gain money.” The midpoint of the scale was labeled “Both
motivations.” No numbers were associated with the points on the scale
(we only used the labels described above); however, in the analyses we
assigned values ranging from −4, associated with the moral motivation
end of the scale, to +4, associated with the financial motivation end
of the scale. In a subsequent screen, participants were informed that,
by choosing one of the other two portfolios, they would have gained at
least $5,000 more and rated their disappointment on a 6-point scale
ranging from 0 (“not disappointed at all”) to 5 (“very
disappointed”). Finally, in an additional screen, we presented a
manipulation check to assess whether fair-trade and pornography were
actually perceived to have a different moral value. Participants rated
how morally acceptable they perceived fair trade and pornography using
two 7-point scales ranging from 1 (“not moral at all”) to 7 (“very
moral”).
2.2 Results
Preliminary analyses and choices.
We first
looked at the moral value of the two industrial sectors. The
manipulation check confirmed that fair trade (M = 5.46; SD = 1.81) was
judged as more morally acceptable than pornography (M = 3.91; SD =
2.30), t (151) = 8.97; p< 01. Looking at
choices, about half of all participants chose to invest in the moral
portfolio (49%; N = 75), whereas a slightly lower number of people
chose the mixed portfolio, which was investing in both a moral company
and an immoral company (44%; N = 66). Only a few participants decided
to invest in the immoral portfolio (7%; N = 11).
Nonetheless, we treated choice as an interval scale (1–3).
Finally, motivation and disappointment ratings were positively
correlated, r = .53, p < .01.
Motivation ratings.
Participants who chose the moral
portfolio reported lower values on the motivation scale compared to
participants who chose one of the other two portfolios (ratings ranged
between −4 and 4; lower values corresponded to a higher motivation
to be true to one’s moral values and higher values corresponded to a
higher motivation to gain money). The difference was statistically
significant: Mmoral = .31 (SD = 2.82);
Mmixed = 2.47 (SD = 1.60); Mimmoral =
2.64 (SD = 1.57); F (1,150) = 29.47;
p< .001.
Disappointment ratings.
We ran the same analysis to assess
whether participants who chose to invest morally felt less
disappointment after learning that they would have been better off
making a different choice. Consistent with the results found for the
motivation variable, people who invested in the moral portfolio
reported a significantly lower disappointment (scaled 0–5) than those
who invested in the immoral one: Mmoral = 2.56 (SD =
1.80); Mmixed = 3.29 (SD = 1.47);
Mimmoral = 3.36 (SD = 1.12);
F (1,150) = 6.91; p = .009.
2.3 Discussion
Results of Study 1 supported our hypothesis, showing that when people
choose a moral investment they do so because, besides being interested
in gaining money, they are also interested in being true to their moral
values. Indeed, ratings on the motivation scale showed that
participants who invested morally were driven by both motivations
(being true to their moral values and gaining money), whereas
participants who invested in the immoral portfolio were mainly
interested in the financial outcome of their investments. Furthermore,
consistent with our hypothesis, participants who were less willing to
compromise their moral values felt also less disappointment once
informed that a different choice could have yield a better outcome.
At this point, the reader could be tempted to conclude that people who
invest morally are more influenced by the moral dimension of their
decision and, therefore, feel less disappointment. However, in Study 1,
we compared moral and immoral portfolios, and that made it impossible
to assess if these results depended on participants’ decision to invest
morally or on their decision to avoid the immoral asset. To overcome
this confounding factor, in Study 2, we tested two different conditions
in which participants were asked to choose either between moral and
neutral portfolios, or immoral and neutral ones.
3 Study 2
Study 2 was designed to overcome the confounding that arose from the
previous study. Participants were assigned to two different conditions
and asked to choose one of three investment portfolios. In the moral
condition, they were presented with a neutral portfolio, a moral
portfolio, and a mixed portfolio invested in both the neutral and the
moral assets, whereas in the immoral condition, they were presented
with the neutral portfolio, an immoral portfolio, and a mixed one
invested in both the immoral and neutral assets. If being moral is the
main drive of the results found in the previous study, we should
replicate the results only in the moral condition. That is, upon
learning that their investment could have achieved a higher
performance, participants choosing the moral portfolio should feel less
disappointment than those choosing the neutral portfolio since they did
so to be true to their moral values. On the contrary, if avoiding
immoral assets is the main reason why people felt less disappointment
in the face of an unsatisfactory financial outcome, results from Study
1 should be replicated only in the immoral condition. In this case,
upon learning that their investment could have achieved better results,
participants choosing the neutral portfolio should feel less
disappointment than those choosing the immoral portfolio since they did
so to be true to their moral values.
3.1 Method
Participants.
One hundred fifty-eight participants
(45% female; mean age 31 years, SD = 10.81) took part in Study 2. They
were contacted on Amazon Mechanical Turk and paid $0.15 to complete a
short questionnaire. People who participated in Study 1 were filtered
using TurkGate (Goldin & Darlow, 2013) and could not take part in
Study 2. Participants were randomly assigned to one of the two
experimental conditions: eighty participants completed the moral
condition, whereas seventy-eight completed the immoral condition.
Materials and procedure.
Participants were presented
with the following scenario (wording for the immoral condition is
reported in parenthesis):
Imagine you want to invest $10,000 in the stock market. Among the many
different alternatives you have looked at, you have found the following
portfolios. Which portfolio would you prefer to invest in?
PORTFOLIO 1: This portfolio is invested in the stocks of
two companies that belong to the airline sector. [Neutral portfolio]
PORTFOLIO 2: This portfolio is invested in the stocks of
two companies involved with microcredit (vivisection). [Moral
(Immoral) portfolio]
PORTFOLIO 3: This portfolio is invested in the stock of a
company involved with microcredit (vivisection) and the stock of a
company that belongs to the airline sector. [Mixed portfolio]
In both the moral and the immoral conditions, participants were also
presented with a definition of the business sectors composing each
portfolio. Therefore, in the moral condition, we provided a definition
of the microcredit sector, whereas in the immoral condition, we
provided a definition of the vivisection sector. In both conditions,
participants could also read a definition of the neutral asset
(airlines).3
After making their choices, participants were presented with a screen in
which they were asked to rate their motivation on the same 9-point
scale already used in Study 1. Subsequently, in a different screen,
they were informed about the unsatisfactory outcome of their investment
and asked to rate their disappointment on a 6-point scale like the one
used in the previous study. At the end of the study, we presented a
manipulation check screen in which participants were asked to rate the
moral value of the industrial sectors with which they were presented.
Depending on the condition, a first question asked to rate the moral
value of microcredit or vivisection, whereas a second question asked to
rate the moral value of the airline sector. Since we had a neutral
asset in addition to the moral and immoral ones, this time we used a
bipolar scale ranging from −3 (“very immoral”) to 3 (“very moral”);
the midpoint was labeled “neither moral nor immoral.”
3.2 Results
Preliminary analyses and choices.
To check how the
three assets were perceived, we ran a repeated-measures analysis of
variance with asset (moral/immoral vs. neutral) as within-subject
factor, condition (moral vs. immoral) as between-subject factor, and
ratings of moral value as the dependent variable. Results revealed a
significant effect of asset, F (1, 156) = 58.52; p< .01; η 2 = .27, a
significant effect of condition, F (1, 156) = 9.89; p< .01; η 2 = .06,
and a significant interaction effect, F (1, 156) = 87.09;
p< .01; η
2 = .36. Contrast analyses showed that in
the immoral condition, there was a significant difference in moral
value between vivisection (M = −1.15; SD = 1.58) and airlines (M =
1.24; SD = 1.43), t (77) = 11.74; p< .01.
In the moral condition, despite being in the right direction, the
difference between airlines (M = .45; SD = 1.15) and microcredit (M =
.69; SD = 1.31) was not significant, t (79) = 1.22; p
= .23. Finally, microcredit was judged significantly more moral than
vivisection, t (156) = 7.99; p < .01,
whereas airlines was judged significantly more moral when paired with
the immoral sector than with the moral one, t (156) = 3.86;
p < .01.
In the moral condition, 82% (N = 66) of participants chose a portfolio
that was investing in stocks involved with microcredit (either the
moral portfolio or the mixed one), whereas in the immoral condition,
53% (N = 41) of participants chose a portfolio that was investing in
stocks involved with vivisection (either the immoral portfolio or the
mixed one). Therefore, significantly more people chose the moral
portfolio in the moral condition than the immoral portfolio in the
immoral condition, χ 2 (1, 158) = 16.19;
p< .01. Finally, motivation and disappointment
ratings correlated positively, r = .51, p<
.01.
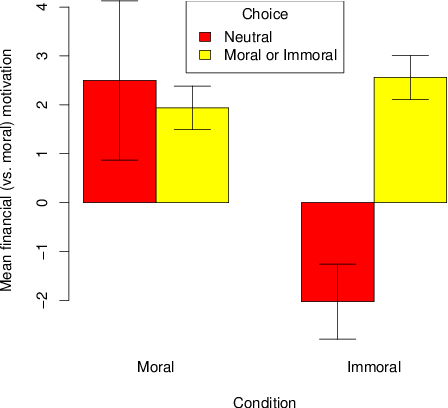
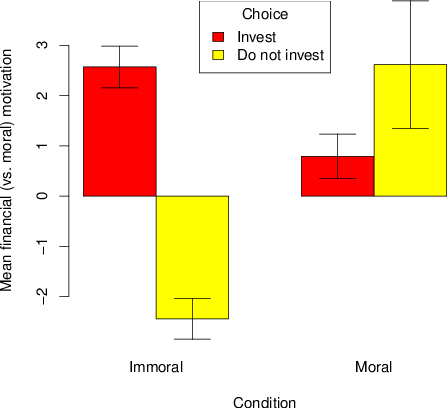
Motivation ratings
. We investigated
motivation ratings by way of a 2 (condition: moral vs. immoral) x 2
(choice: moral/immoral portfolios vs. neutral portfolio) analysis of
variance. Results revealed a significant effect of condition,
F (1, 157) = 28.83; p< .01; η
2 = .16, and a significant effect of
choice, F (1, 157) = 30.66; p< .01;
η 2 = .17. This analysis also
showed a significant interaction effect, F (1, 157) = 50.11;
p< .01; η
2 = .25 (see Figure 1).
Contrast effects revealed that participants choosing the neutral
portfolio in the immoral condition (M = −2.03; SD = 2.30) were the most
concerned with being true to their moral values: respectively,
t (154) = 10.33; p < .01 for the comparison
with participants who chose a portfolio invested in companies involved
with vivisection (M = 2.56; SD = 1.43); t (154) = 9.86;
p < .01 for the comparison with participants
choosing a portfolio invested in companies involved with microcredit (M
= 1.94; SD = 1.81); and t (154) = 7.37; p <
.01 for the comparison with participants choosing the neutral portfolio
in the moral condition (M = 2.50; SD = 2.82).
Figure 1: Average motivation ratings in Study 2 by condition
and investment choice. Lower values indicate a stronger motivation to
be true to ones’ moral values; higher values indicate a stronger
motivation to gain money (scale ranging from −4 to +4).
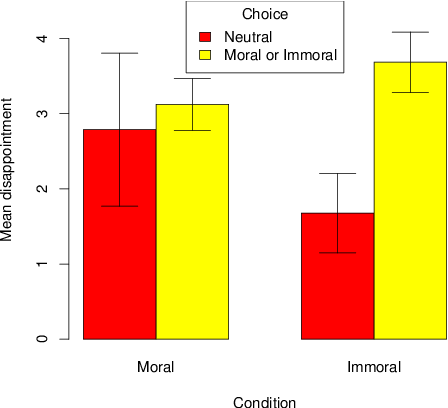
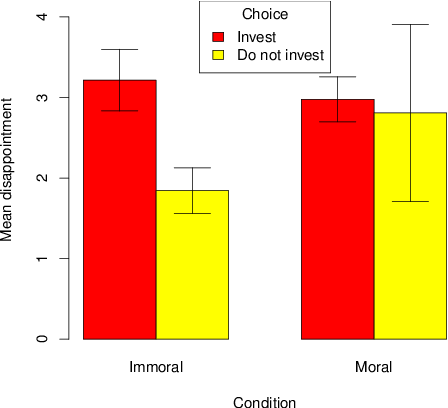
Disappointment ratings.
We investigated
participants’ disappointment by way of a 2 (condition: moral vs.
immoral) x 2 (choice: moral/immoral portfolios vs. neutral portfolio)
analysis of variance. Results revealed a significant effect of choice,
F (1, 157) = 19.00; p< .01; η
2 = .11, and a significant interaction
effect, F (1, 157) = 9.68; p< .01;
η 2 = .06. The effect of
condition was not significant, F (1, 157) = 1.04; p =
.31; η 2< .01 (see
Figure 2).
Contrast effects showed that participants choosing the neutral portfolio
in the immoral condition (M = 1.68; SD = 1.58) were those experiencing
the lowest level of disappointment: t (154) = 6.12; p
< .01 for the comparison with participants who chose a
portfolio invested in companies involved with vivisection (M = 3.68; SD
= 1.27); t (154) = 4.87; p < .01 for the
comparison with participants who chose a portfolio invested in
companies involved with microcredit (M = 3.12; SD = 1.40); and
t (154) = 2.45; p < .02 for the comparison
with participants who chose the neutral portfolio in the moral
condition (M = 2.79; SD = 1.76).
Figure 2: Average disappointment ratings in Study 2 by
condition and investment choice. Higher values indicate more intense
disappointment (scale ranging from 0 to 5).
3.3 Discussion
Study 2 was devised to assess whether people’s higher motivation to be
true to their moral values and lower disappointment depend on their
decision to invest in a moral asset or, rather, on their decision to
avoid investing in immoral assets. Results showed that participants
were significantly more motivated to behave in accordance with their
moral values when they were choosing the neutral portfolio over the
immoral one than when they were choosing the moral portfolio over the
neutral one. Therefore, we found additional support for our hypothesis
that being true to one’s moral values leads to feel less disappointment
once an investment achieves and unsatisfactory performance. However,
findings from Study 2 suggest that this is particularly true when
people did not invest in an immoral asset rather than when they decide
to invest in a moral one.
A possible problem with Study 2 is that the neutral portfolio was judged
significantly more moral when it was paired with the immoral portfolio
than when it was paired with the moral one. However, this result could
depend from the fact that the ratings of moral value were provided at
the end of the study and could have been influenced by the comparison
of the neutral asset with either the moral or the immoral one.
4 Study 3
In Study 2, participants’ decisions to avoid the immoral portfolio were
associated with a stronger motivation to be true to their moral values
than when they were choosing to invest in a moral portfolio. However,
the presence of a neutral alternative may have made the immoral asset
look excessively aversive, thus enhancing, in people’s minds, its
negative moral value. Therefore, the comparison with a neutral
portfolio could have increased participants’ moral awareness and their
motivation to invest in a way that did not require conceding their
moral values.
In Study 3, we decided to test our hypotheses in a context that should
show in an even clearer way that the reduced disappointment depends on
people’s desire to avoid making tradeoffs between their moral values
and more material rewards, such as maximizing financial gains. In this
study, participants were simply asked to choose whether they wanted to
invest or not in a specific portfolio. If the results of Study 2 did
not depend on the specific comparisons available, we should replicate
the results even when participants are asked to consider only one
portfolio.
4.1 Method
Participants.
Two hundred fifty-two participants (39%
female; mean age 29 years, SD = 9.45) took part in Study 3. They were
contacted on Amazon Mechanical Turk and paid $0.15. People who
participated in previous studies on the same subject were filtered
using TurkGate (Goldin & Darlow, 2013). Participants were randomly
assigned to one of the three experimental conditions: eighty-five
participants completed the immoral condition; eighty-two participants
completed the neutral condition; and eighty-five participants completed
the moral condition.
Materials and procedure.
Participants were presented
with the following scenario (immoral/neutral industrial sectors in
parenthesis):
Imagine you want to invest $10,000 in the stock market. Among
the many different alternatives you have looked at, you have found a
portfolio which invest in the stock of two companies that belong to the
microcredit (vivisection/airlines) industrial sector. Would you like to
invest in this portfolio?
As in Study 2, participants were provided with a definition of the
industrial sector in which was investing the portfolio they were
presented with. In each condition, after reading the scenario,
participants decided whether or not they wanted to invest. In a
subsequent screen, they rated the motivation driving their decision and
then, in another screen, their disappointment upon learning that a
different decision would have yielded a better economic outcome. In the
last screen, participants rated the moral value of the industrial
sector in which the portfolio was invested. Motivation, disappointment,
and moral value questions were the same as in Study 2.
4.2 Results
Preliminary analyses and choices.
Ratings of moral
value for each industrial sector were analyzed by way of an analysis of
variance with condition (immoral, neutral, moral) as the independent
variable. Results revealed a significant effect of condition,
F (2, 251) = 84.23; p< .01; η
2 = .40. Contrast effects, showed that the
airline sector (M = .38; SD = 1.11) fell in between the other two, and
was rated significantly different from both: respectively, t
(249) = 9.08; p < .01 for the comparison with
vivisection (M = − 1.36; SD = 1.38), and t (249) =
3.36; p < .01 for the comparison with microcredit (M
= 1.02; SD = 1.22).
In the immoral condition, 24% (N = 20) of participants chose to invest
in the portfolio composed of two vivisection companies. In the neutral
condition, 40% (N = 33) of participants decided to invest. Finally, in
the moral condition, 67% (N = 57) of participants decided to invest in
the portfolio composed of two companies involved with microcredit.
Results showed a significant difference between conditions,
χ 2 (2, 252) = 33.31;
p< .01. Significantly more people chose to invest
in the moral condition than in the neutral condition, χ
2 (1, 167) = 12.08; p<
.01, whereas significantly less people decided to invest in the immoral
condition than in the neutral one, χ
2 (1, 167) = 5.38; p = .02.
Again, motivation ratings correlated positively with disappointment
ratings, r = .51, p< .01.
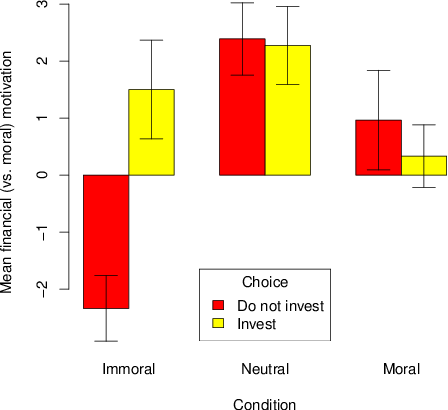
Motivation ratings.
To investigate the
motivation driving participants’ decisions in the three conditions, we
ran a 3 (condition: immoral, neutral, moral) x 2 (choice: invest, do
not invest) analysis of variance. Results revealed a significant effect
of condition, F (2, 251) = 29.38; p< .01;
η 2 = .19, and a significant
effect of choice, F (1, 251) = 12.21; p<
.01; η 2 = .05. We also found
a significant interaction effect between choice and condition,
F (2, 251) = 21.21; p < .01; η
2 = .15 (see Figure 3).
Figure 3: Average motivation ratings in Study 3 by condition
and investment choice. Lower values indicate a stronger motivation to
be true to ones’ moral values; higher values indicate a stronger
motivation to gain money (scale ranging from −4 to +4).
Contrasts showed that the immoral condition was the only one in which
the motivation of participants who invested and those who did not were
different. Participants who did not invest in the immoral portfolio (M
= −2.34; SD = 2.32) reported being significantly more interested in
being true to their moral values than those who invested (M = 1.50; SD
= 1.85), t (246) = 7.89; p< .01. Further,
participants who did not invest in the immoral condition were more
motivated by being true to their moral values compared with
participants who decided to invest in the moral portfolio (M = .33; SD
= 2.06), t (246) = 7.50; p< .01.
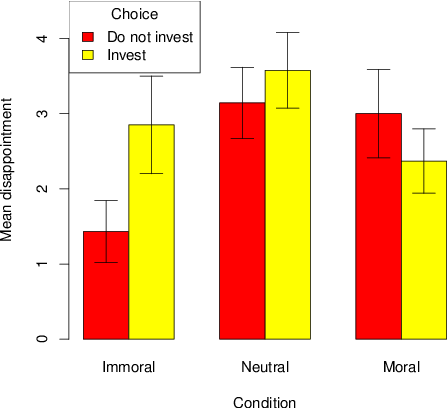
Disappointment ratings.
A 3 (condition:
immoral, neutral, moral) x 2 (choice: invest, do not invest) analysis
of variance with disappointment ratings as the dependent variable
revealed a significant effect of condition, F (2, 251) =
10.46; p< .01; η
2 = .08, and a marginally significant
effect of choice, F (1, 251) = 3.53; p = .06;
η 2 = .01. Further, we found a
significant interaction between condition and choice, F (2,
251) = 7.16; p< .01; η
2 = .06 (see Figure 4).
The immoral condition was the only one in which people who invested (M =
2.85; SD = 1.39) and those who did not invest (M = 1.43; SD = 1.66)
reported significantly different disappointment ratings, t
(246) = 3.51; p< .01, whereas in the moral
condition, the difference was only marginally significant (M = 3.00; SD
= 1.52 for participants who did not invest and M = 2.37; SD = 1.61 for
participants who invested), t (246) = 1.73; p< .09. Participants who did not invest in the immoral asset
felt significantly less disappointment when informed about the
unsatisfactory financial result than participants who invested in the
moral asset, t (246) = 3.27; p< .01.
Figure 4: Average disappointment ratings in Study 3 by
condition and investment choice. Higher values indicate a more intense
disappointment (scale ranging from 0 to 5).
4.3 Discussion
Study 3 supported again the hypothesis that people are feeling less
disappointment when investment decisions are motivated by the desire to
be true to their moral values than when the motivation is to gain
money. In this case, we replicated the findings of the previous studies
in a condition of separate evaluation in which participants could not
compare several portfolios with different levels of morality.
Therefore, we showed that it is not just the presence of less unethical
alternatives that makes investors especially sensitive to the moral
dimension of an asset.
5 Study 4
In Study 4, the goal was to control for some additional confounding
factors that may have influenced the findings of the first three
studies. For one thing, we always manipulated the moral value of the
investments by using different industrial sectors. It is possible that
the specific asset in which moral and immoral portfolios were investing
had an effect on the motivation driving participants’ decisions and the
disappointment ratings. In addition, we always presented participants
with minimal information about the portfolios, without specifying
important financial data such as the expected return. It is possible
that people would be more willing to invest in the immoral portfolio if
they have more detailed financial information that could help them set
more precise expectations about the future performance. Finally, it
could be argued that we were actually measuring participants’ regret
rather than their disappointment. Therefore, it could be useful to
compare ratings for both disappointment and regret. Study 4 was aimed
at controlling for these confounding factors and expected to replicate
the earlier findings.
5.1 Method
Participants.
Two hundred forty-four participants
(44% female; mean age 31 years, SD = 10.17) took part in Study 4. They
were contacted on Amazon Mechanical Turk and paid $0.20. People who
participated in previous studies on the same subject were filtered
using TurkGate (Goldin & Darlow, 2013). Participants were randomly
assigned to one of the two experimental conditions: one hundred three
participants completed the moral condition; one hundred forty-one
participants completed the immoral condition.
Materials and procedure.
In Study 4, participants were
presented with the following scenario (wording for the immoral
condition in parenthesis):
Imagine you want to invest $10,000 in the stock market. Among
the many different alternatives you have looked at, you have found a
portfolio of companies that belong to the technology sector. The
companies in which the portfolio is investing are currently realizing a
stream of new software and internet services that look very promising
and were met by very positive reviews in the media.
These companies established their factories in America and
have never outsourced the production of any of their products. In
addition, they have always been against child labor and they are
regarded as some of the companies offering the best social and
economical conditions for their employees. (However, these companies
have also been criticized in the media because of their outsourcing
practices and for taking advantage of child labor in the factories
of their East-Asian contractors. Violations of the workers basic
human rights in the factories abroad have been demonstrated several
times already.)
Technical information about the portfolio:
Mean stock value for the companies in which the portfolio invests:
$12.47
Mean Beta: 0.90
Expected return of the portfolio for the next 12 months: 5%
Would you like to invest in this portfolio?
Participants were asked to decide whether or not they wanted to invest
in the portfolio they were presented with. Then, in a separate screen,
they were asked to rate the motivation driving their investment
decision (the scale was the same as in previous studies) and also to
provide an estimate of the expected return of the portfolio. This
question was presented in order to test and control for the possibility
that financial expectations varied as a function of the moral nature of
the fund, and these expectations, rather than the moral value, account
for the differences in motivation and regret. In a subsequent screen,
upon learning that a different decision would have yielded a better
economic outcome, participants rated both their disappointment and
their regret (in both cases the responses were provided on a scale
ranging from 1 to 5). Finally, participants rated the moral value of
the technological companies in which the portfolio was invested. In
particular, this question asked about the way these companies were
managing the production of their products (taking advantage of
outsourcing strategies or not) and the working conditions of their
employees.
5.2 Results
Preliminary analyses and choices.
Ratings of moral value
were analyzed by way of t-test with condition (moral vs. immoral) as
the independent variable. Results revealed a significant effect of
condition (Mmoral = 2.01, SD =
1.29 versus Mimmoral = − 1.87,
SD = 1.21), t (243) = 24.07;
p< .01. In the immoral condition, 36% (N = 51) of
participants chose to invest in the portfolio, whereas, in the moral
condition, 87% (N = 90) of participants decided to invest
(χ 2 (1, 244) = 63.98;
p< .01, for the difference). An analysis of
variance 2 (condition: moral vs. immoral) x 2 (choice: invest vs. do
not invest) with the evaluation of the 1-year expected value as
dependent variable showed only a not-quite significant effect of
choice (Minvest = 10.24, SD =
19.24 versus Mnotinvest = 6.13,
SD = 5.84), F (1, 243) = 5.04;
p = .08; η 2 = .01,
whereas the effect of the condition was not significant, F
(1, 243) = .29; p = .59; η
2< .01. Finally, the
interaction was not significant, F (1, 243) = .23; p
= .63; η 2< .01.
Disappointment and regret ratings were highly positively correlated,
r = .72, p < .01, therefore they were
averaged together. This new disappointment variable correlated
positively with motivation, r = .45, p <
.01.
Motivation ratings.
To investigate the
motivation driving participants’ decisions in the two conditions, we
ran a 2 (condition: moral, immoral) x 2 (choice: invest, do not invest)
analysis of variance. Results revealed a significant effect of
condition, F (1, 243) = 24.25; p< .01;
η 2 = .09, and a significant
effect of choice, F (1, 243) = 22.88; p<
.01; η 2 = .09. In addition,
we also found a significant interaction effect between choice and
condition, F (1 243) = 105.42; p < .01;
η 2 = .31 (see Figure 5).
Participants who did not invest in the immoral portfolio reported
being the most interested in being true to their moral
values. Contrast effects showed that the difference was significant
for the comparison between participants who did not invest in the
immoral portfolio (M = −2.44; SD = 1.94) and participants who
invested in the immoral asset (M = 2.57; SD = 1.47), t (240)
= 17.27; p< .01. The difference was also
significant for the comparison with participants who did not invest in
the moral portfolio (M = 2.62; SD = 2.10), t (240) = 8.19;
p< .01. Finally, participants who did not invest
in the immoral portfolio were also more interested in being true to
their moral values than participants who invested in the moral asset
(M = .79; SD = 2.12), t (240) = 10.67; p<
.01. Adding participants’ estimates of the 1-year expected return of
the portfolio as a covariate did not change the results and the
covariate had no significant effect on the motivation driving
investment decisions (p = .86).
Figure 5: Average motivation ratings in Study 4 by condition
and investment choice. Lower values indicate a stronger motivation to
be true to ones’ moral values; higher values indicate a stronger
motivation to gain money (scale ranging from −4 to +4).
Disappointment ratings.
A 2 (condition:
immoral, moral) x 2 (choice: invest, do not invest) analysis of
variance with the combined disappointment measure as the dependent
variable revealed a significant effect of choice, F (1, 243) =
10.61; p< .01; η
2 = .04, and a significant interaction
between condition and choice, F (1, 243) = 6.44; p< .02; η 2 = .03.
The effect of condition was not significant, F (1,243) = 2.35;
p = .13; η 2 = .01
(see Figure 6).
Figure 6: Average disappointment and regret ratings combined by
condition and investment choice in Study 4. Higher values indicate a
more intense disappointment (scale ranging from 0 to 5).
Participants who did not invest in the immoral portfolio reported the
lowest disappointment (M = 1.84; SD = 1.35). Contrast effects showed
that the difference was significant when comparing the disappointment
ratings of these participants with the disappointment of those who
invested in the immoral portfolio (M = 3.22; SD = 1.36), t
(240) = 5.70; p< .01. A significant effect was also
found when comparing participants who did not invest in the immoral
portfolio and those who did not invest in the moral one (M = 2.81; SD =
1.82), t (240) = 2.36; p< .02. Finally,
there was a significant effect even for the comparison with
participants who invested in the moral portfolio (M = 2.98; SD = 1.33),
t (240) = 5.54; p< .01. Adding
participants’ estimates of the 1-year expected return of the portfolio
as a covariate did not change the results and the covariate had no
significant effect on participants’ disappointment (p = .22).
5.3 Discussion
The results of Study 4 supported the hypothesis even in a condition in
which the portfolio was invested in the same industry in both the moral
and immoral conditions. This means that the results found in the
previous studies were not influenced by the different sectors presented
in the moral and immoral conditions. Finally, the results of Study 4
showed that the effect was replicated despite the fact that in both
conditions participants received the same financial information
(expected return), therefore showing that the impact of the moral value
of an asset goes beyond the simple evaluation of the economic utility
of the investment.
6 General discussion
The present paper had the main goal of empirically demonstrating that
investors are not exclusively interested in obtaining high gains,
although the outcome of investments is certainly important. Further, we
expected to find that people who are more motivated to be true to their
moral values should have experienced lower disappointment upon learning
that a different investment decision could have yield a better outcome.
In Study 1, we contrasted a moral portfolio invested in companies
involved with fair trade and an immoral portfolio invested in companies
involved with pornography, finding that participants choosing the moral
portfolio where more likely to do so because they wanted to be true to
their moral values. In turn, these participants felt also lower
disappointment, therefore demonstrating that having other motivations
beyond the simple financial results can help them to cope with
unsatisfactory investment performance. These results lend empirical
support to Statman’s (2004) model of utilitarian and expressive
benefits of investments and extended it by showing that the goal
pursued by an investor can influence the way financial outcomes are
evaluated. Therefore, not only the motivation behind investment
decisions is not exclusively driven by a desire to achieve high
returns, but the evaluation of the financial performance is influenced
by non-financial dimensions, too.
In Study 2, we replicated our findings in a condition in which moral and
immoral assets were not directly compared but were presented along with
a (relatively) more neutral asset. Subsequently, Study 3 lend support
for our hypothesis in a context in which the moral and immoral assets
were presented separately, that is without being compared with any
other asset. Both in Studies 2 and 3, participants who did not invest
in the immoral portfolio reported being more interested in being true
to their moral values rather than maximizing the financial outcome, and
reported a lower disappointment upon learning that a different decision
would have yielded a better economic outcome. These findings support
the results found in Study 1, highlighting that people chose the moral
outcome because they wanted to be true to their moral value and did so
to avoid the immoral asset.
Finally, in Study 4, we replicated our findings even presenting
participants with the same industrial sector in both the moral and
immoral conditions and stating explicitly the expected return of the
portfolio. In this way, we were able to show that the findings did not
depend on the specific industrial sectors used in the moral and immoral
conditions in the previous three studies. Study 4 also demonstrated
that this effect is independent from investors’ inferences about the
expected return of moral and immoral assets.
Nevertheless, unanswered questions remain for future research. For
instance, we always used the framing of a forgone gain, since
participants were informed that in making a different choice they could
have gained more money. We obviously are aware of the strong impact
that a different framing used to report a financial outcome could have
on people’s judgments. Therefore, future research should investigate
whether the same results can be replicated when investors are presented
with actual losses. Furthermore, it might be interesting to test
whether investors who care about being true to their moral values would
feel even happier when their investments achieve positive returns. In
addition, we did not ask about disappointment/regret when the
supposedly moral investment did not achieve its moral goals, or when
the moral or neutral investment was revealed to be corrupt.
A limit of the present work is that we used only hypothetical scenarios.
It would be interesting to test the same hypotheses with real
investment choices, since the investment decision was also very simple,
and participants had to choose between just a few portfolios, whereas
in real financial markets investors can choose from hundreds of
different investment alternatives. In addition, in Study 4, we compared
moral and immoral conditions in which the financial information (e.g.,
expected return) was the same. It would be interesting to test whether
an investor would be willing to avoid an immoral asset even when this
alternative is characterized by a higher expected return or when the
moral asset is riskier. Survey studies can help provide some answers to
these questions. The success of best of sector ethical funds shows that
investors are willing to pay higher transaction costs for the only
benefit of investing in a fund branded as socially responsible (Beal et
al., 2005). Still, we believe that more research pointed at answering
these questions is needed.
Another limit concerns our comparisons of the effect of moral vs.
neutral and immoral vs. neutral. Although we generally found that
immorality mattered more than morality, we did not attempt to equate
the degree of perceived morality (vs. neutral) with the degree of
perceived immorality. It is possible, for example, that the immoral
investments were viewed as strongly immoral by everyone while the
moral ones were not seen as particularly superior by some subjects.
Despite the aforementioned limits, the studies described in this paper
have an important applied value since the lower disappointment felt by
investors who stay true to their moral values can potentially
exacerbate some investment mistakes. Previous work showed that people’s
affective reactions have a strong impact on their investment decisions
(Lucey & Dowling, 2005). For instance, presenting returns in a larger
numerical format (- 19%) induced people to feel a more intense feeling
of disappointment and to sell their investment more often compared to a
group of people who saw the same return reported using a smaller
numerical format (- 0.19; Rubaltelli, Rubichi, Savadori, et al., 2005).
Similarly, when non-financial motivations reduce the disappointment
experienced by investors, their motivation to sell may be weakened
leading them to hold on to a losing investment for too long, thus
increasing the disposition effect (Shefrin & Statman, 1985; Barberis
& Xiong, 2009, 2012).
To sum up, the main contribution of the present work was to demonstrate
that people who decide to be true to their moral values when investing
in the stock market experience a lower disappointment than people whose
main motivation is to invest to get a financial benefit. These results
extend Statman’s (2004) model of utilitarian and expressive benefits of
investment by showing more precisely when a non-financial dimension of
investments (in our case the moral value of an asset) is incorporated
in the investors’ decision and when it influences their evaluation of
financial outcomes. Concern for the moral value of one’s investment
decisions can offer a different point of view along which people can
evaluate a financial outcome, and offers a cushion that makes
unsatisfactory returns feel less disappointing.
References
Barberis, N., & Xiong, W. (2009). What drives the disposition effect?
An analysis of a long-standing preference-based explanation.
Journal of Finance, 64, 751–784.
http://dx.doi.org/10.1111/j.1540-6261.2009.01448.x.
Buhrmester, M. D., Kwang, T., & Gosling, S. D. (2011). Amazon’s
Mechanical Turk: A new source of inexpensive, yet high-quality, Data?
Perspectives in Psychological Science, 6, 3–5.
http://dx.doi.org/10.1177/1745691610393980.
Grossman, B. R., & Sharpe, W. F. (1986). Financial implications of
South African divestment. Financial Analysts Journal, 42,
15–29. http://dx.doi.org/10.2469/faj.v42.n4.15.
Lease, R. C., Lewellen, W. G., & Schlarbaum, G. G. (1976). Market
segmentation: Evidence on the individual investor. Financial
Analysts Journal, 32, 53–60. http://dx.doi.org/10.2469/faj.v32.n5.53.
Lewellen, W. G., Lease, R. C., & Schlarbaum, G. G. (1977). Patterns of
investment strategy and behavior among individual investors.
Journal of Business, 50, 296–333.
http://dx.doi.org/10.1086/295947.
Nagy, R. A., & Obenberger, R. W. (1994). Factors influencing individual
investor behavior. Financial Analysts Journal, 50, 63–68.
http://dx.doi.org/10.2469/faj.v50.n4.63.
Paolacci, G., Chandler, J., & Ipeirotis, P. G. (2010). Running
experiments using Amazon Mechanical Turk. Judgment and Decision
Making, 5, 411–419.
Rubaltelli, E., Rubichi, S., Savadori, L., Tedeschi, M., & Ferretti, R.
(2005). Numerical information format and investment decisions:
Implications for the disposition effect and the status quo bias.
Journal of Behavioral Finance, 6, 19–26.
http://dx.doi.org/10.1207/s15427579jpfm0601\_4.
Shefrin, H., & Statman, M. (1985). The disposition to sell winners too
early and ride losers too long: Theory and evidence. Journal of
Finance, 40, 777–790.
http://dx.doi.org/10.1111/j.1540-6261.1985.tb05002.x.
Warren, W. E., Stevens, R. E., & McConkey, C. W. (1990). Using
demographic and lifestyle analysis to segment individual investors.
Financial Analysts Journal, 46, 74–77.
http://dx.doi.org/10.2469/faj.v46.n2.74.
Williams, G. (2007). Some determinants of the socially responsible
investment decision: A cross-country study. Journal of
Behavioral Finance, 8, 43–57.
http://dx.doi.org/10.1080/15427560709337016.
Department of Developmental
Psychology and Socialization, University of Padova,
Via Venezia 8, 35131 Padova - Italy.
Email: enrico.rubaltelli@unipd.it.
Best of sector “ethical funds” are funds that
invest on any industrial sectors but picking only the companies with
the best records on the environment and human rights in each
sector. In other words, a best of sector “ethical fund” can invest
on oil companies but it will select only those with the best
socially responsible records. It will not exclude an entire sector
just because its business is judged not socially
responsible. Compared to a mutual fund, best of sector “ethical
funds” have higher transaction costs since they entail additional
managing activities related to the selection of specific companies
(the most responsible ones) within each industrial sector.
We use the term “disappointment”
because that is what we asked our subjects. Technically, “regret”
may be a better term, because we ask subjects to compare the outcome
to that of another option rather than another state of the world. In
Study 4 we ask about both.
The definitions of the three industrial sectors were
the following: microcredit: this industrial sector is involved with the
act of lending a small amount of money at low interest to small
businesses in the developing world; vivisection: this industrial sector
is involved with the practice of performing operations on live animals
with the purpose of experimentation or scientific research; airlines:
this industrial sector includes companies that provide air transport
services for traveling passengers and freight.