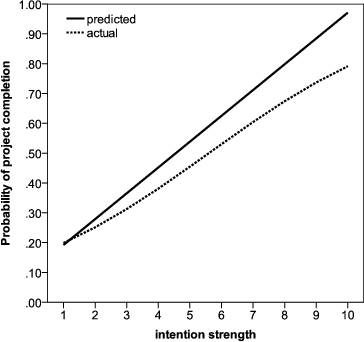
| Figure 1: Regression curves showing self-predicted and actual probability of project completion as a function of intention strength, in Study 1 (Hardware Store). |
Judgment and Decision Making, Vol. 9, No. 3, May 2014, pp. 207-225
On the psychology of self-prediction: Consideration of situational barriers to intended actionsConnie S. K. Poon* Derek J. Koehler# Roger Buehler\% |
When people predict their future behavior, they tend to place too much weight on their current intentions, which produces an optimistic bias for behaviors associated with currently strong intentions. More realistic self-predictions require greater sensitivity to situational barriers, such as obstacles or competing demands, that may interfere with the translation of current intentions into future behavior. We consider three reasons why people may not adjust sufficiently for such barriers. First, self-predictions may focus exclusively on current intentions, ignoring potential barriers altogether. We test this possibility, in three studies, with manipulations that draw greater attention to barriers. Second, barriers may be discounted in the self-prediction process. We test this possibility by comparing prospective and retrospective ratings of the impact of barriers on the target behavior. Neither possibility was supported in these tests, or in a further test examining whether an optimally weighted statistical model could improve on the accuracy of self-predictions by placing greater weight on anticipated situational barriers. Instead, the evidence supports a third possibility: Even when they acknowledge that situational factors can affect the likelihood of carrying out an intended behavior, people do not adequately moderate the weight placed on their current intentions when predicting their future behavior.
Keywords: self-prediction, intention, optimistic bias.
The present research examines people’s attempts to predict whether they will engage in desired future behaviors. Imagine, for example, that your spouse or roommate has asked whether you will be able to paint the living room before house guests arrive next month. Although you are committed to the project and intend to tackle it soon, you realize that, despite your best intentions, you may encounter situational “barriers” that prevent you from getting the job done. So how do you answer the question? What is the likelihood that you will actually complete the project? The present research examines how people arrive at self-predictions in contexts such as this, and specifically how they balance current intentions to perform a behavior with potential barriers to completion of the behavior.
People often try to predict their own future actions and outcomes, and these self-predictions can have widespread personal and social consequences. Given that many important choices and decisions are based on people’s beliefs about what they will do in the future, errors in self prediction can be costly. For example, if people overestimate their future accomplishments, this could result in disappointment, broken promises, and decisions that are later regretted. Nevertheless, despite the potential benefits of accurate self-prediction, a wealth of research indicates that people’s predictions about their future behavior and outcomes are often inaccurate and, in many cases, tend to be overly optimistic (for reviews see Armor & Taylor, 1998; Dunning, 2007). Individuals hoping to finish a future task promptly underestimate the time it will require (Buehler, Griffin, & Peetz, 2010) and those seeking to improve their personal finances underestimate their future spending (Peetz & Buehler, 2009) and overestimate future savings (Koehler, White, & John, 2011). People also overestimate the likelihood that they will have long and happy relationships (MacDonald & Ross, 1999), land high paying jobs (Hoch, 1985), perform well on tests and exams (Gilovich, Kerr, & Medvec, 1993; Shepperd, Ouellette, & Fernadez., 1996; Helzer & Dunning, 2012), give generously to charity (Epley & Dunning, 2000), donate blood (Koehler & Poon, 2006; Tanner & Carlson, 2009), vote in upcoming elections (Epley & Dunning, 2006), and engage in healthy behaviors (Lipkus & Shepperd, 2009). In short, people tend to believe that they are more likely to engage in personally desirable, or intended, future behaviors than is actually the case.
Researchers have identified a number of cognitive and motivational processes that can give rise to overly optimistic self-predictions. People may form optimistic predictions, in part, because they adopt an “inside approach” where they focus on constructing a mental model of the specific target event, such as an imagined scenario of the event unfolding, rather than an “outside approach” where they base predictions on a set of relevant past experiences (Buehler et al., 2010; Dunning, 2007; Epley & Dunning, 2000; Kahneman & Lovallo, 1993). The problem with the inside approach is that mental representations of future events tend to be idealized, schematic, and oversimplified (Dunning, 2007), and do not account for the myriad alternative ways in which an event could unfold (Hoch, 1985; Griffin, Dunning, & Ross, 1990; Newby-Clark et al., 2000). Optimistic predictions may also reflect processes of motivated reasoning (Kunda, 1990) or desirability bias (Krizan & Windschitl, 2007) wherein people focus selectively on information that supports a particular, preferred conclusion. As a consequence, self-predictions may be unduly influenced by personal goals and aspirations salient at the time of prediction (e.g., Buehler, Griffin, & MacDonald, 1997; Helzer & Dunning, 2012; Peetz & Buehler, 2009).
A theoretical framework developed by Koehler and Poon (2006) complements and extends the previous accounts by focusing on the role of intention in self prediction. This framework is especially pertinent to predictions concerning behaviors that people are committed to performing and that are largely under their personal control — such as the living-room painting project in the opening example. This framework has practical value because it specifies when people will be most prone to making overly optimistic self-predictions, and suggests strategies for avoiding this bias.
According to Koehler and Poon (2006), when assessing how likely they are to carry out some future behavior, people start with, and consequently overweight, the strength of their current intentions to carry out the target behavior. Of course intention strength — that is, the extent to which the individual feels committed to carrying out the target behavior — can be a useful cue in predicting the likelihood of future behavior. Extensive research based on the theory of planned behavior (Ajzen, 1991; Ajzen & Madden, 1986) has shown that, generally, the stronger one’s current intention to perform a behavior the more likely it is that the behavior will be carried out in the future. However, this research also indicates that the predictive validity of current intentions is far from perfect; a substantial amount of variance in behavior remains unexplained by intentions (Armitage & Conner, 2001; Rhodes & Dickau, 2012; Sutton, 1998; Webb & Sheeran, 2006).
Several factors may limit the predictive validity of people’s current intentions. For one thing, the strength of people’s intentions may change after generating their predictions, and to the extent that intention strength is not stable across time it cannot be a valid predictor (Ajzen & Fishbein, 1974; Sutton, 1998). In addition there are many external, situational, or contextual factors that are largely unrelated to the strength of intentions, but could greatly influence the likelihood of completing the target activity. Koehler and Poon (2006) describe such factors as influencing the “translatability” of intentions into action. Some of these factors facilitate the intended behavior, falling into a category that Lewin (1951) described as “channel factors” (Ross & Nisbett, 1991), a classic example being the provision of a map to students following a persuasive appeal to participate in a tetanus inoculation program (Leventhal, Singer & Jones, 1965). Other factors present barriers to completion of the behavior, such as task difficulty, lack of necessary resources, interruptions, and competing demands for one’s time. To the extent that such factors are operating, people’s intentions at the time of prediction may be only a weak determinant of their subsequent behavior.
According to Koehler and Poon (2006), because an evaluation of current intention serves as a natural starting point in the self-prediction process, people’s self-predictions typically overweight intention strength and underweight factors that influence the ease with which intentions are translated into action. Using the terminology of Kahneman and Frederick (2002), people use current intention strength as a readily available, easily evaluated “heuristic attribute” in forming self-predictions. This heuristic attribute tends to be substituted for the more difficult judgment of the “target attribute”, that is the probability of the target behavior. Adjustments may then be made in light of additional factors that influence behavior to the extent that they are recognized as relevant, but such adjustments are likely to be insufficient. As a result, current intention strength will be overweighted relative to its impact on the future behavior being predicted, and predictive factors unrelated to current intention strength will be underweighted. Another implication of this account is that, when — as is typically the case — current intentions have only moderate predictive validity, self-predictions based on strong intentions will typically be too optimistic.
Consistent with this theorizing, a set of studies by Koehler and Poon (2006) demonstrated that people’s predictions of the likelihood that they will engage in a behavior (donating blood, participating in a future experiment) corresponded very closely to their ratings of intention strength at the time of prediction, but the actual probability of the target behavior did not increase with intention strength to the extent implied by self-predictions. Furthermore, manipulations that increased intention strength had a larger impact on self-prediction than on the actual behavior, whereas manipulations designed to increase the ease with which intentions are translated into behavior had a larger impact on actual behavior than on prediction. For example, in one experiment participants estimated the probability they would participate in a future web-based survey to help out a student research project. A subset of participants told that their participation was crucial to the student’s ability to complete the project (vs. merely helpful) reported stronger intentions to participate and predicted that it was more likely they would do so; however this manipulation had relatively little impact on actual participation rates. In contrast, providing participants with a reminder to participate in the experiment just before it began had little effect on their estimates of the likelihood they would participate, but a substantial effect on their actual behavior.
The main objective of the present research was to examine how potential barriers to intended action are, or are not, considered when people make self-predictions. Consideration of such barriers is important because, no matter how strongly a person intends to carry out an intended behavior, there is always the possibility of encountering circumstances that prevent completion of the behavior. The observation from previous research that self-predictions tend to be overly optimistic for behaviors that people strongly intend to carry out suggests that, for one reason or another, such barriers may not be given sufficient weight in the self-prediction process.
We focus on two broad types of barriers to intended action: obstacles and competing demands. While participants were left to their own interpretations, the distinction we had in mind was that obstacles are inherently part of the process of completing the target behavior, while competing demands from other activities are external to the target activity but nonetheless influence the likelihood of completing it. For instance, if the target behavior is painting the living room next weekend, running out of paint or having to wait longer than expected for the first coat to dry before applying the second would be examples of obstacles, while having to spend much of the weekend completing a tax return or attending a family event would be examples of competing demands. We characterize such barriers (obstacles and competing demands) as factors that complicate the relation between current intentions and later behavior.
Making self-predictions accurately requires appropriate adjustment for potential barriers. In the present research, we evaluate three hypotheses regarding ways in which potential barriers to intended behavior may fail to exert adequate influence on self-predictions. The first two hypotheses concern inadequate direct adjustment of self-predictions for anticipated barriers, due either to neglect or discounting of their potential impact. The third hypothesis concerns indirect adjustment to self-predictions, in which the weight placed on current intentions is not sufficiently adjusted for the ways in which various situational factors (including potential barriers) can weaken the relation between current intentions and later behavior.
Self-predictions may tend to focus exclusively on current intentions, ignoring the potential impact of barriers to completing the intended behavior. That is, people may be able to accurately anticipate potential barriers when asked to do so prospectively, but may not spontaneously consider them in making self-predictions, which might for instance instead rely exclusively on current intentions. We test this possibility in the reported research with experimental manipulations designed to draw greater attention to potential barriers before self-predictions are elicited. If inattention to potential barriers is playing a role, such manipulations would be expected to increase the weight placed on prospective barriers and hence decrease self-predictions (and associated optimistic bias) of target behavior completion.
Alternatively, potential barriers may be considered as part of the self-prediction process but their anticipated impact could be underestimated or discounted, for instance through mechanisms of motivated reasoning. We test this possibility directly in Study 2 by comparing prospective — and hence potentially discounted — ratings of potential barriers with retrospective — and hence potentially more realistic — ratings collected after the opportunity to complete the target behavior had passed.
Another way we test H1 and H2, jointly, is through the construction of statistical prediction models that place optimal weight on ratings of potential barriers in predicting the probability of the target behavior being successfully completed. Under either H1 or H2, such models — because they correct for inattention to or discounting of potential barriers — would be expected to outperform intuitive self-predictions in predicting the probability of the target behavior.
Finally, self-predictions may place too much weight on current intentions despite the inherent unpredictability reflected in the typically modest correlation between current intentions and later behavior. As in Kahneman and Tversky’s (1973) seminal work on the psychology of intuitive prediction, self-predictions may be based on an evaluation of current intention strength without regard to its validity as a predictive cue (what Kahneman and Tversky referred to as “prediction by evaluation”). Such a process could yield overly optimistic self-predictions in the presence of strong intentions even when potential barriers are not ignored or discounted in direct evaluations (e.g., even when the individual acknowledges, upon being asked explicitly about such barriers, that they could have some impact). In that case, we should continue to see systematic overweighting of current intentions that is not influenced, for instance, by manipulations drawing attention to potential barriers, even when such manipulations are shown to increase — in direct ratings — their anticipated impact.
To date, very few studies have directly tested H3 by comparing predicted and actual changes in the likelihood of future behavior as a function of intention strength as rated at the time of prediction. The first direct evidence came from a study (Koehler & Poon 2006, Study 1) comparing university students’ self-predicted and actual rates of blood donation at an on-campus clinic. Self-predictions were obtained approximately two weeks in advance of the clinic, and the overall rate of actual blood donation in the sample (20\%) was quite low. Results consistent with overweighting of current intentions were also reported by Koehler, White, and John (2011, Experiment 1) in a study of university students’ savings goals, although these researchers did not directly compare regressions of self-predictions and actual behaviors on intention strength. We sought to broaden the evidence pertaining to overweighting of intentions in self-predictions by examining a wider variety of target behaviors, and by studying self-predictions elicited from a more demographically diverse set of participants, than has been done in previous studies.
Study 1 concerned household and gardening projects, and involved shoppers who were leaving a hardware store with the necessary supplies. Participants were asked to estimate the probability that they would complete the project within 30 days, and also evaluated the strength of their current intentions to do so. Some participants were asked to consider potential obstacles to completion of the project, and competing demands from other activities, before making their self-predictions. Our main question was whether drawing attention to these potential barriers, compared to a condition in which self-predictions and intention strength ratings were made before the request to consider them, would affect the self-predicted probability of completing the project within the next 30 days.
In contrast to Study 1, in which participants had already taken a first step toward completing the target project (by going to the hardware store to purchase supplies), in Study 2 we asked telephone-survey respondents to identify a project or activity they wished to carry out within the next three months but had not yet taken any concrete steps toward completing. By extending the forecast horizon from 30 days to 3 months, and focusing on projects that had not yet been started, we thought there would be more room than in Study 1 for variance in both self-predictions and actual outcomes, and in perceptions of potential barriers as well. Study 2 also broadened our investigation by looking not just at household projects (such as those investigated in Study 1), which for many people represent an unpleasant obligation rather than an enjoyable pastime, but also at leisure activities such as taking a weekend getaway. It is possible that the tendency to overweight current intentions when making self-predictions is limited to the case of obligations, that is, tasks people feel they should complete even though they do not necessarily want to do. A third goal of the study was to investigate the role of demographic variables, specifically sex and age, as they relate to self-predictions, intentions, and target activity completion. One question of particular interest was whether, compared to younger people, older people are less prone to overweight current intentions when predicting their future behavior. One might expect such a result if older people have accumulated more experience, or developed greater self-insight, in recognizing that later behavior does not always coincide with initial intentions.
In these studies, we report all data exclusions, all manipulations, and all measures. Sample sizes were determined in advance, based informally on our intuitive estimates of likely response and attrition rates.
Study 1 took place at a large hardware and building supply store, which was part of a national chain. Shoppers were approached by a female experimenter as they exited.1 the store, and were asked if they were making purchases for “a home or gardening project that you will be working on in the next month.” Those who answered yes were invited to participate in the study, in appreciation for which they would be entered in a draw to win a $100 gift certificate to a local restaurant. The entire interview was conducted orally, with responses recorded in writing by the experimenter. Of the 211 participants for whom we had initial self-predictions, 192 (91\%) consented to be contacted for the follow-up interview (by phone or email). Of the 192 participants who consented to being re-contacted, we were able to obtain follow-up (outcome) data from 130 (68\%). Participants for whom we were able to collect outcome data did not differ from those for whom we were not in their responses to any of the questions posed in the initial survey (self-predictions, intentions, obstacles, competing demands, etc.).
Participants in Study 2 were adult residents of Waterloo Region, Ontario, Canada. We used a random sampling procedure to select a total of 908 names and addresses from the residential section of the local telephone directory. An information letter was then sent to each of the selected households describing the purpose and nature of the study. To encourage participation, potential participants were told that all survey respondents would be entered in a draw for several $50 gift certificates. Approximately one week after mailing the information letter, we conducted the initial telephone interview. From the potential sample of 908 households, we were able to contact 649 adult residents of whom 314 (48\%) agreed to participate. Of the 314 participants who completed the initial telephone survey, 266 (85\%; 160 females, 106 males) also completed the follow-up survey. Respondents from the initial survey who did and did not complete the follow-up interview did not differ significantly with respect to any of the activity ratings from the initial survey (self-predictions, intentions, obstacles, competing demands, etc.). In terms of age, the final sample included participants in their teens (n=10), 20s (n=43), 30s (n=61), 40s (n=66), 50s (n=46), 60s (n=15), 70s (n=14), and older (n=4), as well as 7 participants who did not report their age.
In Study 1, participants were asked to name or briefly describe the project for which they were shopping, and then were asked a number of questions regarding that project.2
In Study 2, the interviewer asked participants to identify a specific project or activity that they were hoping to complete within the next three months. We varied the type of target activity by randomly assigning participants to identify either a household project (e.g., a repair or renovation, a change in the interior design or furnishing of their home, a major cleaning or organization project, or a lawn or gardening project) or a leisure activity (e.g., attending an arts or cultural event, travel such as a get-away weekend, or some kind of sporting or recreational activity). Participants were further instructed that the target activity should not be something that was already started or scheduled, or something that was part of their regular routine.
Participants were asked [in Study 1/Study 2], “How likely do you think it is that you will actually complete this [project/activity] within the next [30 days/3 months]? Please give your estimate as a probability between 0\%, meaning that you are certain you will NOT actually do so within the next [30 days/3 months], and 100\%, meaning that you are certain that you WILL actually do so within the next [30 days/3 months].” Participants were encouraged to give ratings rounded to the nearest 10\%, which is the form in which they were recorded by the experimenter.3
Participants in Study 1 were asked, “On a scale from 1 to 10, where 1 means “strongly disagree” and 10 means “strongly agree,” to what extent do you agree with the following statement? Right now, as I think about it, I very strongly intend to complete this [project/activity] within the next 30 days.” Participants in Study 2 were asked the same question, except the statement was read to them before the instructions regarding the response scale.
Participants were asked to rate their agreement, using the same scale as the intention strength item, with the statement, “As much as I might intend to complete this [project/activity], there are likely to be difficulties or obstacles that arise in carrying out the [project/activity] itself that could prevent me from actually doing so over the next [30 days/few months].”
Participants were asked to rate their agreement, on the same scale used for the two items above, with the statement, “As much as I might intend to complete this [project/activity], there are likely to be other things in my life that compete for my time or could otherwise prevent me from actually [completing the project over the next 30 days/doing so over the next few months].”4
By random assignment, some participants made their self-predictions before rating potential barriers (obstacles and competing demands); other participants evaluated the potential barriers before making their self-predictions. This allows us to test whether drawing attention to potential barriers, by the explicit request to evaluate them, influences self-predictions.
In Study 1, specifically, both self-predictions and intention strength ratings were elicited either before or after the obstacle and competing demands ratings. Obstacles were always rated before competing demands, while the order in which the self-predictions and intention strength ratings was counterbalanced within each condition. In Study 2, the self-prediction item was either the first question asked (before all other items, including intentions, obstacles, and competing demands) or the very last (after all the other items). The remaining items were presented in one of four pseudo-random orders.
Participants were re-contacted either 30 days (Study 1, by phone or email) or three months (Study 2, by phone) after making their self-predictions. They were reminded of the activity or project about which they had been interviewed, and were asked whether they had in fact completed it. Those who reported having completed the project/activity were also asked when they had completed it; those who reported not having completed the project/activity were asked to indicate how much progress (expressed as percent completed) had been made to date. The latter respondents were also given the opportunity to briefly explain why the project had not yet been completed. In the analyses reported here we focus exclusively on the simple dichotomous outcome variable indicating that the participant either did or did not complete the project/activity within the designated time period.
Table 1: Descriptives and intercorrelations among dependent variables in Studies 1 and 2, among all participants from whom we collected predictions, and among the subset from whom we were also able to obtain outcome (self-reported behavior) data.
STUDY 1: Hardware Store Predictions (N=211) Variable Mean SD 1 2 3 1. intention rating 9.36 1.72 2. judged probability 90.92 19.63 .807** 3. obstacles 3.39 2.81 -.147* -.238** 4. competing demands 4.24 2.90 -.252** -.345** .567** Outcomes (N=130) Variable Mean SD 1 2 3 4 1. intention rating 9.42 1.46 2. judged probability 92.04 17.23 .734** 3. obstacles 3.27 2.81 -.320** -.343** 4. competing demands 4.07 2.83 -.278** -.331** .556** 5. behavior 0.75 0.43 .224* .359** -.210* -0.164 STUDY 2: Phone Survey Predictions (N=314) Variable Mean SD 1 2 3 1. intention rating 7.85 2.36 2. judged probability 66.60 29.42 .648** 3. obstacles 5.88 3.02 -.253** -.306** 4. competing demands 6.32 2.92 -.276** -.306** .627** Outcomes (N=266) Variable Mean SD 1 2 3 4 1. intention rating 7.96 2.31 2. judged probability 66.98 29.17 .626** 3. obstacles 5.82 2.99 -.265** -.332** 4. competing demands 6.30 2.87 -.280** -.321** .621** 5. behavior 0.31 0.46 .217** .290** -.130* -.173** * p<.05, ** p<.01, 2-tailed.
In Study 2, the interviewer also obtained several retrospective assessments corresponding to the prospective ratings obtained during the initial survey (identical in wording, except now written in the past tense), including the impact of obstacles and competing demands. Each of the ratings was made on the same 10-point scale as were the corresponding measures at Time 1.5 Participants in Study 2 were also asked about their status on several demographic variables, including age, and the interviewer made a subjective judgment regarding the respondent’s sex.
Correlations among the key dependent variables are shown in Table 1 for each study.
In Study 1, customers leaving the hardware store expressed strong intentions (M = 9.36, SD = 1.72) and gave high self-predicted probabilities (M = 91\%, SD =20\%) of completing the project within 30 days. Indeed, nearly two-thirds of the respondents (139 out of 211) stated that the probability of completing the project within 30 days was 100\%. In the restricted dataset for which we have the follow-up measures (N = 130), the mean self-predicted probability of completing the target activity was 92\%. If the self-predictions were well-calibrated, then we would expect to find that, upon being re-contacted 30 days later, 92\% of the respondents would report having completed the project. In fact, only 75\% of respondents (98 out of 130) reported having completed the project 30 days later, reflecting a significant optimistic bias of 17 percentage points, t(129) = 4.71, p < .001. Even among the 87 respondents (for whom we have follow-up data) who said the probability of project completion was 100\%, only 74 (85\%) reported having completed the project. While the project completion rate was low relative to that expected from the self-predictions, in an absolute sense it is quite high. Previous studies of optimistic bias in self-predictions have generally examined target behaviors with a lower probability of completion (e.g., in Koehler & Poon, 2006, Study 1, the actual rate of the target behavior — blood donation — was only 20\%). It is notable that we continue to see optimistic bias in self-predictions even for high-probability target behaviors.
In Study 2, participants had not yet taken any initial steps in completing their project or activity. Inspection of the self-predictions (M = 67\%, SD = 29\%) and intention strength ratings (M = 7.85, SD = 2.36) show that, as expected, the means were lower and there was greater variance in both these variables than was observed in Study 1. For instance, in contrast to Study 1 in which two-thirds of participants gave self-predictions of project completion of 100\%, only 15\% (48 out of 314 respondents) did so in Study 2. Self-predictions did not differ significantly between household projects (M = 67\%, SD = 29\%) and leisure activities (M = 66\%, SD = 30\%), nor did the relation between self-predictions and current intentions vary by project type (interaction B = −0.29, SEB = 1.09, p = .793). Evidently, respondents relied to the same extent on their current intentions when predicting their likelihood of completing either an obligatory household project or a more discretionary leisure activity.
In the restricted dataset for which we have the follow-up measures (N = 266), the mean self-predicted probability of completing the target activity was 67\%. If the self-predictions are not systematically biased, then, we would expect to find that, upon follow-up, 67\% of respondents report having completed the activity. In fact, only 31\% (82 of 266) reported having completed the activity when they were re-contacted three months after making their predictions. The much lower completion rate in this study, compared to Study 1 (75\%), was anticipated due to the differences between studies in forecast horizon and status of the project or activity at the time the study was conducted. The difference between the self-predicted and actual probability of completing the target activity again reveals a large optimistic bias, t(265) = 12.5, p < .001.
In Study 2 (but not Study 1) we also collected data on participants’ sex and age. Males and females did not differ in their self-predictions, intention strength, or likelihood of completing the target activity, nor did they differ in the weight placed on intention strength when making their self-predictions. Likewise, age (as measured in 10-year increments) did not correlate with self-predictions, intention strength, or likelihood of completing the target activity. There was also no relation between age and the weight placed on current intentions when making self-predictions. The older did not appear to be wiser in terms of being less prone to optimistic bias in their self-predictions: Participants who were 40 and older overestimated their likelihood of completing the target activity by an average of 38 percentage points; those under 40 overestimated by 33 percentage points.
Table 2: Regression Analyses from Studies 1 and 2.
Study 1: Hardware Store DV = self-prediction B SE(B) Beta t Sig. 1 (Constant) 12.956 4.824 2.686 0.008 intention strength 8.817 0.464 0.772 19.018 <.001 barriers composite −1.205 0.315 −0.155 −3.822 <.001 R2 = .675 2 (Constant) 13.466 4.886 2.756 0.006 intention strength 8.78 0.467 0.769 18.791 <.001 obstacles −0.398 0.336 −0.057 −1.186 0.237 competing demands −0.805 0.333 −0.119 −2.418 0.016 R2 = .675 DV = intention strength B SE(B) Beta t Sig. 1 (Constant) 2.701 0.402 6.721 <.001 self-prediction 0.072 0.004 0.822 19.018 <.001 barriers composite 0.03 0.029 0.045 1.036 0.301 R2 = .654 2 (Constant) 2.73 0.408 6.694 <.001 self-prediction 0.072 0.004 0.82 18.791 <.001 obstacles 0.027 0.03 0.045 0.895 0.372 competing demands 0.003 0.031 0.005 0.105 0.917 R2 = .654 DV = behavior B SE(B) Wald df Sig. 1 intention strength 0.303 0.129 5.54 1 0.019 Constant −1.698 1.208 1.975 1 0.16 −2 log likelihood = 139.4; χ2(1) = 5.687 2 self-prediction 0.047 0.015 10.252 1 0.001 Constant −3.142 1.358 5.353 1 0.021 −2 log likelihood = 130.2; χ2(1) = 14.889 3 obstacles −0.13 0.084 2.434 1 0.119 competing demands −0.06 0.088 0.465 1 0.495 Constant 1.844 0.406 20.638 1 <.001 −2 log likelihood = 139.2; χ2(2) = 5.911 4 self-prediction 0.041 0.015 7.128 1 0.008 obstacles −0.079 0.095 0.706 1 0.401 competing demands −0.003 0.099 0.001 1 0.978 Constant −2.28 1.588 2.061 1 0.151 −2 log likelihood = 129.2; χ2(3) = 15.90 DV = optimism (self-prediction – behavior) B SE(B) Beta t Sig. 1 (Constant) −0.023 0.232 −0.1 0.92 intention strength 0.02 0.024 0.073 0.828 0.409 R2 = .005
Study 2: Phone Survey DV = self-prediction B SE(B) Beta t Sig. 1 (Constant) 18.177 6.058 3 0.003 intention strength 7.511 0.552 0.602 13.605 <.001 barriers composite −1.73 0.487 −0.157 −3.554 <.001 R2 = .443 2 (Constant) 19.039 5.984 3.181 0.002 intention strength 7.463 0.543 0.607 13.734 <.001 obstacles −1.136 0.523 −0.118 −2.171 0.031 competing demands −0.639 0.546 −0.064 −1.169 0.243 R2 = .454 DV = intention strength B SE(B) Beta t Sig. 1 (Constant) 5.008 0.411 12.176 <.001 self-prediction 0.05 0.004 0.62 13.605 <.001 barriers composite −0.076 0.04 −0.086 −1.894 0.059 R2 = .653 2 (Constant) 4.877 0.419 11.638 <.001 self-prediction 0.051 0.004 0.628 13.734 <.001 obstacles −0.006 0.044 −0.007 −0.13 0.897 competing demands −0.064 0.045 −0.079 −1.418 0.157 R2 = .659 DV = behavior B SE(B) Wald df Sig. 1 intention strength 0.248 0.072 11.75 1 0.001 Constant −2.846 0.628 20.517 1 0 −2 log likelihood = 314.5; χ2(1) = 14.088 2 self-prediction 0.03 0.006 21.253 1 <.001 Constant −2.987 0.518 33.208 1 <.001 −2 log likelihood = 294.5; χ2(1) = 27.971 3 obstacles −0.027 0.057 0.226 1 0.634 competing demands −0.114 0.059 3.724 1 0.054 Constant 0.03 0.326 0.008 1 0.928 −2 log likelihood = 314.2; χ2(2) = 8.19 4 self-prediction 0.028 0.007 16.457 1 <.001 obstacles 0.023 0.061 0.149 1 0.699 competing demands −0.07 0.062 1.253 1 0.263 Constant −2.541 0.73 12.104 1 0.001 −2 log likelihood = 293.1; χ2(3) = 29.301 DV = optimism (self-prediction – behavior) B SE(B) Beta t Sig. 1 (Constant) 0.079 0.102 0.776 0.439 intention strength 0.035 0.012 0.174 2.876 0.004 R2 = .030
Did calling attention to potential barriers, by first eliciting ratings of anticipated obstacles and competing demands, lead to lower self-predictions (or less optimistic bias) than when such factors were not considered prior to making the self-predictions? There was no evidence of this in either study. Self-predictions were no lower when elicited after the potential barrier ratings (Study 1: M = 89\%, SD = 20\%; Study 2: M = 69\%, SD = 27\%) than they were before (Study 1: M = 92\%; SD = 20\%; Study 2: M = 64\%, SD = 32\%), contrary to H1, t(209) = 1.04, p = .299 for Study 1 and t(312) = 1.45, p = .148 for Study 2; nearly identical results are obtained when only the subset of participants for whom we have follow-up data is examined. Likewise, optimistic bias (self-predicted minus actual probability of project completion, calculated for participants for whom we have follow-up data) was not significantly lower among those who first evaluated potential barriers (Study 1: M = 14\%, SD = 36\%; Study 2: M = 36\%, SD = 48\%) than among those who did not (Study 1: M = 19\%, SD = 44\%; Study 2: M = 36\%, SD = 46\%), t(128) = 0.76, p = .450 for Study 1, and t(264) = 0.02, p = .984 for Study 2.
Self-predictions did not ignore potential barriers altogether. A regression of self-predictions on intention strength and anticipated barriers (using a composite of the obstacles and competing demands items) showed that barriers remained a significant predictor in both studies even when controlling for current intentions (Table 2). (The composite barrier measure, on its own, was in fact significantly correlated with actual project completion; r = −.21, p = .015 in Study 1 and r = −.17, p = .007 in Study 2.) Table 2 also shows regressions in which potential obstacles and competing demands were entered as separate terms (rather than as a composite), and indicates that competing demands (in Study 1) and potential obstacles (in Study 2) accounted for significant variance in self-predictions even when intention strength was included in the model. A possible interpretation of these analyses, taken together, is that participants considered potential barriers in their self-predictions — at least to some extent — whether or not those barriers had been drawn explicitly to their attention.
If the anticipated impact of potential barriers was discounted at the time self-predictions were elicited, then we would expect to see the retrospective ratings (elicited in Study 2 only) to acknowledge a greater impact of barriers on activity completion than had originally been anticipated. In fact, contrary to H2, the retrospective ratings of the impact of obstacles (M = 6.0, SD = 3.6) and competing demands (M = 6.5, SD = 3.4) were not significantly higher than the prospective ratings (obstacles: M = 5.8, SD = 3.0; competing demands: M = 6.3, SD = 2.9), t(260) = 0.89, p = .377 for obstacles and t(260) = 1.06, p = .259 for competing demands. Prospective and retrospective ratings were significantly positively correlated both for obstacles (r = .225) and for competing demands (r = .351). Participants in Study 2 appeared to have at least a limited ability to anticipate the likelihood that they would encounter obstacles or competing demands, and did not appear, in the direct ratings made prospectively, to systematically underestimate their future impact.
If potential barriers are not given sufficient weight in self-predictions, as implied by H1 and H2, then adding the anticipated barrier ratings to a regression model should improve its ability to predict project or activity outcomes (i.e., behavior) relative to a baseline model that uses only the self-predictions themselves as a predictor. We compared a full logistic regression model predicting project completion from self-predictions, ratings of potential obstacles, and ratings of competing demands, to a reduced model using only the self-predictions as a predictor (Table 2). In the full model, neither potential obstacles nor competing demands emerged as significant predictors in either study, and the full model that included these potential barriers did not significantly outperform the reduced model that excluded them, χ2(2) = 1.011, p = .603 in Study 1, and χ2(2) = 1.33, p =.514 in Study 2.6 Self-predictions, apparently, could not be improved, in terms of more accurately distinguishing cases in which the target project/activity would or would not be completed, by a model that placed more appropriate weight on potential barriers as rated at the time of prediction, contrary to what would be expected under H1 or H2.
This result is not attributable to the anticipated barrier ratings being completely non-predictive of future behavior on their own. A regression model with the two barrier items (potential obstacles and competing demands) entered on the first step accounted for a marginally significant portion of variance in behavior in Study 1, χ2(2) = 5.91, p =.052, and for significant portion of variance in Study 2, χ2(2) = 8.19, p =.017. (In both studies, adding self-predictions in the second step accounted for significant additional variance in behavior, χ2(1) = 9.989, p = .002 in Study 1, and χ2(1) = 21.11, p < .001 in Study 2.)
Figure 1: Regression curves showing self-predicted and actual probability of project completion as a function of intention strength, in Study 1 (Hardware Store).
Figure 2: Regression curves showing self-predicted and actual probability of activity completion as a function of intention strength, in Study 2 (Phone Survey). 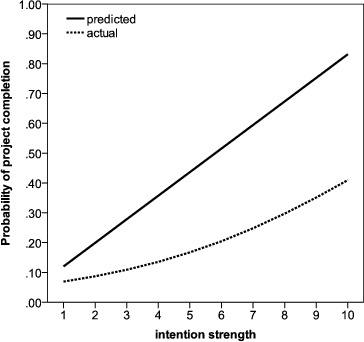
Did self-predictions place too much weight on current intentions? Figures 1 and 2 compare, in Studies 1 and 2 respectively, regression lines of self-predictions and of actual project/activity completion on intention strength as rated at the time of prediction. Logistic regressions of project/activity completion (dashed lines) on intention ratings show that, in both studies, the probability of project completion did increase with strength of intentions as elicited at the time of self-prediction (Table 2). In other words, current intention strength is indeed a valid cue in predicting subsequent likelihood of project completion. The self-predictions, however, appeared to place too much weight on current intentions, in that the probability of project completion does not increase as sharply with increases in intention strength as the self-predictions would imply. This discrepancy is apparent in the comparison, in Figures 1 and 2, of the regression curves for self-predicted (solid lines) and actual probability of project completion (dashed lines) as a function of intention strength: The former is steeper than the latter.
One means of testing the discrepancy in slopes is to take the difference, for each participant, between the self-predicted (a continuous variable) and actual (a binary variable) probability of completing the target activity, which can be thought of as a measure of optimistic bias, and to regress it on intention strength. Table 2 shows the results. In Study 2, optimistic bias increased significantly with increasing intention strength. That is, self-predictions increased significantly more steeply with intention strength than did the actual probability of the target activity, consistent with H3.
In Study 1, the relation between optimistic bias and intention strength was not statistically significant. Some caution is required in interpreting this result and the associated Figure 1, however, due to the restricted range over which intention strength varied in the sample: Nearly 80\% of respondents for whom we have follow-up data had given the maximum possible intention strength rating of 10 at the time of self-prediction. Despite this concern, we attempted to find evidence for H3 by comparing mean self-predicted and actual probabilities of project completion between those participants giving the maximum intention strength rating of 10 (n = 103) and those giving an intention strength rating of less than 10 (n = 27). Self-predicted probabilities were significantly higher for the former group (M = 97\%) than for the latter (M = 73\%), t(128) = 8.06, p < .001, but the difference in the actual probability of completing the project between the two groups (M = 79\% and 63\%, respectively) was smaller and not statistically significant, t(128) = 1.69, p = .094. The group with the stronger intentions overestimated their probability of completing the project by 18 percentage points while the group with less strong intentions did so by only 10 percentage points. That said, clearly the evidence supporting H3 is less strong in Study 1 than in Study 2.
Finally, we also tested whether the manipulation drawing attention to potential barriers had any effect on the weight placed on current intentions in the self-prediction process. When self-predictions are regressed on intention strength and the attention manipulation (whether self-predictions were made before or after evaluating potential barriers), such an effect would appear as an interaction between the two factors. Results indicated no such interaction (Study 1: B = 0.498, SEB = 0.936, p = .596; Study 2: B = −1.82, SEB = 1.11, p = .101). These analyses used the entire dataset, including participants for whom no follow-up data were collected, for maximum statistical power; qualitatively similar conclusions hold when the analyses are restricted to the subset of participants for whom follow-up data were available. The intention strength ratings themselves were not affected by the attention manipulation, either, t(209) = 0.47, p =.64 in Study 1, and t(312) = 1.39, p =.17 in Study 2.
Studies 1 and 2 revealed an optimistic bias in self-predictions, consistent with previous research. Neither study provided evidence that people fail to attend to, or systematically discount, potential barriers when making self-predictions, contrary to H1 (Inattention to Potential Barriers) and H2 (Discounting of Potential Barriers). It appears that potential barriers, at least to the extent that their impact can be accurately anticipated, are adequately factored into self-predictions.
The modest correlations between prospective and retrospective estimates of the impact of such barriers observed in Study 2, however, suggest that many of the barriers people encounter in attempting to complete intended actions are unpredictable. More generally, the processes by which current intentions are translated into future behavior are typically unreliable, meaning that current intentions will be an imperfect predictor of future behavior, and should be weighted accordingly. Studies 1 and 2 indicated that current intentions received too much weight in self-predictions, which tends to produce overly optimistic self-predictions in the presence of strong intentions.
Kahneman and Tversky (1973) suggested that intuitive predictions are often as extreme as the cues on which the predictions are based, even when the individual making the prediction freely acknowledges, when asked directly, that the cues are imperfectly correlated with the outcome variable being predicted. The logic of statistical prediction, of course, requires that predictions place less weight on a predictive cue as the correlation between the cue and the outcome variable decreases. To the extent that intuitive self-predictions do not respect this normative statistical principle, however, it is possible that people could simultaneously acknowledge the presence of situational factors (e.g., unpredictable barriers; i.e., barriers whose presence and impact is uncertain) that attenuate the correlation between current intentions and future behavior, and at the same time fail to appropriately adjust the weight placed on their current intentions when making self-predictions.
We tested this possibility in Study 3 using a manipulation that was designed to increase acknowledgement, at least in direct ratings, of the possible impact of various situational factors on the likelihood of completing the target behavior. The key question is whether the manipulation, assuming it is effective, leads people to change their self-predictions, for instance by placing less weight on their current intentions when predicting their future behavior. We hypothesized, following H3 (Overweighting of current intentions), that it would not. Demonstration of a dissociation between self-predictions and direct ratings of the potential impact of situation factors (e.g., barriers) would provide stronger evidence for H3 than was provided by the null effect of the attentional manipulation in Studies 1 and 2.
We chose to concentrate on a single target behavior, blood donation, as the focus of self-predictions to minimize variance in the nature and magnitude of the behavior being predicted, and — because people vary widely in their intentions to donate blood — to examine the relation between self-predictions and intention strength over a broader range of intention strength than in the previous two studies involving self-nominated target behaviors.
Past research (e.g., Koehler & Poon, 2006) suggests that blood donation is, for many people, something they intend to do but are not always successful in actually doing. We generated a list of situational factors, based on this previous research, that could influence the likelihood that intentions to donate blood are translated into actual donations. Some participants were asked to evaluate the potential impact of each in an “unpacked” list of situational factors that could make it easier or more difficult to donate blood, prior to giving self-predictions and ratings of current intentions with respect to blood donation. We chose to list potential facilitating situational factors as well as potential barriers, both to reduce experimental demand and to highlight the inherent uncertainty of predicting future behavior from current intentions in light of the various situational factors that could influence blood donation behavior either positively or negatively. It is worth noting, however, that many of the potentially facilitating factors included in the unpacked list would not necessarily apply to the circumstances of the participant, and hence their possible absence could be viewed effectively as a potential barrier.
Other participants did not evaluate the unpacked list of specific situational factors, but did rate the possible impact of this overall (“packed”) category of factors on their likelihood of donating blood before making their self-predictions. The influence of considering situational factors, in either packed or unpacked form, was evaluated relative to a control group that did not rate the potential impact of the situational factors until after making their self-predictions. We expected that being presented with an unpacked list of specific situational factors would lead to greater agreement, compared to those who did not see the unpacked list, that such factors could influence the likelihood of donating blood (see Tversky & Koehler, 1994). Our main question, assuming the manipulation had this effect, was how it would affect self-predictions and the weight they placed on current intentions.
Because our key question concerned factors influencing self-predictions, and not the correspondence between self-predictions and actual behavior, in this study we elicited self-predictions but did not attempt to collect follow-up data on rates of actual blood donation.
Participants were undergraduates at the University of Waterloo who completed an online questionnaire in exchange for extra credit in their introductory psychology course. The questionnaire concerned the likelihood that the participants would donate blood at least once between the date the questionnaire was administered and the end of the calendar year, which was approximately 8 months in the future. An initial item was used to screen out participants who were ineligible to donate blood in that timeframe for medical or other reasons. All remaining participants were asked to rate the strength of their current intentions to donate blood on a 9-point scale (“Right now, as I think about it, I strongly intend to donate blood by the end of [the current calendar year]” where 1 = “strongly disagree” and 9 = “strongly agree”), and to estimate the probability that they would actually do so on a 0\% to 100\% probability scale presented in 5\% increments.7
Participants were also asked, either before or after giving their intention ratings and self-predictions, to evaluate situational factors that might influence their likelihood of donating blood by the end of the calendar year. The situational factors were divided into two types, those that might prevent the participant from donating blood (“preventative factors”) and those that could help enable the participant to donate blood (“enabling factors”). All participants rated their agreement (on a 9-point scale) with a pair of general statements, one regarding preventative and the other enabling factors, that such factors could influence their likelihood of donating blood: “Overall, I might be influenced by factors that [prevent me from donating blood]/ [help enable me to donate blood].” Before rating their agreement with either general statement, participants in the “unpacked” condition first rated (on the same response scale) the possible impact of each in a list of 8 specific situational factors of that type (preventative or enabling; see Appendix). For example, specific preventative factors included not hearing about an on-campus donation event, forgetting such an event, being too busy, and the location for donation being inconvenient for the participant. Specific enabling factors included receiving a reminder of a blood donation event, signing up in advance for such an event, donating with a group of friends, and seeing a heart-warming advertisement encouraging blood donation. Participants in the “packed” condition were not presented with the unpacked lists of specific factors and only evaluated their agreement with the pair of general statements regarding the two broad categories of situational factors.8
A final section of the questionnaire, not discussed further here, asked participants whether they had ever donated blood before, whether they had donated in the past year; they were also asked to estimate the percentage of fellow students completing the questionnaire who had done so, as well as the percentage that would donate by the end of the calendar year.
Of the 399 respondents who started to complete the online questionnaire, 112 (or 28.1\%) indicated that they would be unable to donate blood before the end of the calendar year for medical or other reasons. Of the remaining 287 participants, 21 (or 7.3\%) were excluded because they did not complete one or more of our key dependent measures (self-prediction, intention strength, global preventative and enabling factor ratings), leaving 266 respondents in the final sample.
Table 3: Study 3 regression analysis results. The dependent variable is self-prediction.
Both packing conditions B Std. Error Beta t Sig. (Constant) −16.157 7.279 −2.22 0.027 intention strength 11.121 0.572 0.886 19.436 0 order 2.642 4.654 0.039 0.568 0.571 intention x order −0.872 0.812 −0.083 −1.074 0.284 R2 = .726 Unpacked condition only (Constant) −19.177 11.176 −1.716 0.089 intention strength 10.67 0.844 0.863 12.649 0 order 7.02 7.383 0.108 0.951 0.344 intention x order −1.127 1.259 −0.111 −0.895 0.372 R2 = .680
Ratings of the unpacked preventative factors indicated moderate levels of agreement that they could have some impact, with means ranging from approximately 4 to 5.5 on the 9-point agreement scale. Participants in the unpacked condition went on to express greater agreement (M = 5.43, SD = 2.40, n = 129) with the global statement about preventative factors (“Overall, I might be influenced by factors that prevent me from donating blood”) than did those in the “packed” condition (M = 4.69, SD = 2.36, n = 137), t(264) = 2.56, p = .011. Likewise, ratings of the unpacked enabling factors indicated moderate agreement that they could have some impact, with means ranging from approximately 5 to 6.5. Agreement with the global statement about enabling factors (“Overall, I might be influenced by factors that help enable me to donate blood”) was also higher in the unpacked condition (M = 5.55, SD = 2.31) than in the packed condition (M = 5.06, SD = 2.26), though in this case the difference was only marginally statistically significant, t(264) = 1.76, p = .08 (or p = .04 by a one-tailed test).
We now turn to the question of whether considering preventative and enabling factors, in packed or unpacked form, prior to making self-predictions had any effect either on the self-predictions (as a main effect) or on the weight placed on intention strength when making the self-predictions. ANOVA of the self-predictions showed no main effects of either the unpacking manipulation, the order variable (whether the enabling and preventative factors were considered before or after making the self-predictions), or an interaction between the two variables. Analysis of the intention strength measure likewise showed no effects of these variables.
To test whether considering the preventative and enabling factors influenced the weight subsequently placed on intention strength when making self-predictions, self-predictions were regressed on intention strength, the order variable (whether the enabling and preventative factors were considered before or after making the self-predictions, coded 0 and 1, respectively), and their interaction (Table 3). The interaction was not statistically significant (B = −0.87, SEB = 0.81, p = .284), indicating that participants did not place less weight on their current intentions when estimating their probability of donating blood after considering and acknowledging that there were various situational factors that could influence their likelihood of successfully translating their intentions into action.
Figure 3: Regression lines showing self-predicted probability of blood donation as a function of intention strength, separately for those who made their self-predictions first (i.e., before the ratings of enabling and preventative factors) and for those who made self-prediction after rating the enabling and preventative factors in either packed or unpacked form, in Study 3 (Blood Donation). 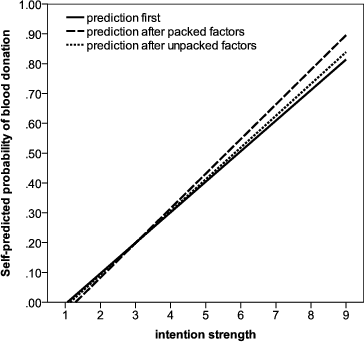
As in the previous studies, the self-predictions closely followed ratings of current intention strength (B = 11.1, SEB = 0.57, p < .001). As a sharper test, the regression analysis was repeated with just the subset of participants assigned to the unpacked condition (Table 3), but again there was no evidence that current intentions were given less weight following consideration of the unpacked lists of factors that could influence the likelihood of blood donation (B = −1.13, SEB = 1.26, p = .372). The regression lines in Figure 3 show self-predictions as a function of intention strength separately for participants who made them before considering the enabling and preventative factors, or after evaluating the enabling and preventative factors in either packed or unpacked form. The near-identical slopes across conditions indicate that drawing attention to these situational factors, even in unpacked form, did not lower the weight placed by self-predictions on current intentions.
A plausible explanation for optimistic bias in self-predictions is that people do not adjust their predictions sufficiently in light of information they have, or can generate, regarding situational barriers that will predictably affect their probability of completing the target activity. This account is compatible with previous research emphasizing the role of plans and intentions in the self-prediction process (e.g., Buehler, Griffin, & Peetz, 2010; Helzer & Dunning, 2012; Koehler & Poon, 2006; Koehler et al., 2011; Peetz & Buehler, 2009). It suggests that self-predictions would be improved if greater attention was paid to, and greater weight placed on, situational barriers that can interfere with the completion of planned or intended action. Studies 1 and 2, however, failed to provide evidence for this claim. Although self-predictions tended to be too optimistic, a manipulation designed to draw attention to potential barriers had no reliable effect on subsequent self-predictions. This result did not appear to come about because self-predictions entirely ignored potential barriers. In fact, the results of Studies 1 and 2 implied that adequate upward or downward adjustments were made for any barriers that were predictable at the time the self-prediction was elicited; at least, statistical models that optimally weighted prospective ratings of potential barriers were unable to systematically outperform the self-predictions themselves in terms of predictive (correlational) accuracy.
Studies 1 and 2 suggested that the observed optimistic bias in self-predictions stemmed more from overweighting of current intentions than it did from underweighting of predictable barriers to completing the target activity. We favor the interpretation that much of the challenge in self-prediction of future behavior lies in the unpredictable impact of the situational factors that are encountered on the path from intention formation to completion of the target activity. In light of the unreliability with which current intentions are translated into future behavior, intention strength ought to receive appropriately moderated weight in self-predictions. The evidence from Studies 1 and 2 is consistent with the claim that self-predictions overweight current intentions. This finding is illustrated in Figures 1 and 2, which show how optimistic bias increases with strength of intentions at the time of self-prediction.
The null result of Studies 1 and 2, that drawing attention to potential obstacles did not influence self-predictions, might be attributable to an ineffective manipulation. In Study 3, however, a different manipulation (unpacking) was used to draw attention to situational factors (such as potential barriers) that could affect the likelihood of the target behavior, and it was found to influence direct ratings of the potential impact of these factors. Despite the evidence that the manipulation was effective in increasing acknowledgement of the possible impact of these situational factors, however, self-predictions remained unaffected: The manipulation did not lead to generally lower self-predicted probabilities of donating blood nor to less weight being placed on current intentions when making the self-predictions.
In sum, we find that the general principle of prediction by evaluation (Kahneman and Tversky,1973), sufficiently accounted for the optimistic bias in self-predictions observed in the studies reported here. This account is helpful in identifying the circumstances under which self-predictions are likely to be most overly optimistic, namely when current intentions are strong but their translatability into future behavior is unreliable (Koehler & Poon, 2006). It is notable that, in our studies at least, it was not necessary to invoke motivated reasoning processes to explain the optimistic bias we observed in self-predictions across a range of target behaviors.
Our findings may appear to contradict previous work that traces error in self-prediction to a neglect of situational barriers or obstacles (Balcetis & Dunning, 2008, 2013; Buehler, Griffin, & Ross, 1994; Newby-Clark et al., 2000). For instance, people are less likely to account for potential obstacles and interruptions when predicting the completion time of their own future tasks than others’ tasks (Buehler, Griffin, & Ross, 1994; Newby-Clark et al., 2000), and drawing explicit attention to these factors can reduce optimistic bias (Peetz, Buehler, & Wilson, 2010). Similarly, people fail to anticipate the influence of situational barriers (e.g., the presence of onlookers, a bad mood) when predicting the likelihood that they will engage in helping behaviors (Balcetis & Dunning, 2013). In contrast, we found that people incorporated potential barriers into their predictions whether attention was drawn to them or not, and did so about as well as possible. It is noteworthy, however, that the barriers we examined can be seen as a small subcategory of all the possible barriers to intended behavior. These barriers, as operationalized in our measures, represent the set of factors that people are able to identify at the time of prediction as (potentially) influencing their own behavior. Although these recognizable barriers were incorporated into predictions, there were surely many other situational factors that influenced behavior in ways that people failed to anticipate. Thus our findings do not suggest that people accurately adjust for all situational factors, but rather that the barriers they can identify as relevant to their own future behavior, when asked explicitly to do so, are incorporated adequately into self-predictions. Remarkably, despite adjusting for these recognizable barriers, people do not adequately attenuate the weight placed on their current intentions when predicting their future behavior.
An alternative to the claim that self-predictions place excessive weight on current intentions is that perhaps our participants simply fail to distinguish the two concepts, yielding high correlations between them. In our studies, we deliberately juxtaposed the two measures, within subjects, to emphasize (e.g., through conversational norms; Hilton, 1995; Schwarz, 1994) that they were meant to measure or reflect two different things. The intention strength measure highlighted the individual’s current feelings (“right now, as I think about it”) or desire to carry out the target behavior; the self-prediction by contrast focused on the future state of affairs in which the target behavior either would or would not be carried out, and emphasized realistic estimation over current feelings (“how likely is it that you will actually [carry out the target behavior]”). Nonetheless, we do not have direct control over how participants interpreted the two questions, leaving open the possibility that for whatever reason they took the two questions to be largely synonymous.
Examination of the data from Studies 1 and 2, however, does offer some evidence against this interpretation. Consistent with the idea that, in contrast to the intention strength measure, the self-predictions were supposed to represent an accurate assessment of the probability that the target behavior would be carried out, in both Studies 1 and 2 the self-predictions correlated more highly with subsequent behavior than did the intention strength ratings: In Study 1, self-predictions correlated .359 and intention strength only .224 with subsequent behavior, Steiger’s Z = 2.19, one-tailed p = .014, for the difference; in Study 2, self-predictions correlated .290 and intention strength .217 with subsequent behavior, Z = 1.42, one-tailed p = .078. Further, in a regression of project/activity completion on self-prediction and intention strength rating (entered simultaneously), in both studies the self-prediction term was statistically significant (B = .059, SEB = .022, p = .008 in Study 1; B = .024, SEB = .008, p = .002 in Study 2) and the intention strength term was not (B = −0.186, SEB = .246, p = .449 in Study 1; B = .068, SEB = .094, p = .471 in Study 2).
Furthermore, there was some evidence that self-predictions were more closely related to anticipated barriers than were the intention ratings (see Table 2). Self-predictions were related to ratings of potential obstacles in Study 1, and to ratings of competing demands in Study 2, even after controlling for intention strength. By contrast, ratings of potential obstacles and of competing demands were unrelated to the intention strength ratings when controlling for self-predictions. Results were similar when the composite barriers measure was used (instead of separate measures of obstacles and competing demands), though it should be acknowledged that the barriers composite term was marginally significant in Study 2.
In sum, people evidently can make the distinction between what they currently intend to do in the future and what they predict they will actually do (see also Gordon, 1990; Helzer & Dunning, 2012; Warshaw & Davis, 1985). Typically the two evaluations coincide quite closely, however, because current intentions are so heavily weighted in self-predictions. This is the case even when the individual is willing to acknowledge the presence of situational barriers that introduce unreliability in the translation from intentions to behavior and therefore normatively call for decreased weight to be placed on intentions in the self-prediction process.
Although we examined predictions across a wide range of target behaviors, and demographically diverse samples, there are likely to be factors that moderate the weight placed by self-predictions on current intentions, including the controllability and desirability of the predicted actions. Our account may pertain primarily to behaviors that are controllable, as people may be most inclined to base self-predictions on their current intentions to the extent that the behaviors are seen as largely under their personal control. Additionally, the role of intention in prediction may be moderated by other characteristics of the target behavior such as its importance and desirability. Finally although we did not find effects of the sex or age of participants, there may be individual differences (e.g., self efficacy, self control, dispositional optimism) that could moderate how intentions relate to both predicted and actual behaviors.
The cost of overweighting current intentions when making self-predictions can be high when it produces overly optimistic expectations for future goal-congruent behavior. A credit card holder who is overly optimistic about paying the monthly bill in full may not pay sufficient attention to the card’s interest rate, for example; or a workaholic may make a non-refundable deposit on a vacation he or she will never get around to taking. Interventions that help people place more appropriate weight on their current intentions when predicting their future behavior could have the benefit of improving decisions with outcomes that are contingent on their later actions.
Ajzen, I. (1991). The theory of planned behavior. Organizational Behavior and Human Decision Processes, 50(2), 179–211. http://dx.doi.org/10.1016/0749-5978(91)90020-T.
Ajzen, I., & Fisbbein, M. (1974). Factors influencing intentions and the intention-behavior relation. Human Relations, 27(1), 1–15. http://dx.doi.org/10.1177/001872677402700101.
Ajzen, I., & Madden, T. J. (1986). Prediction of goal-directed behavior: Attitudes, intentions, and perceived behavioral control. Journal of Experimental Social Psychology, 22(5), 453-474. http://dx.doi.org/10.1016/0022-1031(86)90045-4.
Armitage, C. J., & Conner, M. (2001). Efficacy of the theory of planned behaviour: A meta-analytic review. British Journal of Social Psychology, 40(4), 471-499. http://dx.doi.org/10.1348/014466601164939.
Armor, D. A., & Taylor, S. E. (1998). Situated optimism: Specific outcome expectancies and self-regulation. Advances in Experimental Social Psychology, 30, 309–379. http://dx.doi.org/10.1016/S0065-2601(08)60386-X.
Balcetis, E., & Dunning, D. (2008). A mile in moccasins: How situational experience diminishes dispositionism in social inference. Personality and Social Psychology Bulletin, 34(1), 102–114. http://dx.doi.org/10.1177/0146167207309201.
Balcetis, E., & Dunning, D. (2013). Considering the situation: Why people are better social psychologists than self-psychologists. Self and Identiy, 12, 1–15. http://dx.doi.org/10.1080/15298868.2011.617886.
Buehler, R., Griffin, D., & MacDonald, H. (1997). The role of motivated reasoning in optimistic time predictions. Personality and Social Psychology Bulletin, 23, 238–247. http://dx.doi.org/10.1177/0146167297233003.
Buehler, R., Griffin, D., & Peetz, J. (2010). The planning fallacy: Cognitive, motivational, and social origins. In M. P. Zanna & J. M. Olson (Eds.), Advances in experimental social psychology (Vol. 43, pp. 1-62). San Diego, CA: Academic Press. http://dx.doi.org/10.1016/S0065-2601(10)43001-4.
Buehler, R., Griffin, D., & Ross, M. (1994). Exploring the “planning fallacy”: Why people underestimate their task completion times. Journal of Personality and Social Psychology, 67, 366–381. http://dx.doi.org/10.1037/0022-3514.67.3.366.
Dunning, D. (2007). Prediction: The inside view. In A. W. Kruglanski and E. T. Higgins (Eds.), Social psychology: Handbook of basic principles (Second edition, pp. 69-90). New York: Guilford Press.
Epley, N., & Dunning, D. (2000). Feeling” holier than thou": are self-serving assessments produced by errors in self-or social prediction? Journal of Personality and social psychology, 79(6), 861. http://dx.doi.org/10.1037/0022-3514.79.6.861.
Epley, N., & Dunning, D. (2006). The mixed blessings of self-knowledge in behavioral prediction: Enhanced discrimination but exacerbated bias. Personality and Social Psychology Bulletin, 32(5), 641–655. http://dx.doi.org/10.1177/0146167205284007.
Gilovich, T., Kerr, M., & Medvec, M. H. (1993). Effect of temporal perspective on subjective confidence. Journal of Personality and Social Psychology, 64, 552–560. http://dx.doi.org/10.1037/0022-3514.64.4.552.
Gordon, R. A. (1990). Informational bases of behavioral intentions and behavioral expectations or self-predictions. Basic and Applied Social Psychology, 11(4), 433–442. http://dx.doi.org/10.1207/s15324834basp1104\_6.
Griffin, D., Dunning, D., & Ross, L. (1990). The role of construal processes in overconfident predictions about the self and others. Journal of Personality and Social Psychology, 59, 1128–1139. http://dx.doi.org/10.1037//0022-3514.59.6.1128.
Helzer, E. G., & Dunning, D. (2012). Why and when peer prediction is superior to self-prediction: The weight given to future aspiration versus past achievement. Journal of Personality and Social Psychology, 103(1), 38–53. http://dx.doi.org/http://dx.doi.org/10.1037/a0028124.
Hilton, D. J., (1995). The social context of reasoning: Conversational inference and rational judgment. Psychological Bulletin, 118, 248-271.
Hoch, S. J. (1985). Counterfactual reasoning and accuracy in predicting personal events. Journal of Experimental Psychology: Learning, Memory, and Cognition, 11, 719–731. http://dx.doi.org/10.1037/0278-7393.11.1-4.719[
Kahneman, D., & Frederick, S. (2002). Representativeness revisited: Attribute substitution in intuitive judgment. In T. Gilovich, D. Griffin, & D. Kahneman (Eds.), Heuristics and biases: The psychology of intuitive judgment, (pp. 49-81). Cambridge: Cambridge University Press.
Kahneman, D., & Lovallo, D. (1993). Timid choices and bold forecasts: A cognitive perspective on risk taking. Management Science, 39, 17–31. http://dx.doi.org/10.1287/mnsc.39.1.17[
Kahneman, D., & Tversky, A. (1973). On the psychology of prediction. Psychological Review, 80(4), 237. http://dx.doi.org/10.1037/h0034747.
Koehler, D., & Poon, C. S. K. (2006). Self-predictions overweight strength of current intentions. Journal of Experimental Social Psychology, 42, 517-524. http://dx.doi.org/10.1016/j.jesp.2005.08.003.
Koehler, D. J., White, R. J., & John, L. K. (2011). Good intentions, optimistic self-predictions, and missed opportunities. Social Psychological and Personality Science, 2(1), 90–96. http://dx.doi.org/10.1177/1948550610375722.
Krizan, Z., & Windschitl, P. D. (2007). The influence of outcome desirability on optimism. Psychological Bulletin, 133, 95–121. http://dx.doi.org/10.1037/0033-2909.133.1.95.[
Kunda, Z. (1990). The case for motivated reasoning. Psychological Bulletin, 108, 480–498. http://dx.doi.org/10.1037/0033-2909.108.3.480.
Lewin, K. (1951). Field theory in social science; selected theoretical papers. New York: Harper.
Leventhal, H., Singer, R., & Jones, S. (1965). Effects of fear and specificity of recommendation upon attitudes and behavior. Journal of Personality and Social Psychology, 2(1), 20. http://dx.doi.org/10.1037/h0022089.
Lipkus, I., & Shepperd, J. (2009). College smokers’ estimates of their probabilities of remaining a smoker in the near future. Journal of Health Psychology, 14(4), 547–555. http://dx.doi.org/10.1177/1359105309103574.
MacDonald, T. K., & Ross, M. (1999). Assessing the accuracy of predictions about dating relationships: How and why do lovers’ predictions differ from those made by observers? Personality and Social Psychology Bulletin, 25(11), 1417–1429. http://dx.doi.org/10.1177/0146167299259007.
Newby-Clark, I. R., Ross, M., Buehler, R., Koehler, D., & Griffin, D (2000). People focus on optimistic and disregard pessimistic scenarios while predicting task completion times. Journal of Experimental Psychology: Applied, 6, 171–182. http://dx.doi.org/10.1037//1076-898X.6.3.171.
Peetz, J., & Buehler, R. (2009). Is there a budget fallacy? The role of savings goals in the prediction of personal spending. Personality and Social Psychology Bulletin, 35, 230–242. http://dx.doi.org/10.1177/0146167209345160.
Peetz, J., Buehler, R., & Wilson, A. (2010). Planning for the near and distant future: How does temporal distance affect task completion predictions? Journal of Experimental Social Psychology, 46(5) 709–720. http://dx.doi.org/10.1016/j.jesp.2010.03.008.
Rhodes, R. E., & Dickau, L. (2012). Experimental evidence for the intention–behavior relationship in the physical activity domain: A meta-analysis. Health Psychology, 31(6), 724. http://dx.doi.org/10.1037/a0027290.
Ross, L., & Nisbett, R. E. (1991). The person and the situation: perspectives of social psychology. New York, NY: Mcgraw-Hill.
Schwarz, N. (1994). Judgment in a social context: Biases, shortcomings, and the logic of conversation. In M. P. Zanna (Ed.), Advances in experimental social psychology (Vol. 26, pp. 123-162). San Diego, CA: Academic Press.
Shepperd, J. A., Ouellette, J.A., & Fernandez, J. K. (1996). Abandoning unrealistic optimism: Performance estimates and the temporal proximity of self-relevant feedback. Journal of Personality and Social Psychology, 70, 844–855. http://dx.doi.org/10.1037/0022-3514.70.4.844.
Sutton, S. (1998). Predicting and explaining intentions and behavior: How well are we doing? Journal of Applied Social Psychology, 28(15), 1317–1338. http://dx.doi.org/10.1111/j.1559-1816.1998.tb01679.x.
Tanner, R. J., & Carlson, K. A. (2009). Unrealistically optimistic consumers: A selective hypothesis testing account for optimism in predictions of future behavior. Journal of Consumer Research, 35, 810–822. http://dx.doi.org/10.1086/593690.
Warshaw, P. R., & Davis, F. D. (1985). Disentangling behavioral intention and behavioral expectation. Journal of Experimental Social Psychology, 21, 213–228. http://dx.doi.org/10.1037/a0013314.
Webb, T. L., & Sheeran, P. (2006). Does changing behavioral intentions engender behavior change? A meta-analysis of the experimental evidence. Psychological Bulletin, 132(2), 249–268. http://dx.doi.org/10.1037/0033-2909.132.2.249[
Participants in the unpacked condition read and rated their agreement with all nine statements on each list; participants in the packed condition read and rated their agreement only with the final statement in each list. Ratings were made on a scale from 1 = “strongly disagree” to 9 = “strongly agree.”
I might not hear about a blood donation clinic being held on campus or elsewhere.
I might forget about a blood donation clinic that I had heard was being held on campus or elsewhere.
My intention to donate blood might change.
I might be too busy to donate blood.
I might wait until too late to sign up to participate in a blood donation clinic.
I might be ineligible due to illness or other factors beyond my control.
The location of the blood donation clinic might be inconvenient.
I might be too afraid of needles to donate blood.
Overall, I might be influenced by factors that prevent me from donating blood.
Using a reminder (e.g., arranging a phone reminder, regularly checking the UW Bulletin, local newspaper) of an upcoming blood donation clinic might help.
Going to the blood donor clinic with a group of friends might help.
Signing up in advance to donate blood at a clinic might help.
Learning about the eligibility rules for donating blood might help.
Seeing a heart-warming advertisement encouraging blood donation might help.
Learning about the scheduling/booking arrangements for an upcoming clinic might help.
Being able to sign up to donate blood over the internet might help.
Being able to “walk in” and donate blood without an appointment might help.
Overall, I might be influenced by factors that help enable me to donate blood.
Copyright: © 2014. The authors license this article under the terms of the Creative Commons Attribution 3.0 License.
This document was translated from LATEX by HEVEA.