| Figure 1: Risk taking in risky-choice framing. |
Judgment and Decision Making, Vol. 9, No. 3, May 2014, pp. 274-286
The combined role of task, child’s age and individual differences in understanding decision processesIrwin P. Levin* Elaine A. Bossard* Gary J. Gaeth# Haoyang Yan# |
It is important to understand the impact of individual differences in decision making from childhood to adulthood. This cohort-based study extends our knowledge by comparing decision making of children across the age range of 8 to 17 years and their parents. Based on prior research and theory focusing on different types of framing effects, we uncover several key differences across ages, including levels of risk taking and sensitivity to expected value differences between risky and riskless choices. Furthermore, we find that measures such as Numeracy and Surgency help explain both age-related and individual differences on our tasks, especially for decisions involving risk. We discuss the role of diverse task measures in understanding how individual difference factors affect different aspects of decision making, including the ability and effort to process numerical information and the ability to suppress affective reactions to stimulus labels.
Keywords: individual-differences, development, framing effect,
numeracy, risky decision making.
Our judgments and decisions depend on the sometimes delicate balance between thoughtful and more impulsive processes. This balance changes over the lifespan when behaviors such as disadvantageous risk taking appear disproportionately across age levels. There has, however, been scant research using individual difference measures to understand changes in decision making from childhood to adulthood. The current study adds to our knowledge by investigating decision making on a variety of tasks involving differential reaction to information presented as gains and losses for children across the age range of 8 to 17 years as well as their parents. Tasks and individual difference measures were selected specifically to focus on how decision processes may develop differentially across this age range. Our goal is to uncover possible sources of age and individual differences in decision making, with a particular focus on risky decision making.
One vehicle for studying decision processes and age-related differences in decision making is framing effects — the tendency to make different judgments and decisions when confronted with objectively equivalent information that is labeled in either positive or negative terms (e.g., success rate vs. failure rate ). Starting with the pioneering work of Daniel Kahneman and Amos Tversky (1979; Tversky & Kahneman, 1981), framing effects have been shown to be ubiquitous and a mainstay of research in behavioral decision theory, especially as they reflect departures from normative principles of decision making. However, the literature is mixed as to the developmental trajectory of framing effects. For example, Reyna and Ellis (1994) report smaller framing effects for younger children than older children, presumably because the younger children use verbatim information and have not yet learned to form the more expedient strategy of extracting the gist of the information, which paradoxically leads to biased responding in the case of framed information. Using a different framing manipulation, Schlottmann and Tring (2005) have demonstrated that children as young as age 5 show significant framing effects in a gambling task. Sixteen years ago, Levin, Schneider and Gaeth (1998) proclaimed that “All frames are not created equal” precisely to account for task- and process-level differences in “framing” studies showing different results. The present paper takes the same approach to explain differences in developmental trends across framing tasks.
Traditionally, children and especially adolescents have been found to take more risks than more mature adults (Harbaugh, Krause & Vesterlund, 2002; Levin, Hart, Weller & Harshman, 2007; Reyna & Ellis, 1994; Schlottmann, 2001). For example, the incidence of risky behaviors such as substance abuse and health-risking sexual behaviors peaks during adolescence until emerging adulthood, and then begins to wane (for review, see Boyer, 2006; Reyna & Farley, 2006).
Studies of the lifespan trajectory of brain functions provide some insight into age-related differences in decision making, where incomplete maturation of some brain regions leads to decision-making deficits. Primarily, researchers have stressed the importance of the functional maturation of the prefrontal cortex in making advantageous choices in the face of uncertainty (Casey, Getz & Galvin, 2008; Crone, Bunge, Latenstein & van der Molen, 2005; Galvan, Hare, Parra, Penn, Voss, Glover & Casey, 2006; Galvan, Hare, Voss, Glover & Casey, 2007). Prefrontal maturation is presumed to be incomplete until young adulthood, in contrast to the early development of subcortical reward processing centers (Galvan et al., 2006). Specifically, children’s decision making might be hampered by their less developed prefrontal cortex to the extent that they may be less able to suppress emotional input arising from the valence of potential choice outcomes. However, even adolescents and young adults who display the greatest degree of risk behaviors have been shown to possess decision making abilities, such as probability estimation, similar to adults (Fischhoff, Parker, Bruine de Bruin, Downs, Palmgren, Daws & Manski, 2000; van Leijenhorst, Westenberg & Crone, 2008).
It is clear that differences in both information processing ability and emotional suppression affect decision making during the critical period of age 8 to 17. What the present study aims to make clearer is how these different developmental trends play out in different aspects of decision making and what role is played by various individual difference factors.
The work of Stanovich and West (Stanovich, 1999; Stanovich & West, 1998a, 1998b, 2000; see also Levin, 1999) inspired other researchers to move from aggregate-level analysis of behavioral decision making to a focus on individual differences in rational thought. For example, research has revealed systematic variations in the magnitude of framing effects as a function of specific task and situational characteristics, and their interaction with individual difference factors (Freling, Vincent & Henard, 2014; Levin, Gaeth, Schreiber & Lauriola, 2002; Mahoney, Buboltz, Levin, Doverspike, & Svyantek, 2011; Peters & Levin, 2008; Simon, Fagley & Halleran, 2004; Smith & Levin, 1996). Processing style differences are examples of such factors and have been highlighted in contemporary theories of decision making. However, until recently, little of this research has been devoted to children’s decision making.
A recent paper by Toplak, West, and Stanovich (2014; see also Kokis, Macpherson, Toplak, West & Stanovich, 2002) investigated the developmental trends of five rational thinking tasks: denominator neglect, belief bias, base rate sensitivity, resistance to framing, and the tendency toward “otherside” thinking. They asked how normative responses on rational thinking tasks are influenced by individual differences in more sophisticated cognition, with age, cognitive ability, and thinking dispositions as indices. Because performance on the rational thinking measures increased with age and the measures of cognitive sophistication showed similar relationships with rational thinking measures, they concluded that age may merely be a proxy for cognitive ability. The increased ability to implement relevant “mindware” to inhibit initial responses may be a driving factor in generating such response patterns. The present study includes both measures that have been related to cognitive ability and measures that have been related to the suppression of initial reactions.
Resistance to framing effects has been included as a component of decision making competence (DMC) in studies which use DMC scores to predict behavior in populations as varied as delinquent adolescents (Parker & Fischhoff, 2005), preadolescents (Weller, Levin, Rose & Bossard, 2012; Weller, Moholy, Bossard & Levin, in press), and mature adults (Bruine de Bruin, Parker & Fischhoff, 2007; Finucane & Gullion, 2010). As described in Levin et al.’s (1998) typology of framing effects, different types of framing effects can be identified in terms of operational definitions, typical findings, and likely underlying mechanisms. Based on these analyses, two types of framing effects are included and analyzed separately: Attribute Framing, where a key attribute of an object being judged can alternatively be described in objectively equivalent but affectively distinct terms (e.g., 75\% lean vs. 25\% fat ground beef; Levin & Gaeth, 1988); and Risky Choice Framing where two choice options differing in risk level but equivalent in expected value (e.g., Tversky & Kahneman’s 1981 Asian Disease Problem) are alternatively framed in terms of gains or losses (e.g., lives saved vs. lives lost). Notably, Attribute Framing does not involve the element of risk.
As summarized in a recent chapter by Levin, McElroy, Gaeth, Hedgcock, and Denburg (2014), there is evidence to support the position that Attribute Framing and Risky Choice Framing involve different processes. For example, as reported in that chapter, when compared to a neutral control condition, instructing people to suppress their emotion by adopting a “detached and unemotional attitude” resulted in no differences for the risky choice framing effect, but a disappearance of the attribute framing effect in the suppression condition (unpublished data from Hedgcock, Denburg & Levin). This would seem to indicate that emotions play a greater role in Attribute Framing. Thus, while these two types of framing effects have been lumped together in earlier studies of decision-making tendencies and competence (e.g., Parker & Fischhoff, 2005), here we separate them.
The Cups task, because of its simplicity, was originally designed to study risky decision making in children (Levin & Hart, 2003; Levin et al., 2007). In this task, the participant chooses between one array of cups — the riskless option — in which the outcome is the same (e.g., one coin in each of three cups) and another array of cups — the risky option — in which the outcomes vary (e.g., zero coins in two cups and three coins in the other cup; simple counting is all that is needed to convey differences in risk across trials). Variations across trials allow for comparisons between risk-taking to achieve gains and risk-taking to avoid losses and comparisons between trials that are “risk advantageous” (the expected value of the risky option is more favorable than the riskless option) and trials that are “risk disadvantageous” (the expected value of the risky option is less favorable than the riskless option). For present purposes, we define separate measures of overall risk taking and measures of sensitivity to expected value (discriminating between risk advantageous and risk disadvantageous choices; see also Weller, Levin & Denburg, 2011.)
Commonly used measures of decision making competence were adapted for use with children: Numeracy, a measure of the understanding and competence in using numerical information (Lipkus, Samsa & Rimer, 2001;) and Decision Matrix, a measure of the ability and effort employed to utilize information of varying complexity in making the best choice in an option-by-attribute matrix (Bruine de Bruin et al., 2007; Payne, Bettman & Johnson, 1993). Each of these has been previously related to components of decision making skills indicating their relevance to making normatively correct and consistent decisions (Bruine de Bruin et al., 2007; Del Missier, Mäntylä & Bruine de Bruin, 2012; Parker & Fischhoff, 2005; Peters, Hibbard, Slovic & Dieckmann, 2007; Reyna, Nelson, Han & Dieckmann, 2009). These measures were chosen for this study because of their potential in accounting for the variance observed in task measures, such as sensitivity to expected value differences between choice options.
The Early Adolescent Temperament Questionnaire-Revised (EAT-Q-R; Ellis & Rothbart, 2001) was used to assess individual differences in temperament that have been found to relate to differences in decision making tendencies. Surgency is characterized by high levels of activity, seeking out positive outcomes, and approach-related behaviors (Rothbart & Bates, 1998). Effortful Control is characterized by self-regulatory processes that require voluntary control of both attention and behavior to modulate emotional experience and expression (Rothbart & Bates, 1998). Effortful Control has been associated with the overarching measure of decision making competence in a study of preadolescents (10–11 year olds; Weller et al., 2012) and was extended in the current study to a wider age range. These measures of temperament were chosen for their potential in accounting for the variance across and within age groups in task measures such as risk taking.
This study was designed to address the following research questions:
Question 1. How do the effects typically observed in the adult literature for the Risky Choice Framing, Attribute Framing and Cups tasks compare to those observed in our sample of children? (These effects are described in detail in the next section.)
Question 2. To what extent are individual differences on these task measures captured by our scales of Temperament, Numeracy and Decision Matrix?
Question 3. How do framing effects, as assessed separately in the Attribute Framing and Risky Choice Framing tasks, vary over age levels?
Question 4. How do measures of risk taking in the Risky Choice Framing task and the Cups task vary over age levels?
Question 5. How does the tendency to differentiate between advantageous and disadvantageous risks, as measured in the Cups task, vary over age levels?
Question 6. Where there are significant age effects on the individual difference measures, to what extent do they mediate the observed age differences on primary task measures?
Children and their parents were recruited from the Child Registry of the Department of Psychology at the University of Iowa and were compensated for their participation. The child participants consisted of 176 children (M = 12.29 years; 90 F [for female]) aged 8 to 17 years. Across the child age groups, N = 17 at age 8 (7 F); N = 17 at age 9 (8 F); N = 17 at age 10 (11 F); N = 20 at age 11 (10 F); N = 24 at age 12 (9 F); N = 19 at age 13 (12 F); N = 18 at age 14 (8 F); N = 17 at age 15 (13 F); N = 17 at age 16 (6 F); and N = 10 at age 17 (6 F). The parent participants consisted of 98 adults (M = 45.15 years of age, with 83 F), with 60 parents having more than one child enrolled in the study.
This task consists of three child-friendly and age-appropriate scenarios in which two choice options differing in risk level but objectively equivalent in expected outcome are alternatively framed in terms of gains or losses (e.g., choosing between two options differing in riskiness for dealing with the threat to an endangered species, where the potential outcomes are framed either positively in terms of “animals saved” or negatively in terms of “animals lost”). Following Levin et al. (2002), each participant received both valence versions of each framing scenario, with one version received in a first session and the other received in a second session. The participants rated their degree of preference for either option so that numerical scores on a six-point scale (1 = definitely choose option A, 6 = definitely choose option B) were comparable for all framing problems. Performance was determined by the mean algebraic difference in response to the negative minus the positive versions of the same problem, with no mean difference indicating complete resistance to framing. Typical risky choice framing effects would be reflected in greater preference for risk in the negative frame condition than in the positive frame condition (Tversky & Kahneman, 1981), leading to a positive difference score for our index.
This measure consists of three child-friendly and age-appropriate questions in which a key attribute of an object being judged can alternatively be described with different but objectively equivalent frame valences (e.g., rating the effectiveness of a cold remedy described alternatively as “curing 75\% of the people taking it” or “not curing 25\% of the people”). Again, each participant received both valence versions of each framing scenario separated across sessions. The participants rated their evaluation of each option on a six-point scale (1 = very unfavorable, 6 = very favorable) so that the response scales were comparable for Risky Choice and Attribute Framing. Performance was determined this time by the mean algebraic difference in response to the positive minus the negative versions of the same problem. In this case, the typical finding would be more favorable evaluations in the positive frame condition than in the negative frame condition (Levin, et al., 2002), leading to a positive difference score for our index.
Following the modified, computerized version as set forth by Levin et al. (2007), the Cups task is used to examine individuals’ decision trends under varying levels of uncertainty and potential outcome. In this task, participants make choices regarding winning and losing hypothetical monetary outcomes (0 to 5 quarters). Each trial consisted of making a choice between a riskless and a risky option where differences between trials were constructed by manipulating whether quarters will be won or lost, the probability of winning/losing if the risky option is chosen (.20, .33, or .50, representing, respectively, choosing from an array of 5, 3, or 2 cups), and the amount one can win/lose in the risky option (2, 3, or 5 quarters). Thus, gain (loss) trials involve the choice between an option that offers a sure gain (loss) of one quarter and an option that offers a designated probability of winning (losing) multiple quarters or no quarters. The side of the screen where the riskless and risky options appear was randomized.
Each participant received a set of three of each combination of probability levels (.20/.33/.50) and outcome levels (2/3/5 quarters) presented in order randomized for each participant, under both gains and losses, totaling 54 trials. Gain and loss trials were constructed into separate trial blocks, with order of trial blocks randomized across participants. For loss trials the participants were given a bank of coins to begin with, and were told that they may lose some. Trials were constructed such that they could never lose more than their original amount. No money actually changed hands beyond the original compensation.
By manipulating gain/loss domain, probability of winning/losing, and magnitude of winning/losing for the risky option, three decision contexts are created under both gains and losses: risk advantageous (RA), equal expected value (EQEV), and risk disadvantageous (RD) trials. RA trials exist when choosing the risky option is more beneficial (has a higher expected value) than choosing the riskless option. EQEV trials exist when the expected benefit for choosing either option is the same. RD trials exist when choosing the risky option is less beneficial (has a lower expected value) than choosing the riskless option.
Taking the different types of trials into consideration, risk-taking behavior for individuals can be measured by overall risk-taking and sensitivity to expected value differences between risky and riskless choice options. Overall risk-taking can be measured by the proportion of risks taken across gain and loss domains. Sensitivity to expected value differences for both gain and loss domain can be measured by subtracting the proportion of risks taken in RA trials from the proportion of risks taken in RD trials; positive RA-RD scores indicate that more risky choices were made when the expected value was in favor of the risky choice than when it was not. Analogous to the Risky Choice Framing index, an index of framing effects in the Cups task was the mean algebraic difference in risk preference between loss and gain trials. Typical findings would be greater risk preference for loss than for gain trials, and within each type of trial greater risk preference for RA than RD trials (Weller, et al., 2011).
Numeracy was measured using a modified version of the Numeracy scale developed by Lipkus et al. (2001; e.g., “If your chance of winning a prize is 20 out of 100, this would be the same as having a ___\% chance of winning the prize”). A 12-item measure was adapted to accommodate “child-friendly” topics and scenarios (α = .85). Correct answers were scored as one, and incorrect answers were scored as zero. Higher scores indicate higher competence in processing and utilizing numeric information.
Participants answered six questions concerning choices between video game systems. The video game systems were described by ratings on five attributes, and choices were made based on differences between varying attributes (e.g., “Tom wants a video game system that is at least medium in either how good the sound is or game selection and variety”). Each question had one correct answer that followed from accurately reading the option-by-attribute matrix. Correct answers were scored as one, and incorrect answers were scored as zero; higher scores indicate higher effort and ability to follow complex logical instructions (α = .46).
The child participants completed the self-report version of the Early Adolescent Temperament Questionnaire-Revised (EAT-Q-R; Ellis & Rothbart, 2001), which is a revision of Capaldi and Rothbart’s (1992) original EAT-Q, designed to assess individual differences in temperament for children between the ages of 9 and 15 years. We combined the subscales that comprise the broader Surgency and Effortful Control dimensions (as described below). Participants rated each question on a scale from 1 (almost always untrue of you) to 5 (almost always true of you), and we created a mean composite score for each of the scales of interest.
The Surgency dimension consists of three subscales: high intensity pleasure seeking (e.g., “I think it would be exciting to move to a new city”), low fear (e.g., “I feel scared when I enter a darkened room at home”), and low shyness (e.g., “I feel shy about meeting new people”) for a total of 16 items. Cronbach’s alpha for these scales ranged from .61 to .78, consistent with prior research (Ellis & Rothbart, 2001; Muris & Meesters, 2009). The superordinate factor of Surgency was derived by creating a mean composite score using these subscales (α = .74).
The Effortful Control dimension consists of three subscales: activation control (e.g., “I have a hard time finishing things on time”), attention focusing (e.g., “I pay close attention when someone tells me how to do something”), and inhibitory control (e.g., “When someone tells me to stop doing something, it is easy for me to stop”) for a total of 16 items. Cronbach’s alpha for these scales ranged from .52 to .75, largely consistent with prior research (Ellis & Rothbart, 2001). The superordinate factor of Effortful Control was derived by creating a mean composite score using these subscales (α = .81).
A complete list of scale items is available in the Appendix.
Parent-child pairs from the University of Iowa Child Registry were asked to participate in a multi-part study on decision-making. Two sessions, approximately 7 to 14 days apart, were administered to each participant. Most relevant for the current study, participants completed our primary decision tasks, as well as the measures of Numeracy, Decision Matrix, Effortful Control, and Surgency. Both parents and children completed Risky Choice Framing, Attribute Framing, Cups, Decision Matrix, and Numeracy, but EAT-Q-R scales were completed by the children only. Each session took up to, but not more than, 2 hours to complete.1
Table 1: Correlations between Individual difference measures and decision making measures
* p<0.05; ** p<0.01; *** p<0.0001
Before addressing changes across age, we consider our first research question of whether the key main effects typically associated with our tasks and manipulations are replicated with our current participants. This is particularly important because only a few studies have addressed these tasks and manipulations within the current non-adult age range (but see Reyna, Estrada, DeMarinis, Myers, Stanisz & Mills, 2011; Strough, Karns & Schlosnagle, 2011; Toplak et al., 2014). Later, we report whether these phenomena vary across children of different ages and between children and their adult parents. We separate those measures that account for systematic individual differences across children’s ages and within age levels. Finally, we provide tests of possible mediators of observed age differences using our individual difference measures. Gender was not a significant factor in any of these analyses and will not be mentioned further.
In response to Research Question 1, most of the standard results are replicated here. For Risky Choice Framing, the most common result, starting with Tversky and Kahneman’s (1981) Asian Disease problem, is a greater preference for the risky option in the negative frame condition than in the positive frame condition. This basic framing effect was replicated here for the group of all children combined (Mdiff =.30, SD=.99, t(173) =3.99, p<.001) and for the parent group, (Mdiff =.49, SD=1.25, t(97) =3.88, p<.002). For Attribute Framing, the most common result, as exemplified by Levin and Gaeth’s (1988) ground beef findings, is more favorable evaluations for an object when its key feature is expressed in positive terms rather than negative terms. This basic framing effect was also observed here for the group of children as a whole (Mdiff =0.62, SD=0.87, t(173) =9.41, p<.001) and the parent group (Mdiff =.42, SD=.79, t(97)=5.32, p<.001).
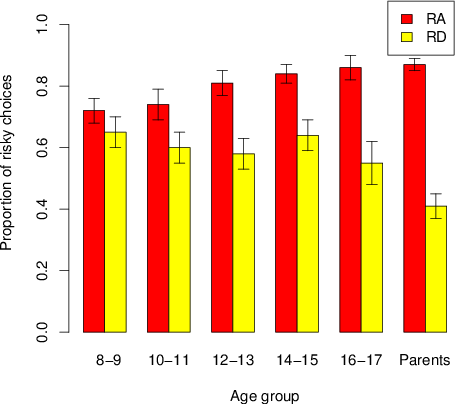
For the Cups task the most reliable prior finding (Levin et al., 2007) has been increasing levels of risk-taking from trials where expected value differences favor the riskless choice (RD trials) to trials with equal expected value for the riskless and risky options to trials where expected value differences favor the risky choice (RA trials). Results here, operationally defined by whether expected value sensitivity (RA-RD) is significantly greater than zero, replicate this finding with both children (Mdiff =0.28, SD=0.27, t(96) =13.86, p<.001) and parents (Mdiff =0.48, SD=0.31, t(96) =15.12, p<.001). Another tendency in the Cups task for greater risk taking on loss trials than on gain trials was not replicated here for the child group (t(173) =0.73, p=>.05) but was replicated for the adult group (Mdiff =.12, SD=.26, t(96) =4.60, p<.001).
In order to address Research Question 2, Table 1 provides a correlation matrix combined over child ages summarizing the relations between our key dependent variables and the individual difference measures.
The clearest evidence of a relation between individual difference characteristics and task performance measures comes from the measures of decision making competence, Numeracy and Decision Matrix, related to the Cups measures of sensitivity to EV differences (Risk RA-RD) and the tendency to avoid disadvantageous risks (RD). Because risk taking on RA trials is uniformly high, most of the expected value sensitivity effect is driven by responses on RD trials. The signs are reversed for RD and Risk RA-RD because higher risk-taking on RD trials translates into lower Risk RA-RD difference scores.
The relation between Surgency and expected value sensitivity, while smaller in magnitude, was in the same direction as for the measures of Numeracy and Decision Matrix. Surgency was also negatively related to risk taking on the Cups task. Higher Surgency has been related to a multitude of behaviors, most notably impulsive tendencies and negative outcomes; however, Surgency also encompasses approach-oriented behaviors and reward-seeking (Derryberry & Rothbart, 1997; Rothbart, 1989). In this way, our findings support the idea that higher Surgency facilitates the ability to approach and make decisions to achieve more positive outcomes.
While directionally consistent with the above results, the effects of Effortful Control on Risk RA-RD and RD were not quite significant. However, a component of Effortful Control, inhibitory control, was significantly related to Risk RA-RD, r=.16, p<.05. Finally, both Effortful Control and Surgency were negatively related to Attribute Framing effects, although these relations were relatively weak and not quite significant. Based on our earlier suggestion that emotions play a greater role in Attribute Framing than in Risky Choice Framing, it appears that those scoring high on Effortful Control or Surgency were more resistant to the emotional cues provided by attribute framing labels.
While a number of results were negative, Table 1 shows that there were systematic predictors of individual differences on some of our task measures. In the next sections we examine the role of children’s age on these various performance measures.
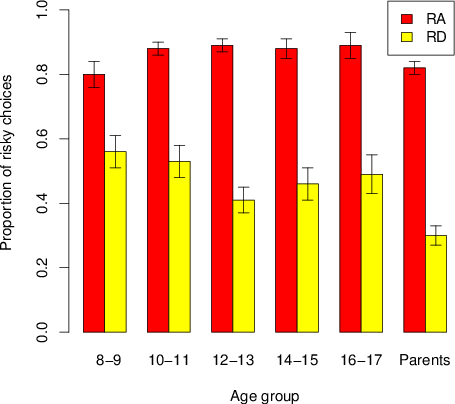
Figure 1: Risk taking in risky-choice framing.
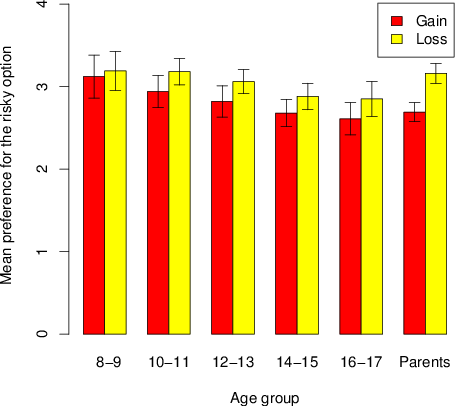
Figure 1 plots degree of preference for the risky option for gains and losses across age groups. In response to Research Question 3, the Risky Choice Framing effect (risk preference on loss trials minus gain trials as seen by the difference in elevation between the yellow and red bars) did not change linearly across child age, F(1, 169)=1.43, p=.23, and was not quite significantly greater for adults than for all children, F(1, 262)=3.25, p=.07.
Figure 2: Attribute framing. 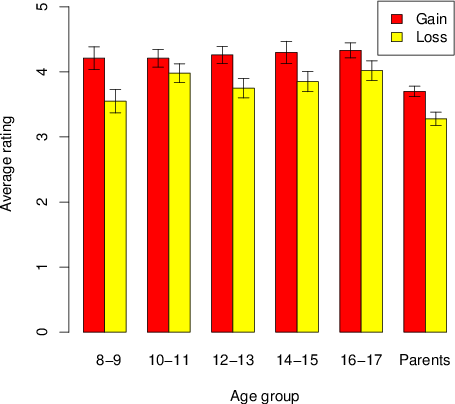
In response to Research Question 4, preference for the risky option decreased across child ages (the linear decreasing trend was significant, F(1, 170)=4.34, p < .05). However, neither the difference between adults and the average of all children nor the difference between adults and the oldest (16–17 years) children approached statistical significance, F(1, 266)=.07 and 1.45, p > .05, respectively.
As seen in Figure 2, the Attribute Framing effect (the difference in elevation between the yellow and red bars) was relatively constant across children’s ages and between children and adults, linear trend F(1, 169)=1.85, p=.18, and F(1, 263)=.03, p > .05, respectively.
Figure 3: Risk taking in Cups by domain. 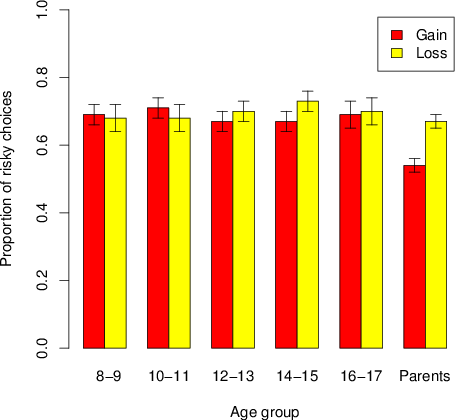
To summarize, in response to Research Question 3, there were no discernible differences in either Attribute or Risky Choice framing effects across age groups. However, in response to Research Question 4, risk taking decreased across child ages in the risky choice framing task.
Figure 4:a. Sensitivity to expected value (RA−RD) in loss domain.
b. Sensitivity to expected value (RA−RD) in gain domain.
Performance on the Cups task can be viewed in several ways: overall level of risk-taking, differential risk-taking between gain and loss trials, and differential risk-taking between RA and RD trials (expected value sensitivity). As seen in Figure 3, which plots the proportion of risky choices made on gain trials and loss trials (including RA, EQEV and RD variations) at each age level, overall risk-taking is relatively constant across child ages, linear trend F(1, 169)=0.08. However, combining the data over gain and loss trials, but especially on gain trials, it is less for adults (Mdiff =1.21, SD=.36) than for children (Mdiff =1.38, SD=.32), F(1, 265)=15.66, p<.01). These findings in response to Research Question 4 are similar to those of Weller et al. (2011) who used slightly different age groups. The different result for the Risky Choice Framing task and the Cups task will be discussed later. The difference between risk-taking for gain and loss trials was negligible and similar for all child age groups, linear trend F(1, 169)=1.44, p=.23, but was significantly greater for adults (Mdiff =−.12, SD=.26) than for children (Mdiff=−.01, SD=.22), F(1, 265) = 13.60, p<.01.
Figure 4 plots sensitivity to expected value, as operationalized by RA-RD differences, across age groups and type of trial. In response to Research Question 5, sensitivity increased across child ages and then increased further into adulthood. The top panel (loss trials) shows an increase in expected value sensitivity starting at early ages, and increasing further for adults. The linear trend across child ages was significant, F(1, 169)=4.93, p<.03 but Tukey pairwise contrasts revealed that most of this difference is attributable to the youngest (8–9 years) group compared to the others. Similarly, adults (Mdiff=.46, SD=.38) showed significantly greater differences than children (Mdiff =.19, SD=.33) on average, F(1, 265)=11.80, p<.01, but a Tukey pairwise contrast of the difference between adults and children of ages 12 to 17 was not quite significant, F(1, 265)=3.46, p=.06. The bottom panel (gain trials) shows a pattern of increased sensitivity across all age levels, then a leveling off, but increasing for adults, linear trend across child age F(1, 169)=8.14, p<.01 and F(1, 265)=35.60, p<.01 for adults (Mdiff =.52, SD=.36) versus children (Mdiff =.38, SD=.32). These patterns are quite similar to those reported by Weller et al. (2011). As can be seen in Figure 4, the effects are due almost exclusively to differences on RD trials.
In order to address Research Question 6 concerning possible mediators of age-related differences in task performance, we start by searching for age-related differences in our individual difference measures. Numeracy and Surgency were each significantly correlated with child age, r=.42, p<.001 and r=.25, p=.007, respectively. Neither Decision Matrix nor Effortful Control were significantly correlated with child age, (r=.12, p=.12 and r=.02, p=.82, respectively).
The ability to discriminate between expected value outcomes of risk-advantageous (RA) and risk-disadvantageous (RD) choices on the Cups task increased with age. We used a multiple regression analysis to determine the extent to which Numeracy and Surgency mediate the age effect. Only one variable, Numeracy, was a pure mediator of the relationship between age and expected value sensitivity. We used standard Process Modeling (Hayes, 2009), and the program PROCESS (Hayes, 2012), to perform the analysis. The path from Age to expected value sensitivity is significant, with β coefficient of .46, p<.001 and the path from Age to the mediator, Numeracy, is significant with β coefficient .26, p<.001. When both Age and Numeracy are in the model, the Age coefficient drops to .13 and is no longer significant (p>.3), while Numeracy remains significant (β =.57, p<.001). Thus, the impact of Age on expected value sensitivity is completely mediated by Numeracy.
Using a similar analysis, we find that Surgency is a partial mediator of expected value sensitivity. We find that both Age (β = .31, p<.03) and Surgency (β = 1.55, p<.02) are significant predictors of expected value sensitivity. No other analyses produced evidence of mediated effects.
We asked which of the basic decision making phenomena reported in the literature for adults are replicated in our sample of children. For the group of children as a whole, the answer is yes for Risky Choice and Attribute Framing effects and for greater risk taking on risk-advantageous than risk-disadvantageous Cups trials, but no for loss minus gain differences in risk taking on the Cups task.
We also asked if there were discernible age differences on our key performance measures. There were differences in risk taking on the Risky Choice Framing task and the Cups task, and differences in responding to risk-advantageous and risk-disadvantageous trials. A related question is whether we find these age differences between children of different ages or whether we find them only when comparing children as a group with adults. The first pattern occurred for overall level of risk taking in the Risky Choice Framing task and for the measure of expected value sensitivity in the Cups task. However, whereas in the latter case the trend continued into adulthood, in the former case it did not. The second pattern was seen in framing effects in the Cups task where the difference in risk taking for loss and gain trials was negligible for all child ages but was significant for adults. These results suggest possible differences in the time course of development, but they need to be verified in subsequent research.
Of the previous research addressing the developmental trends of risky decision making, not all studies have reported identical findings, but most report somewhat greater overall risk taking in children than in adults (e.g., Harbaugh et al., 2002; Levin et al., 2007; Reyna & Ellis, 1994; Schlottmann, 2001; Weller et al., 2011). Our results support this general consensus by showing that risk taking on the Risky Choice Framing task decreased across child ages and that risk taking was less for adults than for children on the Cups task. The current findings of risk taking tendencies also integrate well in relation to established developmental trends on Cups task performance (Weller et al., 2011), with a corresponding increase in RA-RD across child ages and into adulthood.
In relation to the developmental trends found for framing effects, prior findings are more mixed. Some studies suggest the framing effect becomes more evident with increasing age, while other studies indicate that the effect is less pronounced in children compared to young adults (e.g., Levin & Hart, 2003; Levin et al., 2007; Schlottmann & Tring, 2005; Weller et al., 2011); however, a review of the literature by Strough et al. (2011) suggests that the framing effect is apparent in decisions about gains and losses beginning in middle childhood and remains relatively stable across the life span.
Some of this disparity in framing effect trends may be related to the types of scenarios and choices presented in the framing task. As noted in Reyna et al. (2011), smaller monetary rewards tend to elicit more similar framing effects for adolescents and adults, but larger monetary rewards elicit reverse framing in adolescents—choosing the risky option more often in the gain frame than the loss frame. Our work focuses on scenarios where the potential rewards are considerably smaller and use an age range that centers on middle childhood; thus our findings predominantly indicate significant standard framing effects at all child ages. A not quite significant tendency for Risky Choice Framing effects to be greater for adults did appear; however, this result may stem from the somewhat more consequential gains and losses presented in the Risky Choice Framing scenarios (e.g., how many animal lives were saved/lost) compared to the Attribute Framing scenarios (e.g., number of students who cheat/do not cheat) or the Cups task (e.g., small monetary rewards).
The lack of reliable gain-loss differences in risk taking appears to be at variance with previous results with the Cups task. However, Weller et al. (2011) found a discontinuity on this measure between younger children and college-age (see their Figure 1). The current Figure 3 shows differences within that age gap and a post-hoc analysis revealed a not quite significant (p=.08, 2-tailed) tendency for more risks to be taken on loss than on gain trials for ages 12 to 15.The age gap in the present study is between age 18 and parent age which averages 45. It remains for future studies to fill in the age gap and further investigate the interesting question of when age-related changes in various facets of decision making represent continuous versus discontinuous trends.
We asked if there are individual difference factors that account for differences within an age level or that account for differences between age levels. The underlying issue here is whether there is a systematic relation between the decision processes captured by different task measures and the nature of the individual difference measures. The strongest evidence comes from correlations of r=.3 or greater between both Numeracy and Decision Matrix and our measure of expected value sensitivity on the Cups task, (RA trials-RD trials). Our conjecture is that both Numeracy and Decision Matrix represent individual differences in the ability and effort to process numerical information in making decisions, and that the RA-RD measure of sensitivity to expected value differences between choice options taps into that ability/effort. However, consistent with the conjecture that expected value sensitivity in risky decision making represents both the ability to differentiate between advantageous and disadvantageous risks and the ability to overcome impulsive risk-taking, we found that the measures of Effortful Control and Surgency were also correlated with this measure as well as with risks taken on RD trials alone, Attribute Framing effects, and in the case of Surgency, risk taking in the Cups task. It is our conjecture here that Effortful Control, in particular, represents the ability to suppress emotional reactions to outcome valence which is captured by our task measures of riskiness of choices and Attribute Framing effects. Interestingly, Surgency appears to combine reactions to affective stimuli and the optimal use of available information. It is noteworthy, though, that those traits involving reactions to affective or emotional stimuli had smaller effects than those traits involving cognition or information processing. Evidence for the mediating role of individual difference measures on age-related effects was provided by Numeracy, and to a lesser extent Surgency, as mediators of child age effects on expected value sensitivity (and risks taken on RD trials alone).
Evidence for ongoing maturational processes that continue into adulthood is provided by our measure based on expected value differences in the Cups task. The gradual increase in sensitivity to expected value across childhood and continuing into adulthood is clearly an indication that the cognitive ability and propensity to process information related to expected value differences do not reach complete maturity in late adolescence and is highlighted by the mediating role of increasing Numeracy.
Maturational processes that peak in late adolescence may be manifest in the overall level of risk-taking in the Risky Choice Framing task where risky choices decrease over the childhood years but do not decrease further into adulthood. In the absence of a specified path of mediation, this decline may be attributed to the accumulated negative experiences in everyday life from overly risky choices, resulting in the summation of prior negative outcomes. Evidence of developmental processes that progress slowly over the childhood years, but have not yet peaked in our age range occurs on several measures. Overall risk-taking on the Cups task is uniformly high for all child ages but is significantly less for adults. As with risk-taking on the Risky Choice Framing task, the ability to inhibit risky choices is clearly less for children than for adults. The different pattern for risk-taking in the Cups and Risky Choice Framing tasks represents interesting task differences. In the Risky Choice Framing task the expected values of risky and riskless choice options are equated, so there is no normative standard for comparing risky and riskless choices and choosing one over the other. The context is different in the Cups task where the decision maker has to assess the relative expected values on each trial but can learn from experience based on outcome feedback following each trial, a skill not tapped with the Risky Choice Framing task.
Because the ability to process quantitative information and the ability to suppress emotional responses are seen to change both as a child develops and as a function of individual differences, it is critical to be sensitive to these variations in capability. The work we present here illustrates the importance of selecting appropriate task measures within and between age-groups. Here we find measures that are sensitive to the decision making capabilities that vary both across age groups and between individuals within an age group. As a specific example, it is possible that a lack of ability to control impulses may, at times, override more deliberative processing in risk taking, and immature cognitive development may contribute to less discrimination between taking risks that are likely to have favorable and unfavorable outcomes.
The transition from childhood through adolescence and into adulthood has certain cultural expectations and exposes the child to new risk opportunities that involve risky behaviors (Gerrard, Gibbons, Houlihan, Stock & Pomery, 2008). Knowing that these differences in development might be structural and involuntary might inform possible approaches to education or parental policy and guide some very provocative future research testing potential interventions.
Boyer, T. W. (2006). The development of risk-taking: A multi-persepctive review. Developmental Review, 26, 291–345.
Bruine de Bruin, W., Parker, A. M., & Fischhoff, B. (2007). Individual differences in adult decision-making competence. Journal of Personality and Social Psychology, 92, 938–956.
Capaldi, D. M., & Rothbart, M. K. (1992). Development and validation of an early adolescent temperament measure. The Journal of Early Adolescence, 12(2), 153–173.
Casey, B. J., Getz, S., & Galvan, A. (2008). The adolescent brain. Developmental Review, 28, 62–77.
Crone, E. A., Bunge, S., Latenstein, H., & van der Molen, M. W. (2005). Characterization of children’s decision making: sensitivity to punishment frequency, not task complexity. Child Neuropsychology, 11(3), 245–263.
Del Missier, F., Mäntylä, T., & Bruine de Bruin, W. (2012). Decision-making competence, executive functioning, and general cognitive abilities. Journal of Behavioral Decision Making, 25, 331–351.
Derryberry, D., & Rothbart, M. K. (1997). Reactive and effortful processes in the organization of temperament. Development and psychopathology, 9(4), 633–652.
Ellis, L. K., & Rothbart, M. K. (2001). Revision of the Early Adolescent Temperament Questionnaire. Poster presented at the 2001 Biennial Meeting of the Society for Research in Child Development, Minneapolis, Minnesota.
Finucane, M. L., & Gullion, C. M. (2010). Developing a tool for measuring the decision-making competence of older adults. Psychology and Aging, 25(2), 271–288.
Fischhoff, B., Parker, A. M., Bruine De Bruin, W., Downs, J., Palmgren, C., Daws, R., & Manski, C. (2000). Teen expectations for significant life events. Public Opinion Quarterly, 64, 189–205
Freling, T. H., Vincent, L. H., & Henard, D. H. (2014). When not to accentuate the positive: Re-examining valence effects in attribute framing. Organizational Behavior and Human Decision Processes, 124, 95–109.
Galvan, A., Hare, T., Voss, H., Glover, G., & Casey, B. J. (2007). Risk-taking and the adolescent brain: who is at risk? Developmental Science, 10(2), F8–F14.
Galvan, A., Hare, T. A., Parra, C. E., Penn, J., Voss, H., Glover, G., & Casey, B. J. (2006). Earlier development of the accumbens relative to orbitofrontal cortex might underlie risk taking behavior in adolescents. Journal of Neuroscience, 26, 6885–6892.
Gerrard, M., Gibbons, F. X., Houlihan, A. E., Stock, M. L., & Pomery, E. A. (2008). A dual process approach to health risk decision-making: The prototype-willingnes model. Developmental Review, 28, 29–61.
Harbaugh, W. T., Krause, K., & Vesterlund, L. (2002). Risk attitudes of children and adults: Choices over small and large probability gains and losses. Experimental Economics, 5(1), 53–84.
Hayes, A. F. (2009): Beyond Baron and Kenny: Statistical mediation analysis in the new millennium, Communication Monographs, 76(4), 408–420.
Hayes, A. F. (2012). PROCESS: A versatile computaional tool for observed variable mediation, moderation, and conditional process modeling [White Paper]. Retrived from http://www.afhayes.com/public/process2012.pdf
Kahneman, D., & Tversky, A. (1979). Prospect Theory—analysis of decision making under risk, Econometrica, 47,.263–291.
Kokis, J. V., Macpherson, R., Toplak, M. E., West, R. F., & Stanovich, K. E. (2002). Heuristic and analytic processing: Age trends and associations with cognitive ability and cognitive styles. Journal of Experimental Child Psychology, 83, 26–52.
Levin, I. P. (1999). Why do you and I make difference decisions? Tracking individual differences in decision making. Presidential Address for Society for Judgment and Decision Making, Los Angeles, CA.
Levin, I. P., & Gaeth, G. J. (1988). How consumers are affected by the framing of attribute information before and after consuming the product. Journal of Consumer Research, 15, 374–378.
Levin, I. P., Gaeth, G. J., Schreiber, J., & Lauriola, M. (2002). A new look at framing effects: Distribution of effect sizes, individual differences, and independence of types of effects. Organizational Behavior and Human Decision Processes, 88, 411–429.
Levin, I. P., & Hart, S. S.(2003). Risk preferences in young children, Early evidence of individual differences in reaction to potential gains and losses. Journal of Behavioral Decision Making, 16, 397–413.
Levin, I. P., Hart, S. S., Weller, J. A., & Harshman, L. A. (2007). Stability of choices in a risky decision-making task: a 3-year longitudinal study with children and adults. Journal of behavioral decision making, 20(3), 241 -252.
Levin, I. P., McElroy, T., Gaeth, G. J., Hedgcock, W., & Denburg, W. (2014) Behavioral and neuroscience methods for studying neuroeconomics processes: what we can learn from framing effects. In V. F. Reyna & V. Zayas (Eds), The neuroscience of risky decision making, pp. 43–69. Washington, DC: American Psychological Association.
Levin, I. P., Schneider, S. L., & Gaeth, G. J. (1998). All frames are not created equal: A typology and critical analysis of framing effects. Organizational Behavior and Human Decision Processes, 76, 149–188.
Lipkus, I. M., Samsa, G., & Rimer, B. K. (2001). General performance on a numeracy scale among highly educated samples. Medical Decision Making, 21(1), 37–44.
Mahoney, K. T., Buboltz, W., Levin, I. P., Doverspike, D., & Svyantek, D. J. (2011). Individual differences in a within-subjects risky-choice framing study. Personality and Individual Differences, 51, 248–257.
Muris, P., & Meesters, C. (2009). Reactive and regulative temperament in youths: Psychometric evaluation of the early adolescent temperament questionnaire-revised. Journal of Psychopathology and Behavioral Assessment, 31, 7–19.
Parker, A. M., & Fischhoff, B. (2005). Decision-making competence: External validation through an individual-differences approach. Journal of Behavioral Decision Making, 18, 1–27.
Payne, J. W., Bettman, J. R., & Johnson, E. J. (1993). The adaptive decision maker. New York: Cambridge University Press.
Peters, E., Hibbard, J., Slovic, P., & Dieckmann, N. (2007). Numeracy skill and the communication, comprehension, and use of risk-benefit information. Health Affairs, 26(3), 741–748.
Peters, E., & Levin, I. P. (2008). Dissecting the risky-choice framing effect: Numeracy as an individual difference factor in weighting risky and riskless options. Judgment and Decision Making, 3, 435–448.
Reyna, V. F., & Ellis, S. C. (1994). Fuzzy-Trace Theory and framing effects in children’s risky decision making. Psychological Science, 5, 275–279.
Reyna, V. F., Estrada, S. M., DeMarinis, J. A., Myers, R. M., Stanisz, J. M., & Mills, B. A. (2011). Neurobiological and memory models of risky decision making in adolescents versus young adults. Journal of Experimental Psychology: Learning, Memory, and Cognition, 37(5), 1125–1142.
Reyna, V. F., & Farley, F. (2006). Risk and rationality in adolescent decision making: Implications for theory, practice, and public policy. Psychological Science in the Public Interest, 7, 1–44.
Reyna, V. F., Nelson, W. L., Han, P. K., & Dieckmann, N. F. (2009). How numeracy influences risk comprehension and medical decision making. Psychological Bulletin, 135, 943–973.
Rothbart, M. K. (1989). Temperament in childhood: A framework. Temperament in childhood, 59–73.
Rothbart, M. K., & Bates, J. E. (1998). Temperament. In W. Damon (Series Ed.) and N. Eisenberg. Handbook of child psychology: Social, emotional and personality development, 3, 105–176.
Schlottmann, A. (2001). Children’s probability intuitions: Understanding the expected value of complex gambles. Child Development, 72, 103–122.
Schlottmann A., & Tring, J. (2005). How children reason about gains and losses: Framing effects in judgement and choice. Swiss Journal of Psychology, 64(3), 153–171.
Simon, A. F., Fagley, N. S., & Halleran, J. G. (2004). Decision framing: Moderating effects of individual differences and cognitive processing. Journal of Behavioral Decision Making, 17, 77–93.
Smith, S. M., & Levin, I. P. (1996). Need for cognition and choice framing effects. Journal of Behavioral Decision Making, 9, 283–290.
Stanovich, K. E. (1999). Who is rational? Studies of individual differences in reasoning. Mahwah, NJ: Erlbaum.
Stanovich, K. E., & West, R. F. (1998a). Cognitive ability and variation in selection task performance. Thinking and Reasoning, 4, 193–230.
Stanovich, K. E., & West, R. F. (1998b). Individual differences in rational thought. Journal of Experimental Psychology: General, 127, 161–188.
Stanovich, K. E., & West, R. F. (2000). Individual differences in reasoning: Implications for the rationality debate? The Behavioral and Brain Sciences, 23, 645–665.
Strough, J., Karns, T. E., & Schlosnagle, L. (2011), Decision-making heuristics and biases across the life span. Annals of the New York Academy of Sciences, 1235, 57–74.
Toplak, M. E., West, R. F., & Stanovich, K. E. (2014). Rational thinking and cognitive sophistication: Development, cognitive abilities, and thinking dispositions. Developmental Psychology, 50(4), 1037–1048.
Tversky, A., & Kahneman, D. (1981). The framing of decisions and the psychology of choice. Science, 211, 453–458.
van Leijenhorst, L., Westenberg, P. M., & Crone, E. A. (2008). A developmental study of risky decisions on the cake gambling task: Age and gender analyses of probability estimation and reward evaluation. Developmental Neuropsychology, 33(2), 179–196.
Weller, J. A., Levin, I. P., & Denburg, N. L. (2011). Trajectory of risky decision making for potential gains and losses from ages 5 to 85. Journal of Behavioral Decision Making, 9, 331–344.
Weller, J. A., Levin, I. P., Rose, J. P., & Bossard, E. (2012). Assessment of decision-making competence in preadolescence. Journal of Behavioral Decision Making, 25(4), 414–426.
Weller, J. A., Moholy, M., Bossard, E., & Levin, I. P. (in press). Pre-adolescent decision-making competence predicts interpersonal strengths and difficulties: A two-year prospective study. Journal of Behavioral Decision Making.
The following are the question numbers (as listed in the survey data) separated into which trait they represent. Questions marked with an “R” need to be reverse-coded: 1 = 5, 2 = 4, 3 = 3, 4 = 2, 5 = 1. Then simply average the question responses for each category to get an overall trait score.
| 4R | I have a hard time finishing things on time. |
| 10R | I do something fun for a while before starting my homework, even when I’m not supposed to. |
| 16 | If I have a hard assignment to do, I get started right away. |
| 23 | I finish my homework before the due date. |
| 32R | I put off working on projects until right before they’re due. |
| 1 | It is easy for me to really concentrate on homework problems. |
| 19R | I find it hard to shift gears when I go from one class to another at school. |
| 22R | When trying to study, I have difficulty tuning out background noise and concentrating. |
| 25 | I’m good at keeping track of several different things that are happening around me. |
| 38 | I pay close attention when someone tells me how to do something. |
| 40R | I tend to get in the middle of one thing, then go off and do something else. |
| 17 | I get frightened riding with a person who likes to speed. |
| 20 | I worry about my family when I am not with them. |
| 24 | I worry about getting into trouble. |
| 29 | I’m nervous of some of the kids at school who push people into lockers and throw your books around. |
| 33 | I worry about my parents dying or leaving. |
| 37 | I feel scared when I enter a darkened room at home. |
| 13 | It bothers me when I try to make a phone call and the line is busy. |
| 21 | I get very upset if I want to do something and my parents won’t let me. |
| 30 | I get irritated when I have to stop doing something that I am enjoying. |
| 36 | It really annoys me to wait in long lines. |
| 39 | I get very frustrated when I make a mistake in my school work. |
| 41 | It frustrates me if people interrupt me when I am talking. |
| 43 | I get upset if I am not able to do a task really well. |
| 6R | It’s hard for me not to open presents before I’m supposed to. |
| 7 | When someone tells me to stop doing something, it’s easy for me to stop. |
| 14R | The more I try to stop myself from doing something I shouldn’t, the more likely I am to do it. |
| 27 | It’s easy for me to keep a secret. |
| 42 | I can stick with my plans and goals. |
| 3 | I like to feel a warm breeze blowing on my face. |
| 9 | I enjoy listening to the birds sing. |
| 12 | I like to look at the pattern of clouds in the sky. |
| 18 | I like to look at trees and walk amongst them. |
| 44 | I like the crunching sound of autumn leaves. |
| 5 | I feel shy with kids of the opposite sex. |
| 8 | I feel shy about meeting new people. |
| 28 | I am shy. |
| 35R | I am not shy. |
| 2 | I think it would be exciting to move to a new city. |
| 11R | I wouldn’t like living in a really big city,even if it was safe. |
| 15R | Skiing fast down a steep slope sounds scary to me. |
| 26 | I would not be afraid to try a risky sport, like deep-sea diving. |
| 31 | I wouldn’t be afraid to try something like mountain climbing. |
| 34 | I enjoy going places where there are big crowds and lots of excitement. |
Attention + Activation Control + Inhibitory Control
1,19R, 22R, 25, 38, 40R, 4R,10R, 16, 23, 32R, 6R,7,14R,27,42
High Intensity Pleasure + Shyness + Fear
2,11R, 15R, 26, 31, 34, 5, 8, 28, 35R, 17, 20, 24, 29, 33, 37
Copyright: © 2014. The authors license this article under the terms of the Creative Commons Attribution 3.0 License.
This document was translated from LATEX by HEVEA.