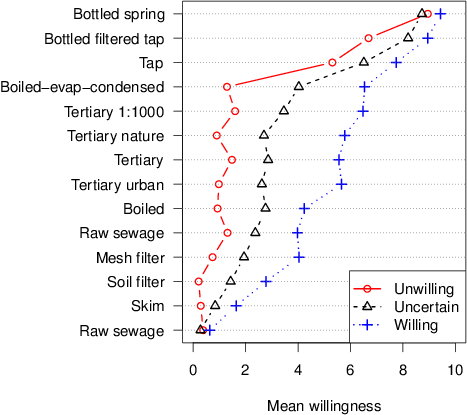
| Figure 1: Willingness to drink water as a function of processing by initial willingness. Plus signs: willing to try subjects; triangles: uncertain about trying, circles: unwilling to try. |
Judgment and Decision Making, Vol. 10, No. 1, January 2015, pp. 50-63
Psychological aspects of the rejection of recycled water: Contamination, purification and disgustPaul Rozin* Brent Haddad# Carol Nemeroff$ Paul Slovic§ |
There is a worldwide and increasing shortage of potable fresh water. Modern water reclamation technologies can alleviate much of the problem by converting wastewater directly into drinking water, but there is public resistance to these approaches that has its basis largely in psychology. A psychological problem is encapsulated in the saying of those opposing recycled water: “toilet to tap.” We report the results of two surveys, one on a sample of over 2,000 Americans from five metropolitan areas and the second on a smaller sample of American undergraduates, both assessing attitudes to water and water purification. Approximately 13% of our adult American sample definitely refuses to try recycled water, while 49% are willing to try it, with 38% uncertain. Both disgust and contamination sensitivity predict resistance to consumption of recycled water. For a minority of individuals, no overt treatment of wastewater will make it acceptable for drinking (“spiritual contagion”), even if the resultant water is purer than drinking or bottled water. Tap water is reliably rated as significantly more desirable than wastewater that has undergone substantially greater purification than occurs with normal tap water. Framing and contagion are two basic psychological processes that influence recycled water rejection.
Keywords: water, purification, contamination, shortage, disgust.
Although the earth is a “blue” planet, an extremely small proportion—well below 1%—of its total water endowment presents itself as usable fresh water. This water arrives annually as snow or rainfall, or is present year-to-year as surface fresh waters, groundwater, or in living biomass. Water plays fundamental and vital roles, constituting over 50% of the weight of humans, as a fundamental requirement for all living creatures, and hence all foods. Water is the most important nutrient, and lack of water causes death more rapidly than the lack of any other nutrient. Water technologies, developed over millennia, have resulted in agricultural irrigation projects, and have enabled the existence of modern cities. The intensity and frequency of use of the earth’s fresh-water supplies are growing, and major shortages exist already in places including the Middle East, much of Australia, and the American Southwest. Indeed it has been claimed that wars in the near future will be fought not over oil, but over water (Lapping, 2011). Yet, nearly all of the technical problems of treatment and delivery of potable water have been solved. In areas where project costs and technical issues are tractable, the problem is now in large part psychological: lack of acceptance of water produced by modern techniques that cut the time and distance that would naturally intervene between wastewater discharge and potable water generation. This can now be accomplished directly by on-site treatment of wastewater.
The informal or inadvertent reuse of urban wastewater has been practiced throughout time. Historically, “downstream” users relied on the (imperfect) purification abilities of natural systems (rivers, lakes, and aquifers) supplemented by their own treatment actions prior to consumption. More recently, the discharging city has been required to treat its wastewater before releasing it back into a natural system. And even more recently, as the need grows for additional potable water and as treatment technologies have advanced, the planned reuse of urban wastewater has expanded (NRC, 2012). Water treatment plants are divided into four zones: primary treatment that physically separates wastes from water; secondary treatment that uses friendly microbes to break down, remove, and/or neutralize unwanted biological elements; tertiary treatment that employs filters to remove additional unwanted biological material; and advanced treatment that utilizes membranes in pressurized vessels to remove nearly all non-H2O biota and chemicals. A disinfection step is the final treatment activity before water is released. Nearly all facilities in the U.S. have primary and secondary systems, which are required by law. A growing number have tertiary and advanced systems, which constitute costly additional infrastructure, but result in almost completely pure and safe drinking water. In this paper we refer to water that has gone through at least the first three stages as “recycled water.”
The public acceptance of water reuse is the topic of this paper. In a democratic and litigious society, a committed minority can drastically slow down institutional changes that clearly serve the public good. In Singapore, a quasi-democratic society, it is easier to ignore vocal minorities, and recycled water has made great strides. Recent research on acceptance of treated urban wastewater suggests that recycled water acceptance is influenced by: 1) the words used to describe the water (Menegaki et al., 2009); 2) knowledge of treatment processes (Dolnicar et al., 2010), and 3) level of trust in the purveyor of the water (Doria, 2010). Po, Moloney and Blair (2003) and Russell and Lux (2006) review research on acceptability, focusing on the Australian context. The focus in the present paper is on understanding one theme that underlies opposition to recycled water: the emotion of disgust and ideas of contamination. Assurance that water is scientifically documented as pure or uncontaminated is not sufficient for some adults. The “toilet-to-tap” mantra of the opponents of recycled water in the American Southwest can be powerful. It calls upon our revulsion at waste, and our deep-seated intuitions about contamination. This problem falls under what Paul Slovic and his colleagues have called “intuitive toxicology”, and raises complex issues of the assessment of risk, including human feelings as part of the calculation of costs and benefits, and the communication of risk (Kraus, Thobjorn & Slovic, 2002).
The fact is that all water is physically contaminated. Our colleague, geologist Robert Giegengack, has calculated for us that it is impossible to drink a glass of water in Europe without ingesting at least a few water molecules that passed through the body of Adolf Hitler! (It takes about 2,000 years for water to equilibrate around the earth, which is why this does not hold for North America or other areas distant from Europe. On the other hand, we are all drinking Moses molecules when we drink a glass of water.)
Some people are ready to accept recycled water, but a minority resist it strongly (see reviews by Po, Kaercher & Nancarrow, 2003; Russell & Lux, 2006). One presumable basis for this resistance is a reaction to the thought of drinking water generated from urban wastewater. This elicits the often powerful emotion of disgust, which causes a feeling of offense and a behavioral withdrawal from the relevant entity (Rozin, Haidt & McCauley, 2008). A review of the literature on acceptance of recycled water suggests that one component of rejection is disgust, or the “yuck” factor (Po et al, 2003). The focus of disgust is a reaction to spoilage and to bodily products (Rozin & Fallon, 1987). These are, of course, major components of urban wastewater.
Disgust is all the more salient and potentially problematic because disgusting entities show magical contagion properties. Around the turn of the 20th century, three anthropologists (Frazer 1890/1959; Mauss, 1902/1972; Tylor, 1871/1974) described the magical law of contagion, a belief ascribed to “primitive” peoples but also believed to reflect a fundamental principle of human thinking. The magical law of contagion, or as we have come to describe it, the intuitive contagion heuristic, holds that “once in contact, always in contact.” That is, when two entities come into contact, they exchange properties or “essences”. The matter is of particular concern and importance when one of the objects is disgusting. Thus, anything that touches something disgusting becomes disgusting. In the 1980s, Rozin, Nemeroff and colleagues showed that magical contagion beliefs are widespread in American adults (Rozin, Millman, & Nemeroff, 1986; Rozin, Nemeroff, Wane, & Sherrod, 1989). For example, if a heat sterilized dead cockroach is briefly dipped into a glass containing a previously desirable beverage, that beverage becomes psychologically contaminated, and hence unacceptable (Rozin et al., 1986). So far as we know, all normal adults around the world show magical contagion beliefs with respect to some contaminants. These beliefs arise somewhere between four and six years of age (Fallon, Rozin, & Pliner, 1984; Rozin, Fallon, & Augustoni-Ziskind, 1985; Hejmadi, Rozin, & Siegal, 2004; Siegal, 1988). We have identified the magical law of contagion as a cognitive heuristic, that is, a time and effort saving cognitive rule of thumb which allows for rapid and generally effective decision-making under conditions of uncertainty that are characteristic of daily life (Nisbett & Ross, 1980; Rozin & Nemeroff, 2002). Recent work by Callaghan, Moloney, & Blair (2012) suggests, based on coded free responses to the issue of water recycling, that contagion is a major theme of concern for Australians. One can reasonably consider the “contagion heuristic” as a component of a set of adaptations that effectively reduce the probability of infection, designated as the “behavioral immune system” by Schaller and Park (2011).
Analysis of contagion beliefs in adult Americans suggest that there are at least two mental models of what is passed when contagion occurs (Nemeroff & Rozin, 1994). One, which we call material contagion, is conceived as some sort of physical substance and hence can be neutralized by some combination of washing, filtering, boiling and other treatments. The other is spiritual contagion, conceived of in terms of the entrance into the target of some spiritual essence which does not resemble standard physical entities. It does not respond to washing, boiling or filtering, but remains as a permanent essence. An example is the sports locker rooms at Pennsylvania State University, which, following revelations of child abuse occurring there, made student athletes feel “uncomfortable” to use, and will be renovated (Associated Press, 2012). If the sense of spiritual contagion can be cancelled at all, it is with an opposite spiritual essence, as when Mother Teresa wears Hitler’s sweater (Nemeroff & Rozin, 1994). Most Americans carry both models of contagion in their heads, generally applying material models to germs and toxins, and spiritual models to moral offences. However, some people operate with only a material model and others with only a spiritual model, applied across all contamination scenarios (Nemeroff & Rozin, 1994). The degree of change in acceptability as a function of different purifications generally allows inference of whether one faces a spiritual or material contagion model. It is important to note that intuitive contagion can also be positive, i.e., that the essence that is transmitted can carry positive features, which is why Mother Theresa can in some cases cancel out Hitlerness.
Four properties of magical contagion beliefs are particularly relevant to understanding water contamination (Rozin et al., 1986, 1989; Nemeroff & Rozin, 1994; Nemeroff & Rozin, 2000; Rozin & Nemeroff, 2002).
1. Physical contact is necessary for contagion to be effective.
2. Permanence: Once magical contamination has occurred, it tends to be permanent. Neither time nor spatial distance reduce the effect substantially.
3. Dose insensitivity: Very brief contact with a disgusting entity is sufficient to endow a target entity with disgust properties.
4. Resistance of contaminated entities to purification. This amounts to indelibility of contamination for some contaminants and some individuals (Nemeroff & Rozin, 1994).
Clearly, these features bode badly for acceptance of recycled wastewater, at least in the absence of some psychological intervention. In this paper, we explore four hypotheses:
We explore, in two studies, the nature and importance of disgust and contagion/ contamination beliefs in understanding the rejection of recycled water. Individual sensitivity to disgust varies widely, and is usually measured with the DScale (Haidt, McCauley, & Rozin, 1994), or its modified version, the DS-R scale (Olatunji et al., 2007). Unlike the case for disgust, there is no generally accepted measure of contagion sensitivity. We develop a relevant measure in Study 2. Also, since there are resemblances between contamination sensitivity and obsessive compulsive disorder, we include a standard measure of the latter in Study 2.
In a large scale study (Haddad et al., 2009), we have addressed the psychological bases of rejection of recycled water in reasonably representative samples of five American metropolitan areas, three of which experience chronic water shortages. Study 1 reports a subset of the data collected, relevant to disgust and contagion.
Short surveys were distributed and collected in public places, primarily train stations, at five cities around the United States. There were 2,680 subjects, with 1297 (48.4%) female. Mean age was 37.93 years (SD =15.55), and mean education was 14.77 years (SD=2.80). The principal religions were Protestant (29.6%) and Catholic (26.0%). The subjects were solicited from Phoenix, Arizona (24.1%), San Diego, California (25.1%), San Jose, California (16.0%), Eugene, Oregon (11.4%), and Philadelphia, Pennsylvania (23.4%). For the California and Arizona samples, a questionnaire in Spanish (translated and back-translated) was available to subjects who preferred that language). Three of the metropolitan areas (Phoenix, San Diego and San Jose) regularly experience water shortages.
All of the questionnaires distributed were a single two-sided page. The brevity is a consequence of the sampling strategy, which aimed to obtain a broad cross-section of the population; respondents were solicited while they were waiting in train stations and other public places, and so had relatively little time. Participation was rewarded with an inexpensive automatic pencil or other “gift” valued at about $.50. Completion took a few minutes. In order to balance a large number of questions with the need for brevity, there were seven forms of the questionnaire. The first page was identical in all forms and included standard demographic information, and questions about willingness to drink recycled water. The second page contained different items for each form. Thus most questions were asked of only 1/7 of subjects, 300–400 respondents for each form.
A critical question about recycled water was asked of all subjects, on the first page of all seven versions of the survey:
“Recycled” water is water that is separated from wastewater and highly treated so it can be used again. It is also called “reclaimed water” and “water reuse.” It has become an important political issue nation-wide, such as in the American west, where there is a shortage of “natural” water, such as the Colorado River. Recycled water has ecological and economic advantages over other sources of water, but some people object to its use as drinking water. This survey is an attempt to understand the nature of this objection, and is part of a research program carried out jointly by scientists at the University of California at Santa Cruz, the Universities of Pennsylvania and Oregon, and Arizona State University. The questionnaire is anonymous. Your name does not appear on it.Would you be willing to drink certified safe recycled water?
NO UNCERTAIN YES
We report results here from three of the seven questionnaire forms. One included scaled measures of disgust and contamination sensitivity. We used a shortened 8-item version of the disgust sensitivity scale (Haidt, McCauley, & Rozin, 1994) to measure disgust sensitivity (included in the Appendix). There is no generally accepted and validated contagion scale. Therefore, also on the first questionnaire form, we used the Perceived Vulnerability to Disease scale to measure sensitivity to contagion (Park, Faulkner, & Schaller, 2003). This scale includes two subscales: personal susceptibility to disease (PVDSusc8) and attitudes/behaviors to interpersonal contact (PVDAtt8) (the terminal “8” refers to the number of items on each scale).
The second questionnaire included a range of transformations of raw sewage water. The items were included in a single order for all subjects, beginning with what was supposed to be generally acceptable versions of water (bottled and tap) and raw sewage water, followed by a sequence of more and more processed raw sewage water (see list of items below). The instructions were:
Now we are going to ask you about your reaction to a set of different kinds of water. In each case, assume you are thirsty and that an eight-ounce glass of the water described is available for you to drink. Assume all the waters below except raw sewage water and boiled sewage water look and taste the SAME.Rate on a scale of 0 to 10, how willing you are to drink each type of water described (0 = totally unwilling/uncomfortable; 10 = totally willing/comfortable)
1. How willing are you to drink commercial bottled water (from a spring)?
2. How willing are you to drink raw sewage water?
3. How willing are you to drink commercial bottled water (filtered tap water)?
4. How willing are you to drink tap water?
5. How willing are you to drink sewage water that has been kept still so lighter things float to the surface and heavier things sink to the bottom, and then all these things are removed?
6. How willing are you to drink sewage water that is filtered through soil to remove remaining living microbes?
7. How willing are you to drink sewage water that is passed through tightly meshed filters to remove any microbes and unwanted chemicals?
8. The combination of the three treatments above (in the order: 1. waste skimmed off bottom and top, 2. filtered through soil, and 3. passed through tightly meshed filters to remove any remaining microbes and unwanted chemicals) is called tertiary treatment. How willing are you to drink sewage water that has been subjected to tertiary treatment?
9. How willing are you to drink sewage water that has been boiled enough to destroy all microbes?
10. How willing are you to drink sewage water that has been boiled enough to destroy all microbes, and then is evaporated, and then condensed and collected as pure water?
11. How willing are you to drink sewage water subjected to tertiary treatment in an attractive natural setting outside of town?
12. How willing are you to drink sewage water subjected to tertiary treatment in an urban water treatment plant?
13. How willing are you to drink 1 part sewage water mixed with 1000 parts pure mountain spring water?
14. How willing are you to drink 1 part tertiary treated sewage water mixed with 1000 parts pure mountain spring water?
Question 14 was followed by:
15. If you scored less than 10 for willingness to drink tertiary treated water (see question #8), what could be done to the tertiary water so that you would be as willing to drink it as you are the bottled spring water?”
The third form of the questionnaire contained items on the role of distance and time as moderators of strength of recycled water aversion. One ordering of items was presented. Items and instructions were as follows:
Rate how comfortable (0 = not comfortable at all to 10 = completely comfortable) you would feel about drinking recycled water that has been certified safe for drinking and then undergoes the following additional treatments:1. The water travels through a pipe directly from the wastewater treatment plant to the pipes that supply water to your city (no additional treatment).
2. Leaving the water treatment plant, the water travels one mile down a swift river.
3. Leaving the water treatment plant, the water travels one hundred miles down a swift river.
4. Leaving the water treatment plant, the water filters through an underground aquifer for 1 year.
5. Leaving the water treatment plant, the water filters through an underground aquifer for 10 years.
6. Leaving the water treatment plant, the water is deposited in a lake or reservoir for 1 year.
7. Leaving the water treatment plant, the water is deposited in a lake or reservoir for 10 years.
This form also included a number of questions about attitudes to recycled water. One of these is particularly relevant to contamination issues, and we include it in the set of results we describe here. The question was:
It is impossible for recycled water to be treated to a high enough quality that I would want to use it.”
The question was responded to with a standard five-point agreement scale:
1 = disagree strongly, 2 = disagree, 3 = neither agree nor disagree, 4 = agree, 5 = agree strongly
Table 1: Willingness to drink recycled water and susceptibility to disgust and contagion.
Scale Unwilling Uncertain Willing ANOVA DISG8 2.861 2.74 2.572 F(2,418) = 5.291** PVDSUSC8 3.41 3.24 3.14 F(2,429) = 1.381 PVDATT8 4.411 4.22 3.942 F(2,430) = 4.378** ** p<.01.
Responses to the question “Would you be willing to drink certified safe recycled water? (NO, UNCERTAIN, YES)” were tabulated from 2,680 American subjects. There was a surprising amount of acceptance of recycled water. Summing across all locations, only 12.9% said definitely no (scored as zero) to willingness to try recycled water, while 38.0% said they would possibly try it (scored as one), and almost half, 49.1% said they would definitely try it (scored as two).
Table 2: Willingness to drink (0-10 Scale) various types of water in order of increasing comfort.
Type of water N Mean S.D. Raw sewage 419 0.46 1.715 Skim** 418 1.175 2.251 Soil filter** 417 1.969 2.72 Mesh filter 417 2.844 3.157 1:1000 Raw sewage 404 3.074 3.493 Boiled** 412 3.369 3.326 Tertiary urban 405 4.017 3.564 Tertiary 412 4.053 3.57 Tertiary nature 407 4.115 3.624 Tertiary 1:1000** 403 4.816 3.91 Boiled-evap-condensed** 410 5.044 3.779 Tap** 419 6.983 3.209 Bottle filtered tap** 419 8.422 2.616 Bottled spring** 419 9.148 2.121 Note: Significance of paired t-test between a row and the row immediately above it. Paired t-test because the unit is the difference between one rating and the one above it for each subject. ** p<.01.
Disgust sensitivity and contagion sensitivity as measured by attitudes to interpersonal contact (PVDATT8) significantly predict willingness to try recycled water, as analyzed by ANOVA and post-hoc tests, displayed in Table 1. In both cases, sensitivity declines significantly as willingness increases. However, self-reported susceptibility to disease (PVDSusc8) did not significantly relate to willingness to try recycled water. Results from the purification sequences are displayed in Table 2, with the items arranged in order of increasing comfort at drinking, on a 0-10 scale. The range in comfort spanned from raw sewage with a mean of .46 to bottled spring water at 9.15.
Skimming produces a slight (less than one point) but significant (p<.01 by paired t-tests in this and all subsequent comparisons) improvement in comfort, and filtering through soil another significant but small improvement relative to skimming. Mesh filtering did not produce a significant improvement over soil filtering, and the same is true for dilution of raw sewage 1:1000 with spring water. Boiling, which would render the water safe from micro-organisms but retain the sewage particulates and color is slightly but significantly better than the prior 1:1000 dilution, but remains extremely uncomfortable (M = 3.37). Even tertiary treatment (skim, soil filter, mesh filter) scores as quite unacceptable (M = 4.02), and it makes no difference whether this is accomplished in an urban or natural setting. Dilution of tertiary water 1:1000 with spring water makes a significant but still small (less than one point) increase in comfort (M = 4.82).
Surprisingly, boiling sewage water, evaporating it and then condensing it, which produces a pure and safe water that is at least as good as tap water, is rated at only 5.04, significantly above diluted tertiary water, but still engendering a great deal of discomfort. Tap water shows the largest jump from its predecessor in the list, at 6.98 (1.84 units on the 10 point scale). This score is surprisingly low considering the acceptability and use of tap water, and yet it is higher than boiled/evaporated/condensed sewage water, which in real-world terms (as opposed to psychological terms) is more purified. Surprisingly again, bottled filtered tap water scores much higher (M = 8.42) than tap water, even though it is essentially the same thing! Bottled spring water scores significantly and substantially higher than bottled tap water (M = 9.15).
One insight from this series of questions is that there is some understanding of the effects of the technological sequence of water purification, in that willingness to consume generally increased with incremental improvements in water quality. (Note that the items were presented, after the first few, in roughly the order of increased processing or purity. This is a potential confound, but we tolerated it because it made the questions much easier to process for the respondents.)
Figure 1: Willingness to drink water as a function of processing by initial willingness. Plus signs: willing to try subjects; triangles: uncertain about trying, circles: unwilling to try.
There are also some striking findings in these results. One is that boiled/evaporated/condensed water, which is pure water, scores notably less (M = 5.03) than tap water (M = 6.99; paired t(409)=9.399, p<.001; d’ = ,46). From the point of view of purity, the former is better, but the procedure is not used in water processing because it is very expensive. The second surprise in the sequence is that bottled filtered tap water scores notably higher (M = 8.42) than tap water (M= 6.98; paired t(417) = 10.569, p<.001, d’ =.52 ). It is not clear whether the substantial increase in comfort comes from the bottling or from the filtering. If the latter, which would be the only rational grounds for a preference, it is surprising how few people put filters on their tap water faucets.
To explore individual differences, we repeated this analysis dividing subjects into those unwilling to sip recycled water (n=43–45), uncertain whether they would sip it (n=159–161), or definitely willing (n=206–211; Figure 1, Table 2). For all stages of purification, the water is (not surprisingly) most acceptable to the willing and least acceptable to the unwilling. The order of effectiveness of the purification techniques is essentially the same for the three groups. The groups are not significantly different in discomfort for raw sewage water (F(2,415) =2.026), the least acceptable form of water, and barely differ for commercial bottled spring water, the most acceptable form ((F(2,414)=4.550, p=.011; unwilling M = 9.00, uncertain M = 8.79; willing M= 9.45; only significant difference is between uncertain and willing, p=.012, by Scheffé test). On the other hand, for the intermediate states of purification, the group differences are large. For boiled/evaporated condensed water, F(2,405) = 55.344, with unwilling M = 1.26; uncertain M = 4.06; willing M = 6.57; all mean pairs differ at p<.001 by Scheffé tests. Similarly, for tertiary treated water, F(2,402) = 69.090, with unwilling M = 0.88; uncertain M = 2.71; willing M = 5.82; all mean pairs differ at p<.001 by Scheffé tests, except unwilling vs uncertain, p<.01 (Figure 1). The unwilling group is essentially unaffected by all of the specific purification techniques described, never rising above a mean rating of 1.6, until tap water, for which there is a very large comfort jump to 5.31. In contrast, the willing subjects showed a steady and substantial increase in comfort with almost every more potent purification technique. Results from the uncertain group are intermediate. Like the unwilling group, the uncertain group showed a very large increase in comfort from boiled/ evaporated/condensed to tap, as opposed to the more gradual increase in the willing group.
The results of the “titration” of purification, reported above, suggest that, for a minority of individuals, water contamination is indelible, and essentially behaves as spiritual contagion. On the third version of the questionnaire, we included a question that assessed this directly: “It is impossible for recycled water to be treated to a high enough quality that I would want to use it.”
Overall, 26% of 380 subjects who received the third questionnaire version agreed (scoring 4 or 5) with this statement. Breaking this down by our standard, first page question on the acceptability of recycled water, 48% (of 44 individuals) who were unwilling to try it, 28% (of 163) individuals who were uncertain about trying it, and 19% (of 174) who were willing to try it endorsed indelibility of contamination in wastewater. There is, of course, some contradiction for the latter 19% between claiming they are willing to try recycled water and reporting that there is no treatment of recycled water that would make it acceptable. An ANOVA on willingness by group based on scores from the 5 point scale was highly significant, F(2,378) = 22.492, p<.001). Individuals uncertain about willingness to try recycled water opted for indelibility significantly more than those willing (Scheffé test p<.01).
A total of 412 people answered the question about comfort with drinking tertiary processed water. Of these, only 48 were totally comfortable (10) with tertiary processed water. Of the 364 eligible to answer the open-ended question about whether anything could be done to this water to make it reach “10”, 209 individuals gave categorizable answers to this question. We categorized answers as (in order of decreasing response number): more treatment needed (sometimes specific treatments were proposed; 27% of responses); nothing (meaning nothing could be done to make the water totally comfortable [10 rating] to drink; 24%); more information needed (usually as to the status of the water; 23%), less information needed (meaning that the subject did not want to hear about the processing history of the water; 15%), and unsure (10%). The unwilling group (n=25), as might be expected, showed by far the highest incidence of “nothing could be done” (76% of all reasons offered by that group). The uncertain group (n=78) had “nothing” also as the highest incidence reason, but it was only for 31% of subjects. For the willing group (n=106), the most common reason was further treatment (35% of cases).
By the magical contagion principle of permanence, reluctance to drink recycled water should not be reduced much by either increasing the time or distance between completion of water processing and the opportunity to drink the water. Water treatment in the U.S. occurs in the factory-like settings of treatment plants. Water is then released into, or stored in, managed “natural” systems such as flow-regulated rivers, aquifers, or reservoirs. Time in storage and distance traveled are both potential decontaminants. Of course, it is the long time and distance between wastewater and tap water required by the hydrological cycle that functions, one way or another, to make tap water acceptable. In fact, however, in some cases treated wastewater introduced into natural storage or carriage systems is of a higher quality than the receiving waters.
Rather than serving as a physical purification, the reintroduction of treated wastewater into natural systems could potentially serve a “spiritually purifying” role of removing consumers’ historical association of the clean water with its origins as wastewater, in much the same way that contact with Mother Theresa can render one of Hitler’s jackets acceptable. Time and distance as described here do not necessarily improve water quality and might reduce it in real-world terms. However, the mixing of treated wastewater with “natural” water (even though the natural water itself was once wastewater), and the interaction with large natural bodies of fresh water might serve to negate the wastewater history by counteracting it with positively-valenced “naturalness” (Nemeroff & Rozin, 1994). Of course, it is also possible that this same interaction would contaminate the “natural” water.
Table 3: Change in comfort drinking water that had been in a reservoir or aquifer for one versus 10 years, by willingness to accept recycled water (N/Mean/(SD)).
Willing Uncertain Unwilling
The questions on time and distance were presented in sequence so subjects could directly compare effects of one versus one hundred miles, or time intervals of one versus ten years, in terms of their efficacy in rendering the water acceptable. Such within-subject comparisons should optimize the detection of small differences.
Overall, 39% of respondents showed an increased willingness to drink water after it had been in an aquifer for ten years versus one year, as opposed to 14% who found ten years less acceptable than one year. Comparable values for the reservoir are 25% and 17%, respectively. There is a significant increase in comfort for the aquifer with the nine years of extra time generating higher mean comfort (Mdiff = 0.59, SD = 2.11, t(397) = 5.581, p<.001). There is a comparable but smaller significant enhancement from 10 years in the reservoir (Mdiff = 0.30, SD = 2.08, t(396) = 2.819, p<.01).
Table 4: Effect of distance traveled down a swift river on acceptability of water by willingness to drink recycled water (hundred miles minus one mile: comfortable 0-10) (n/mean/(SD)).
Willing Uncertain Unwilling * p<.05, ** p<.01.
The means for willingness to drink recycled water are presented in Table 3. A direct comparison of these means is not warranted, because many of the 187 willing respondents already have a maximum 10 comfort score for drinking certified safe water before storage. Also, the increased value of nine extra years of storage cannot be easily gauged across the three willingness groups, since the groups start at different comfort levels. Nonetheless, examination of Table 3 suggests that time in aquifer is more effective than time in reservoir (Mdiff = .32, t(394) = 2.473, p<.05). Our subsequent analyses do not include subjects who were already at the maximum (10) acceptability level.
Overall, 39.7% of respondents showed an increased willingness to drink water after it had traveled for a hundred miles versus one mile. However, the mean advantage of the extra 99 miles for all respondents was slight; eliminating all respondents who were at the maximum comfort (10) at mile one, the mean difference is .40 units (SD = 2.30) on the 0-10 scale (t(369) = 3.353, p <.001). As shown in Table 4, there are not major differences across initial willingness groups, with about 30% in each group showing some increase in acceptability after 99 additional miles of travel down a swift river.
In terms of the taxonomy of contagion described by Nemeroff and Rozin (1994), the unwilling respondents and some of the uncertain respondents appear to treat the effect of water coming into contact with sewage as showing indelible, or “spiritual” contamination. This means that further processing or more details about processing may be an ineffective strategy for increasing acceptance. The fact that tap water is much more acceptable than water that is actually safer (boiled/evaporated/condensed) suggests that tap water acceptability is based in part on either ignorance of the purification process, or failure to think about it at the point of drinking it. The lower discomfort for tap water might also result from its familiarity, which could dampen concerns about risk (Slovic, Fischhoff & Lichtenstein, 1980).
The relation between willingness to sip a water sample and disgust sensitivity is subject to multiple interpretations. Most of the transformations of water that were described would have the same clear appearance, so there would be no visual cue (such as brownness) that might directly elicit disgust. But disgust sensitivity includes sensitivity to contamination, and that varies markedly across the different water exemplars.
A major limitation of Study 1 is that the best practical treatment for making water acceptable and safe for drinking, reverse osmosis (RO), was not clearly articulated as an option. Reverse osmosis involves forcing water through a membrane filter system which passes only molecules the size of water or smaller, essentially generating pure water. This technique has become the procedure of choice in most of the world, including the U.S., for generating potable water from wastewater or other highly-degraded source water. In the larger study, the item “…passed through tightly meshed filters to remove any microbes and unwanted chemicals” was originally intended as a description in lay terms of reverse osmosis. However it was overly vague and not clearly labeled as RO. This was corrected in Study 2. Carried out after Study 1, Study 2 focuses on the acceptability of (comfort with) “purified” water. The subjects were American college students. The survey was considerably longer than the prior survey, and allowed for the completion of a full disgust scale, a scale to measure obsessive-compulsive tendencies (which might relate to the contamination sensitivity that seems so central to water acceptance), and a new measure of contamination sensitivity devised for this study, which measures reactions to purification of water contaminated with different types of entities. We also looked at acceptability of tap water and consumption of bottled water as predictors of willingness to drink recycled water.
Subjects were 432 University of Pennsylvania undergraduates from an introductory psychology course (61.3% female). The question which introduced the section on water attitudes for this study, was:
For the following items, please use the scale below to indicate how uncomfortable you would feel taking a sip of the water described. The scale runs from 0= completely comfortable (e.g., the same as how you would feel about taking a sip of water from a previously sealed commercial bottle of spring water {e.g., Evian, Fuji, Poland Springs}) to 100 = as uncomfortable as any activity you have experienced.Your level of discomfort about taking a sip of water from a previously sealed commercial bottle of spring water (e.g., Evian, Fuji, Poland Springs): PLEASE ENTER A ZERO (0) FOR THIS ITEM FOR PURPOSES OF CALIBRATION.
Local tap water
Wastewater that is boiled and evaporated into water vapor, and then condensed.
Wastewater that is forced through a filter that has holes so small that nothing bigger than a water molecule can get through (this is called ultrafiltration or reverse osmosis).
(There is an inaccuracy in the last item. Ultrafiltration and reverse osmosis are in fact not equivalent; ultrafiltration is not as thorough in removing contaminants as reverse osmosis and used alone will not yield potable water. However, the procedure we describe is, in fact, reverse osmosis, and this is the core of the question. We doubt that more than a few if any of our subjects knew what either the term “reverse osmosis” or “ultrafiltration” meant.)
A set of similar items was included focusing on removal of different types of contamination from water, using the same scale. Previous work on magical contagion (e.g., Rozin et al., 1986; Nemeroff & Rozin, 1994; reviewed in Rozin & Nemeroff, 2002) exploring mental models of contagion and the “moral-germ conflation” compared (actually harmless) exposures to different types of contagious sources, representing danger, disgust, moral taint, and physical illness. The four contaminants included in Study 2, all added to bottled spring water, were: “a tiny (harmless) amount of sodium cyanide” (danger), “brief exposure to a heat sterilized cockroach: (disgust)”, “sipped by a convicted murderer” (moral taint), and “exposure to active HIV viruses” (physical illness). For three of the four contaminants, respondents rated their reaction to the contaminated water. Then, in the decontamination sequence, the contaminated water “is poured out, and the glass is thoroughly washed with soap and water, and then rinsed with more bottled water. The glass is then heat sterilized. Now more bottled water is poured in. [rate] Your discomfort at taking a sip of this water.”
For sodium cyanide, the description was as follows:
Imagine taking a sip of water poured into a clean new glass from another freshly opened bottle of the same water as above (e.g., Evian, Fuji, Poland Springs) after a tiny amount (.01 gram) of the poison sodium cyanide has been mixed in. This dose of sodium cyanide has no effect at all, and is no more than you would find in an apricot pit. Sodium cyanide is NOT a cumulative poison. At this dose it will have absolutely no effect.[rate] Your discomfort at taking a sip of this water
After the decontamination sequence described above, respondents again rated their discomfort at sipping the water.
For cockroach, the description was identical except that the cyanide description was replaced with “A heat sterilized dead cockroach is briefly dipped into the new glass of water.” For murderer, “A convicted murderer takes a sip from the new glass of water.”
For HIV/AIDS the situation was different, because a trace of virus is actually physically dangerous. “A drop containing active HIV (AIDS) viruses is dropped into a new glass of water. The water is then heat sterilized at 400 degrees Centigrade for one hour, which will kill any known organism many times over. The glass cools down to drinking temperature.” After a discomfort rating for this sterilized water, the same decontamination sequence as above was carried out, followed by another discomfort rating.
As a measure of contagion sensitivity, we averaged the discomfort scores after decontamination for each of the four contaminants. This is a measure of residual, roughly spiritual contamination across the four contaminants. The mean discomfort scores were 9.0 for cyanide, 26.9 for cockroach, 16.5 for murderer, and 47.2 for AIDS. The intercorrelations of the four contamination scores with one another varied between .28 and .55.
Subjects were also asked:
In a typical week, how much of bottled versus tap water do you drink?% bottled __
% tap __
Later in the questionnaire, subjects took the Disgust Scale (Haidt, McCauley & Rozin, 1994), as modified and shortened (from 32 to 27 items by Olatunji et al., 2007).
Finally, subjects completed the 18-item Obsessive-Compulsive Inventory (Foa et al., 2002).
Table 5: Comfort at sipping three different types of water (n=403 undergraduates).
All subjects (N=401–410 of 432) included in the analysis rated discomfort at drinking commercial bottled water at “0”, as instructed. There is a major reduction in discomfort (from the presumed 100 baseline) from either of the purification techniques (reverse osmosis, M=36.4; or evaporation/condensation, M =40.3). However, the level of discomfort from either is still much higher (p<.001) than the discomfort from tap water (M=19.4; see Table 5). Discomfort was significantly higher for the evaporated/condensed than the reverse osmosis water (t(393) = 4.329, p<.001). A small number of subjects (6%) showed maximal discomfort after either of the processes, while 13% were totally comfortable (0) after evaporation/ condensation and 17% after reverse osmosis. Although reverse osmosis was on average more effective than evaporation/condensation, for 16% of subjects, evaporation was more effective by more than 5 points.
What predicts the reduction in discomfort resulting from reverse osmosis purification? (Since reverse osmosis and evaporation/condensation reductions decontaminated scores correlate .77, we consider only the first purification technique.) The best predictors were, in decreasing order: the mean of the four contagion scores after washing/sterilization (r = .52, p<.001), discomfort with sipping tap water (r = .42, p <.001), the disgust scale score (r = .41, p<.001), percent of total water intake consumed as bottled water (r = .21, p<.001), and finally, obsessive-compulsive tendency score (r = .09, n.s.). A straight (unique variation accounted for) linear regression identified the contagion mean as the principal predictor (beta =.36, p<.001), with tap water discomfort as the next predictor (beta=.24, p<.001) and then disgust sensitivity (beta=.20, p<.001). Obsessive-compulsive tendencies and percent of water consumed as bottled water had no significant unique predictive value.
We report two very different studies, one with a short survey administered to a broad sample of Americans, and the other with a more intensive survey completed by American undergraduates. Both focus on individual differences in disgust and contagion, in relation to the acceptability of contaminated water, and specific responses to decontaminated wastewater. The studies have convergent conclusions: there is wide variation in the reported acceptability of recycled water; there is wide variation in disgust and contamination sensitivity; there is a substantial relation between disgust and/or contamination sensitivity and acceptability of processed and safe but recently contaminated water; there is a minority of individuals who will not accept previously contaminated water no matter what purifications it undergoes. This is particularly striking, because these same people readily consume tap or bottled spring water, which usually have the very same contamination history as the water that they reject as contaminated. We can describe these individuals as responding to what we call spiritual contamination. When we describe levels of processing (purification) which produce water that is purer than tap or bottled water, subjects still rate this water as less acceptable than tap water.
In addition, each study has study-specific implications. The first, large study reveals that those uncertain about drinking recycled water show some positive effects of increasing amounts of processing: these effects are much larger than the virtually zero effects shown by those unwilling to drink recycled water, but are notably less than those willing to drink it. In addition, with respect to the magical contagion principle of dose insensitivity, allowing considerable time to pass after recycling (10 years) with water stored in a reservoir or aquifer, or having the recycled water travel a long distance (100 miles) in a swift river produces only a small (but significant) increase in acceptability (comfort).
The undergraduate results indicate that obsessive-compulsive tendencies are not substantially related to water rejection. This may be because the standard OCD scale focusses on the degree to which individuals are bothered by their obsessions, rather than directly on sensitivity. Reverse osmosis, the currently preferred technique to produce potable water, is somewhat more effective than boiling/evaporation/condensation for producing acceptable water.
It is clear that some opponents of recycled water are essentially opposed to it in principle—it is like a moral stance. This is reminiscent of a minority of supporters of naturalness, for whom natural preference is ideational, and not subject to counter-evidence (Rozin et al., 2004). Similarly, there is a theme of moral opposition to genetically modified organisms which is evidence-insensitive (Scholderer & Frewer, 2003; Frewer et al., 2013; Scott, Inbar & Rozin, 2015). “Natural” has some of the properties of a protected or sacred value (Baron & Spranca, 1997; Tetlock, 2003). One of these is evidence insensitivity. This type of opposition is very difficult to influence.
Our results indicate that intuitive contagion-based thinking is involved in public reactions to recycled water. Our findings are consistent with those of Callaghan et al.’s (2012) qualitative study, which identified the theme of purity/impurity as a component of their Australian subjects’ responses to water recycling. These authors noted that while subjects were aware of the need to use recycled water, they nevertheless exhibited a fear of contamination from it.
Understanding the intuitive psychology of contagion allows us to identify circumstances and ways in which intuitive, heuristic-based thinking can clash with expert/scientific models, leading to suboptimal choices and behaviors. The findings we report generate suggestions about ways to bring public responses into better alignment with real-world contingencies, by identifying the magical law of contagion as a cognitive heuristic, which functions, among other things, to limit damage due to infectious agents. Such cognitive shortcuts are not perfect, however, and in the case of recycled water, the impact may be counter to the public interest.
Just as contact with Mother Theresa can cancel out the Hitlerness in a jacket (Nemeroff & Rozin, 1994), the addition of the right positive elements (additional processes described as “natural”, images of “ultra-purity”) may undo contamination for those people whose thinking follows a spiritual model.
In connection with this, it is interesting to note that a study by U.S. water-reuse experts comments on the importance of “environmental buffers” (lakes, rivers, aquifers) to water supply: “Environmental buffers can play an important role in improving water quality and ensuring public acceptance of potable water reuse projects… but the historical distinction between direct and indirect water reuse is not meaningful to the assessment of the quality of water delivered to consumers.” (NRC, 2012, p. 54).
“Indirect” water reuse means the water is released to a natural system before being recaptured for subsequent use. “Direct” means the water has bypassed natural systems and is being directly reintroduced into flows intended for human uses. This finding, written in bold face in the study, suggests that either there is no benefit from the reintroduction of water to a natural system, or that technologies used to treat wastewater prior to personal uses are so effective and reliable that natural systems are no longer needed. In fact, reintroducing water into the natural system actually adds impurities back into the recycled water. However, the authors point out a “public acceptance” benefit from introducing treated wastewater into natural systems before its next use.
Other approaches focus more on the ecological, health and economic advantages of recycled water. For example, one could create a context where recycled water is so commonly and widely discussed as to become familiar rather than novel. The simple shift from novelty to everyday familiarity can decrease perceived threat (Slovic et al., 1980). The more recycled water becomes a norm, the less problematic it will be (e.g., Zajonc, 2001). The marketing of recycled water (NeWater), by Singapore, is an example.
Yet another approach invokes framing: developing water treatment and delivery methods, and ways of communicating about the water, that frame the water’s history as sewage out of awareness. This naturally occurs when water comes out of a tap, or better yet, a discrete unit such as a bottle. As noted earlier, recent research on acceptance of recycled water focuses on whether the words used to describe the water matter to acceptance (Menegaki et al., 2009), whether knowledge of treatment processes matter (Dolnicar et al., 2010), and what impact the level of trust in the purveyor of the water has (Doria, 2010). Many of these findings (though not all) can be understood in terms of framing the water’s history as sewage out of focal awareness. A framing approach risks failing when and if opponents act to bring the framed-out material back into focus (e.g.,“toilet to tap” campaigns). However if the frame activates cognitive structures related to perceptions of safety (e.g., plastic wrapping around meat in a grocery store) they may withstand such efforts.
Borrowing from the phobia treatment technique of systematic desensitization, one could introduce recycled water in very low concentrations into the water system, and gradually increase the levels. Our data for the unwilling subjects in the present study suggest that this technique will have a limited effect with them, but it may have been effective in Singapore. Borrowing again from phobia and related treatments, the opposite of systematic desensitization is flooding. For the case of recycled water, this consists of convincing people that all water is contaminated, and all essentially “toilet to tap.” This could potentially lead to some personal crises, but the desire to survive would presumably dominate.
Arguably, from a public health perspective, the simplest solution to the acceptability problem of otherwise safe, potable water is to gradually increase the amount of potable, recycled water in the water supply without telling anyone, because in general people tend to underestimate the extent to which they will adapt to things. By the time this is discovered, people would presumably realize that it has been OK to drink this water. Obviously, though, this would engender the nontrivial problem of loss of trust, and raise substantial ethical issues. As we note in the introduction, in a truly democratic society a highly engaged and affluent, but rather small minority can often impede progress that would increase the public good. It is for this reason that we must attend to the thinking of the minority who are strongly opposed to water recycling. Telling them just that they will get used to it, as people got used to water fluoridation, will not be convincing, although it is true.
Alternatively, one could wait until local water shortages are so severe that inconvenience and cost drive people to accept what they previously found unacceptable. We have survey data that suggests that, although people acknowledge magical contagion beliefs, they may abandon them when there is an economic cost to having these beliefs drive their behavior (Rozin et al., 2007). Economic forces can operate directly as incentives, or they can highlight for people their own irrationality. Singapore has dealt most effectively with the introduction of recycled water. Litigious minorities are ineffective there. The government has established a clean and effective recycled water facility, and conducts tours of it regularly. Recycled bottled water (NeWater) is provided free at any event that requests it. The recycled water is not introduced directly into drinking water, but is rather randomly introduced into holding tanks and reservoirs. A great deal of government-sponsored persuasive information is presented to the public. Singapore does not want to be dependent on other countries for water, and this provides a political/economic motivation.
There is an alternative for a committed small minority. Individuals who are very strongly opposed to consuming recycled water can buy bottled spring water, and avoid the problem of direct consumption. There are historical examples of people avoiding public water supplies, as with the case of fluoridation.
Resistance to recycled water is largely psychological. There are many examples where people’s feelings or intuitions run counter to their own rationally considered self-interest (Slovic, Finucane, Peters, & MacGregor, 2004; reviewed in Baron, 2008; Kahneman, 2011), and sometimes the public interest. Strategies for dealing with this mismatch need further attention.
Associated Press. (2012). “Penn State plans to renovate areas where Jerry Sandusky abused boys.” Available at: http://www.pennlive.com/midstate/index.ssf/2012/07/penn_state_to_renovate_areas_w.html, downloaded Januray 27, 2015.
Baron, J. (2008). Thinking and deciding (4th edition). Cambridge: Cambridge University Press.
Baron, J., & Spranca, M. (1997). Protected values. Organizational Behavior and Human Decision Processes, 70, 1–16.
Callaghan, P., Moloney, G., & Blair, D. (2012). Contagion in the representational field of water recycling: Informing new environment practice through social representation theory. Journal of Community and Applied Social Psychologh, 22, 20–37
Dolnicar, S., Hurlimann, A., & Nghiem, L. (2010). The effect of information on public acceptance—The case of water from alternative sources. Journal of Environmental Management, 91(6), 1288–1293.
Doria, M. 2010. Factors influencing public perception of drinking water quality. Water Policy, 12(1), 1–19.
Fallon, A. E., Rozin, P., & Pliner, P. (1984). The child’s conception of food: The development of food rejections with special reference to disgust and contamination sensitivity. Child Development, 55, 566–575.
Foa, E. B., Huppert, J. D., Leiberg, S., Langner, R., Kichic, R., Hajcak, G., & Salkovskis, P. M. (2002). The Obsessive-Compulsive Inventory: Development and validation of a short version. Psychological Assessment, 14(4), 485–496.
Frazer, J. G. (1959). The new golden bough: A study in magic and religion (abridged). New York: Macmillan (Edited by T. H. Caster, 1922; Original work published 1890).
Frewer, L. J., van der Lans, I. A., Fischer, A. R. H., Reinders, M. J., Menozzi, D., Zhang, X., van den Berg. I., & Zimmermann, K. L. (2013). Public perceptions of agri-food applications of genetic modification: A systematic review and meta-analysis. Trends in Food Science & Technology, 30, 142–152.
Haddad, B., Rozin, P., Nemeroff, C., & Slovic P. (2010). The psychology of water reclamation and reuse: Survey findings and research roadmap: Final project report. Arlington, VA: WateReuse Foundation.
Haidt, J., McCauley, C. R., & Rozin, P. (1994). Individual differences in sensitivity to disgust: A scale sampling seven domains of disgust elicitors. Personality and Individual Differences, 16, 701–713.
Hejmadi, A., Rozin, P., & Siegal, M. (2004). Once in Contact, Always in Contact: Contagious Essence and Conceptions of Purification in American and Hindu Indian Children. Developmental Psychology, 40, 467–476.
Kahneman, D. (2011). Thinking fast and slow. New York: Farrar, Straus and Giroux.
Kraus, N., Torbjorn, M., & Slovic, P. (2002). Intuitive toxicology: Expert and lay judgments of chemical risks. Risk Analysis, 12, 215–232.
Mauss, M. (1972). A general theory of magic. (Robert Brain, Trans.) New York: W. W. Norton. (Original work published 1902).
Menegaki, A., Mellon, R., Vrentzou, A., Koumakis, G., Tsagarakis, K. 2009. What’s in a name: Framing treated wastewater as recycled water increases willingness to use and willingness to pay. Journal of Economic Psychology 30(3), 285–292.
National Research Council (2012). Water Reuse: Potential for expanding the nation’s water supply through reuse of municipal wastewater. Washington, D.C.: National Academies Press.
Nemeroff, C., & Rozin, P. (1994). The contagion concept in adult thinking in the United States: Transmission of germs and interpersonal influence. Ethos, 22, 158–186.
Nemeroff, C., & Rozin, P. (2000). The makings of the magical mind. In K. S. Rosengren, C. N. Johnson, & P. L. Harris (eds.). Imagining the impossible: Magical, scientific, and religious thinking in children (pp. 1–34). New York: Cambridge University Press.
Nisbett, R. E., & Ross, L. (1980). Human inference: Strategies and shortcomings of social judgment. Englewood Cliffs, NJ: Prentice-Hall.
Olatunji, B., Williams, N. L., Tolin, D. F., Abramowitz, J. S., Sawchuk, C. N., Lohr, J. M., & Elwood, L. S. (2007). The Disgust Scale: Item analysis, factor structure, and suggestions for refinement. Psychological Assessment, 19, 281–297.
Park, J. H., Faulkner, J. & Schaller, M. (2003). Evolved disease-avoidance processes and contemporary anti-social behavior: Prejudicial attitudes and avoidance of people with physical disabilities. Journal of Nonverbal Behavior, 27, 64–87.
Po, M., Kaercher, J. D., & Nancarrow, B. E. (2003). Literature review of factors influencing public perceptions of water use. CSIRO Land and water technical report 54/03, December 2003. Available at: http://www.clw.csiro,au/publications/technical2003/tr54-03.pdf.
Rozin, P., & Fallon, A. E. (1987). A perspective on disgust. Psychological Review, 94, 23–41.
Rozin, P., Fallon, A. E., & Augustoni-Ziskind, M. (1985). The child’s conception of food: The development of contamination sensitivity to “disgusting” substances. Developmental Psychology, 21, 1075–1079.
Rozin, P., Grant, H., Weinberg, S., & Parker, S. (2007). “Head versus heart”: Effect of monetary frames on expression of sympathetic magical concerns. Judgment and Decision Making, 2, 217–224.
Rozin, P., Haidt, J., & McCauley, C. R. (2008). Disgust. In M. Lewis & J. Haviland (eds.). Handbook of emotions, third edition. New York: Guilford.
Rozin, P., Millman, L., & Nemeroff, C. (1986). Operation of the laws of sympathetic magic in disgust and other domains. Journal of Personality and Social Psychology, 50, 703–712.
Rozin, P., Nemeroff, C., Wane, M., & Sherrod, A. (1989). Operation of the sympathetic magical law of contagion in interpersonal attitudes among Americans. Bulletin of the Psychonomic Society, 27, 367–370.
Rozin, P., & Nemeroff, C. (2002). Sympathetic magical thinking: the contagion and similarity “heuristics”. In T. Gilovich, D. Griffin & D. Kahneman (Eds.). Heuristics and biases. The psychology of intuitive judgment (pp. 201–216). Cambridge: Cambridge University Press.
Rozin, P., Spranca, M., Krieger, Z., Neuhaus, R., Surillo, D., Swerdlin, A., & Wood, K. (2004). Natural preference: instrumental and ideational/moral motivations, and the contrast between foods and medicines. Appetite, 43, 147–154.
Russell, S., & Lux, C. (2006). Water recycling and the community: Public responses and consultation strategies: A literature review and discussion. Oz-AQUAREC WP5. University of Wollongong, NSW, Australia.
Schaller, M., & Park, J. H. (2011). The behavioral immune system (and why it matters). Current Directions in Psychological Science, 20(2), 99–103.
Scholderer, J., & Frewer, L. J. (2003). The biotechnology communication paradox: experimental evidence and the need for a new strategy. Journal of Consumer Policy, 26(2), 125–157.
Scott, S. E., Inbar, Y., & Rozin, P. (2015). Attitudes towards genetically modified food: Disgust-based moralization in action (submitted manuscript).
Siegal, M. (1988). Children’s knowledge of contagion and contamination as causes of illness. Child Development, 59, 1353–1359.
Slovic, P., Finucane, M. L., Peters, E., & MacGregor, D. G. (2004). Risk as analysis and risk as feelings: Some thoughts about affect, reason, risk, and rationality. Risk Analysis, 24, 311–322.
Slovic, P., Fischhoff, B. and Lichtenstein, S. (1980). Facts and fears: Understanding perceived risk. In R. C. Schwing & W. A. Albers, Jr. (Eds.), Societal risk assessment: How safe is safe enough? New York: Plenum Press.
Tetlock, P. E. (2003) Thinking the unthinkable: Sacred values and taboo cognition. Trends in Cognitive Science, 7(7), 320–324.
Tylor, E. B. (1974) Primitive culture: Researches into the development of mythology, philosophy, religion, art and custom. New York: Gordon Press (Original work published 1871).
Zajonc, R.B. (2001). Mere exposure: A gateway to the subliminal. Current Directions in Psychological Science, 10, 224–228.
Please indicate how much you agree with each of the following
statements, or how true it is about you. Please write a number (1, 2,
3 or 4) to indicate your answer:
1 = Strongly disagree (very untrue about me)
2 = Mildly disagree (somewhat untrue about me)
3 = Mildly agree (somewhat true about me)
4 = Strongly agree (very true about me)
I try to avoid letting any part of my body touch the toilet seat in a public restroom, even when it appears clean.
It would make me uncomfortable to hear a couple making love in the next room of a hotel.
It would bother me tremendously to touch a dead body.
Even if I was hungry, I would not drink a bowl of my favorite soup if it had been stirred by a used but thoroughly washed fly-swatter.
How disgusting would you find each of the following experiences? Please write a number (1, 2, 3, or 4) to indicate your answer:
1 = Not disgusting at all, 2 = Slightly disgusting, 3 = Moderately disgusting, 4 = Very disgusting
(If you think something is bad or unpleasant, but not disgusting, you should write "1".)
You take a sip of soda and then realize that you picked up the wrong can, which a stranger had been drinking out of.
You hear about a 30 year old man who seeks sexual relationships with 80 year old women.
While you are walking through a tunnel under a railroad track, you smell urine.
You accidentally touch the ashes of a person who has been cremated.
Copyright: © 2015. The authors license this article under the terms of the Creative Commons Attribution 3.0 License.
This document was translated from LATEX by HEVEA.