| Figure 1: Coin-flipping simulation program interface. |
Judgment and Decision Making, Vol. 9, No. 6, November 2014, pp. 586-592
The effect of dynamic proximity cues on counterfactual plausibilityJudith Covey* Qiyuan Zhang# |
Previous research has found that people consult closeness or proximity cues when they evaluate the plausibility or likelihood of a counterfactual alternative to reality. In this paper we asked whether the plausibility of counterfactuals extends to dynamic proximity cues that signal a sense of propensity or acceleration in the lead-up to an outcome. Subjects gambled on obtaining either three heads or three tails from three coin-flips. When they lost the gamble they thought it was more likely that they could have won if they had lost on the third coin-flip that was revealed rather than the first or second coin-flip. We discuss how the sense of propensity was raised prior to the revelation of the final decisive losing coin-flip which created a perception of psychological momentum towards winning. Moreover, the consequence of this propensity effect was to positively bias perceptions of the likelihood of the counterfactual winning outcome.
Keywords: counterfactual potency, near-miss, close counterfactuals,
proximity heuristic, temporal-order effect, propensity effect.
People often reflect upon how things might have turned out differently particularly when they have just missed out on a desired counterfactual outcome (Byrne, 2007; Kahneman & Tversky, 1982; Roese, 1997). Moreover, the closeness or proximity of the near-miss has been shown to amplify emotions such as feeling unlucky, disappointed or distressed (Kahneman & Tversky, 1982; McMullen & Markman, 2002; Meyers-Levy & Maheswaran, 1992; Zhang & Covey, 2014). Close counterfactuals are potent because it is easy to imagine how things could have turned out differently and when the comparison to reality is salient an affective contrast effect is produced (Kahneman & Tversky, 1982; Kühberger, Groβ bichler, & Wimmer, 2011; Markman & McMullen, 2003; Petrocelli, Sherman, & Tormala, 2011; Teigen, 1998, 2005). For instance, a recent experiment conducted by Zhang and Covey (2014) found that the loser of a basketball-throwing competition beaten by 1 point rather than 15 points was judged as more likely to have won the game and they also felt worse about the outcome.
Counterfactual closeness is usually conceptualised in terms of the static or end-point proximity between the actual outcome and the desired counterfactual alternative—i.e., how many points a game has been lost by (McMullen & Markman, 2002; Zhang & Covey, 2014), how many minutes a plane has been missed by (Kahneman & Tversky, 1982), or how long ago an insurance policy lapsed (Meyers-Levy & Maheswaran, 1992). We propose that counterfactual closeness can also be affected by the dynamic proximity profile that precedes the end-point outcome. For example, members of the losing team of a basketball game may feel closer to winning if their dynamic proximity profile showed a reducing deficit towards the end of the game rather than an unchanging deficit throughout the game. The former type of profile signals progression or acceleration, which creates a sense of propensity or psychological momentum towards the focal outcome (Kahneman & Varey, 1990; Markman & Guenther 2007).
The focal outcome seems so strongly inevitable that it can reverse the hindsight bias: Roese, Fessel, Summerville, Kruger and Dilich (2006) found that, when the perception of trajectory towards an outcome is made highly salient through the use of dynamic stimuli (i.e., computer animations of traffic accidents) likelihood estimates of a serious accident were higher when subjects were not made aware that this was the actual outcome. The sense of propensity created a feeling of knowing that the car is about to have an accident, which inflated the perceived likelihood of that outcome. However, it remains untested whether or not this feeling of knowing will also carry over to situations where that focal outcome does not occur. The propensity effect might also intensify feelings that things could have turned out differently, and this prediction was tested in the current paper.
In our first test of this prediction, we presented subjects with two different stories about a horse race. In both versions of the story a racehorse stumbled right before the finishing line and lost the race by a tight margin. In one version, the horse had been consistently following behind the leader before it stumbled, whereas in the other version the horse fell behind in the early stage of the race but had been catching up with the leader when it stumbled. We found that subjects who read the second version thought it was more likely that the horse could have won the race, despite the fact that horse lost the race by the same distance in both versions. The fact that the horse was catching up with the leader therefore created a stronger sense of propensity and winning was a more plausible counterfactual1.
Of course, the propensity effect might not be restricted to circumstances where the dynamic proximity profile is represented by physical distance cues. Distance can also be conceptualised in terms of the number of antecedent outcomes that need to be satisfied to reach a focal outcome. For instance, if someone needs to draw five cards of the same suit from a deck, they are closer to winning if they have drawn four cards of the same suit than if they have drawn three cards. However, even if four cards of the same suit are drawn the sense of propensity towards winning might also depend upon the temporal order of the card draw.
According to Kahneman and Varey (1990), decisive events that occur late in a causal sequence disrupt the sense of propensity that has been built up. They are also more likely to be mutated in counterfactual thinking and given stronger causal significance (Byrne, Segura, Culhane, Tasso, & Berrocal, 2000; Miller & Gunasegaram, 1990; Spellman, 1997; Walsh & Byrne 2004). Hence, the perceived plausibility of the counterfactual “I could have drawn five hearts” will be higher if four hearts were drawn first, followed by a spade rather than one spade drawn first followed by four hearts. In the former case the cards are revealed in an order that builds up a sense of propensity that “I am winning” while in the latter case this sense of propensity is disrupted by a heart being drawn second.
The aim of this experiment was to test this temporal order effect using a task where subjects gambled real money in a computerised coin-flipping game. In each trial, subjects flipped three coins shown on screen from left to right (hereafter labelled coin 1—coin 2—coin 3) and would win if the three coins stopped at the same value (i.e., H-H-H or T-T-T) but would lose for any other combination. In a between-subjects design the outcomes of all three coin-flips were either revealed simultaneously (Simultaneous condition) or sequentially from left to right (Sequential condition).
The possible outcomes of the coin-flipping task fall into four types: Win (H-H-H, T-T-T), Lose on coin 1 (H-T-T, T-H-H), Lose on coin 2 (H-T-H, T-H-T), and Lose on coin 3 (H-H-T, T-T-H). Hence, if subjects lost, they were always one coin away from winning and the end-point proximity to winning was equal. We predicted, however, that the different types of losing trials would lead to different perceptions of propensity towards winning. But this effect should only occur when the outcomes were revealed sequentially.
In both the Simultaneous and Sequential conditions the chance of winning was always 25% before any coin-flips are revealed. In the Simultaneous condition this chance either rises to 100% (Win trials) or drops to 0% (all types of Lose trials) after all three coin-flips are revealed. There is therefore no variation in the sense of propensity towards winning between the three different types of losing trials, and we would therefore expect that the “I could have won” counterfactual will be equally potent.
However, in the Sequential condition we did expect differences in counterfactual potency between the different types of losing trials. After the outcome of coin 1 is revealed, the chance of winning remains at 25% no matter whether it is a head or tail. However, in the Lose on coin 3 trials (H-H-T, T-T-H), the value of coin 2 matches that of coin 1 raising the chance of winning to 50%. This chance then drops to 0% when coin 3 fails to match the first two. In contrast, in the Lose on coin 1 (T-H-H, H-T-T) or Lose on coin 2 (H-T-H, T-H-T) trials, the sense of propensity is disrupted when the value of coin 2 fails to match coin 1, causing the chance of winning to drop from 25% to 0%. It was therefore predicted that the sense of propensity would be strongest for Lose on coin 3 trials which we expected to produce higher counterfactual probability estimates than either Lose on coin 1 or Lose on coin 2 trials.
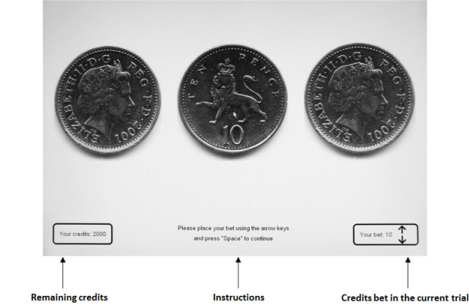
Figure 1: Coin-flipping simulation program interface.
Because subjects in this experiment were playing the game with real money we examined not only their emotional responses to the loss but also how the near miss affected their perceptions of being lucky or unlucky and their subsequent betting strategies. As discussed previously, outcome closeness has been found to be a determinant of counterfactually driven negative emotions like disappointment through an affective contrast mechanism (Markman & McMullen, 2003; McMullen & Markman, 2002). Close counterfactuals have also been found to affect perceptions of luck and subsequent risk-taking (Teigen, 1996; Wohl & Enzle, 2003; Wu, van Dijk, & Clark, 2014). Wohl and Enzle (2003) for example found that subjects who experienced a near big win on a roulette game perceived themselves to be less lucky than subjects who experienced a near big loss. They also bet less on the next game. We therefore expected that when subjects have lost on trials which have increased counterfactual potency (i.e., Lose on coin 3 trials in the Sequential condition), the starker contrast between the reality (“I lost this trial”) and what might have been (“I could have won this trial”) would heighten feelings of disappointment and being unlucky and reduce the amount bet on the next trial.
Eighty two first year psychology undergraduates from Durham University were recruited (14 males and 68 females) and were given £2 to gamble in a computer-simulated coin-flipping game and kept whatever was left at the end of the experiment. Subjects also received either course credits or an additional £2 for taking part.
Subjects were told that the purpose of the study was to investigate people’s gambling behaviours. Having given written consent to taking part in the experiment, they were each led into a two-square-metre isolated cubical and seated before a computer.
After the programme was launched, subjects were instructed to press the “space” key to start four practice trials before proceeding to the 80 experimental trials (with a break provided after 40 trials). In each trial, subjects completed four actions in succession: Bet—Flip—Lock—Answer. All instructions were provided on screen.
Bet. As shown in Figure 1, subjects started with 2000 credits (equivalent to £2) and used the “up” or “down” keys to adjust the amount of credits they wished to bet starting from a default amount of 1 credit for the first trial. On subsequent trials the starting amount was the number of credits placed on the previous trial. The amount bet was displayed in a box on the bottom-right of the screen and the frame of the box changed from black to red to remind subjects to adjust their bets at the beginning of each trial with the total remaining credits displayed in the bottom-left corner. The minimum bet was 1 credit and the maximum was 25. This limit ensured that subjects would not be in deficit after 80 trials even if they lost every trial.
Flip and Lock. After placing their bets, subjects were instructed to press the “space” key to start flipping the three coins shown from left to right. The pre-flipping value assigned to each coin was randomized for each trial. In the Revelation: Sequential condition, subjects pressed the “space” key once to start the three coins flipping (at 45msec per flip) at the same time. Then they pressed the “space” key three times in sequence to stop the coins flipping one by one from left to right. In comparison, in the Revelation: Simultaneous condition, subjects pressed the “space” key three times in sequence to make the three coins start flipping (at 45msec per flip) one by one from left to right. Then they pressed the “space” key a fourth time to stop all three coins flipping at the same time. In both conditions, the minimum interval between the presses of the “space” key was one second to prevent subjects from pressing the key too quickly. The outcome each coin flip was NOT pre-programmed and was determined by the moment at which subjects pressed the “space” key. In both conditions, if all three coins showed the same value (H-H-H or T-T-T), the words “Congratulations, you won” would appear on screen and subjects won three times the amount bet on that trial. Otherwise, the words “Sorry, you didn’t win this time” would appear on screen and they lost the full amount of their bet.
Answer. At the end of each trial, subjects were instructed to press the “space” key to bring up two questions determined by the outcome of the trial. On winning trials they were asked two filler questions (“To what extent do you agree with the following statement: I could have lost this trial” (1 = Strongly disagree, 9 = Strongly agree); “How pleased are you regarding the result of this trial” (1 = Not at all, 9 = Extremely). On losing trials the first question asked was drawn in sequence from a pool of four questions: counterfactual probability estimate (“I could have won this trial?” 1 = Strongly disagree; 9 = Strongly agree); disappointment rating (“How disappointed are you regarding the result of this trial?” 1 = Not at all; 9 = Extremely); luck rating (“How lucky or unlucky do you think you were in this trial” 1 = Extremely unlucky, 9 = Extremely lucky); and a memory test (“How many heads/ tails have you got in this trial” ‘0 heads’-‘3 heads’—scored as 0=incorrect, 1=correct). Since a correct answer to this memory question required attention to all three coin-flips, we expected that in the Sequential condition memory scores would be highest in the Lose on coin 3 trials. This is because, in the Lose on coin 1 or Lose on coin 2 trials, the game has been lost on the second coin-flip and there is no need for the subject to pay attention to the third coin-flip. No differences in memory test scores were expected in the Simultaneous condition, because the outcome of all three coin-flips is processed holistically.
The second question was a filler question in which subjects rated their agreement or disagreement with one of six statements: “I should change the current strategy for pressing buttons”; “I should stick to the current strategy for pressing buttons”; “I’ve been very lucky so far”; “I’ve been very unlucky so far”; “I’ve seen more heads than tails so far”; “I’ve seen more tails than heads so far”.
At the end of the 80 trials subjects exchanged their credit balance for real money. Then they were given a written debrief and thanked for their contribution.
Table 1: Means (SDs) for each target question as a function of the Type of trial (Lose on coin 1/2 vs. Lose on coin 3) and Revelation (Sequential vs. Simultaneous) condition.
MEMORY TEST (0=incorrect, 1=correct) † p < .10, * p < .05, ** p <.01.
The means and standard deviations (SDs) of the scores for each target question2 and results of the Type of losing trial (Lose on coin 1/23 vs. Lose on coin 3) x Revelation (Simultaneous vs. Sequential) analyses of variance (ANOVAs) are shown in Table 1. Simple main effect sizes are also reported to illustrate the effects of the Type of losing trial within each revelation condition. We expected that the Type of losing trial would affect the scores only when the outcomes of the coin-flipping were revealed sequentially rather than simultaneously. Lose on coin 3 trials were expected to increase memory test scores, counterfactual probability estimates, and disappointment ratings and reduce luck ratings—but only in the Sequential condition.
Table 2: Mean (SD) change in amounts bet after each type of trial.
(Lose on coin 1/2 vs. Lose on coin 3)
(Win vs. Lose 1/2/3)* p < .05.
The means and simple main effect sizes shown in Table 1 support these expectations for all scores apart from the luck ratings. Whereas the simple main effect sizes for the counterfactual probability estimates, memory test scores and disappointment ratings were significant in the Sequential condition (ηp2 ≥ .116, p ≤ .027), they were not significant in the Simultaneous condition (ηp2 ≤ .054, p ≥ .139). Although this pattern of results provides support for our suggestion that the method used to reveal the outcomes of the coin-flips contributed towards creating a sense of propensity to win, it should be noted that the Type of trial x Revelation interaction was significant only for the counterfactual probability estimates (F(1,80) = 11.3, ηp2 = .124, p = .001). The interaction did not reach significance for the disappointment ratings (F(1, 40) = 1.47, ηp2 = .018, p = .229), or the memory test scores (F(1,80) = 3.74, ηp2 = .045, p = .057). The observed differences in the significance of the simple main effects between the revelation conditions for these two measures must therefore be interpreted with caution.
There was no evidence from the findings shown in Table 2 that the stronger near-miss signal evoked by the Lose on coin 3 trials in the Sequential condition led to a greater reduction in the amounts bet on the next trial. The Revelation x Type of trial (Lose on 1/2 vs. Lose on 3) interaction was not significant and simple main effects tests confirmed that there was no significant difference between the Lose on coin 3 and Lose on coin 1/2 conditions in either the Sequential or Simultaneous conditions.
There were however some notable differences between the Sequential and Simultaneous conditions in how bets were changed following winning or losing trials confirmed by a significant Revelation x Type of trial (Win vs. Lose 1/2/3) interaction. More specifically, subjects in the Sequential condition raised their bets after winning trials and reduced them after losing trials, whereas subjects in the Simultaneous condition reduced their bets after winning trials and increased them after losing trials.
This asymmetry in subjects’ betting strategy could reflect the possibility that the Sequential condition evoked more of an illusion of control over the outcome of the trial. Subjects were more actively involved in the game—they chose exactly when each coin stopped flipping by pressing the “space” bar three times in succession. Hence, a “hot hand” illusion of being a winner may have been evoked after a winning trial (resulting in an increase in the amount bet on the next trial) whereas a “cold hand” illusion of being a loser may have been evoked after a losing trial (resulting in an decrease in the amount bet on the next trial) (Gilovich, Vallone, & Tversky, 1985). This explanation is consistent with Langer’s (1975) theory, which identified active/passive involvement as one of the dimensions that determines the extent to which an event is perceived as controllable. The Simultaneous condition may not however have evoked the same illusion of control over the outcomes of the trials because, although subjects chose when each coin started flipping by pressing the “space” bar three times in succession, they had to press the “space” bar only once to stop them flipping. Their betting strategy in this condition was therefore more consistent with the belief that the game was a game of chance rather than a game of skill—and the fact that they reduced their bet after a win but increased it after a loss suggests that they may have been susceptible to another type of cognitive bias—the gambler’s fallacy, where a win is perceived as less likely to follow a winning trial than a losing trial (Sundali & Croson, 2006).
Research has shown that counterfactuals are stronger and emotional reactions intensified when an outcome is proximate to its counterfactual alternative. The present paper extended this notion of static or end-point proximity by testing the effects of dynamic proximity cues at creating a sense of propensity towards outcomes that are not realised. Our first demonstration created a sense of propensity using dynamic cues which signalled acceleration or progression. A racehorse rapidly catching up with the leader of the race was seen as a more likely winner. We built upon that result in the coin-flipping experiment by showing that a sense of propensity was not restricted to dynamically changing distance cues. Propensity towards winning a coin-flipping game was induced by varying the order in which the decisive coin-flip was revealed. The counterfactual (“I could have won”) was rated more likely when the decisive coin-flip was revealed late in the sequence (e.g., losing on the third coin), compared to when it was revealed early (e.g., losing on the first or second coin).
It is worth noting of course that subjects have no rational basis for their counterfactual probability estimates to be higher when the losing coin is revealed third in the sequence rather than first or second. If a subject sees two heads and a tail, the counterfactual “I could have won” should be equally likely regardless of the order in which the outcomes of the three coins are revealed. We have therefore identified a new way in which the sense of propensity can bias probability judgments. The propensity effect can bias not only prospective judgments of factual outcomes (as demonstrated by Roese et al., 2006) but also retrospective judgments of counterfactual outcomes.
This bias could of course have real-life implications, given the way that casino slot-machines can be designed. As discovered by Strickland and Grote (1967) a slot machine which reveals the outcomes of the three wheels sequentially from left to right usually has the highest proportion of winning symbols on the first wheel, a lower proportion on the second wheel, and the lowest proportion on the third wheel. This particular design therefore has the potential to create a sense of propensity towards winning which may help explain why, as suggested by Strickland and Grote (1967), it can lead to more persistent gambling.
As well as identifying the ways in which people’s probability judgments can be misled, future research might also examine the relative and combined influence of different types of static and dynamic proximity cues on counterfactual plausibility. For example, we might ask ourselves how the proximity effects created by static end-point distance cues (e.g., the distance between the losing horse and the winner or the total number of heads and tails flipped) combine with or compete against the sense of propensity or psychological momentum produced by dynamic proximity cues (e.g., the acceleration or velocity of the horse in catching up with the leader or the sequence of heads and tails flipped). There is every reason to expect an interplay between static and dynamic proximity cues in creating a sense of counterfactual closeness in the same way that outcome satisfaction has been shown to depend upon both the actual outcome position and the velocity of the outcome changes (Hsee & Abelson, 1991; Hsee, Salovey, & Abelson, 1994). Research by Hsee and his colleagues has shown that people’s satisfaction with stock performance was determined not only by the how much the stock’s value had changed (i.e., displacement) but also by how quickly the value changed over time (i.e., rate of change).
In summing up, the present research represents a step forward in refining our notion of close counterfactuals beyond static measures of distance or proximity. As discussed by Kühberger et al. (2011, p.154) closeness effects rely upon people interpreting the situation as “coming as close as possible”. This requires the margin of miss to be evaluated relative to a perceptually salient and cognitively accessible reference value. They used the notion of a categorical boundary as a reference value and discussed the ways in which vignette content and study design might heighten the feeling of nearly making it. The present findings advance this theorising by delineating the contribution that dynamic proximity cues make in signaling progression towards the categorical boundary and thereby increasing the sense that the counterfactual almost happened.
Byrne, R. M. J. (2007). Precis of the rational imagination: How people create alternatives to reality. Behavioral and Brain Sciences, 30(5–6), 439–480. http://dx.doi.org/10.1017/S0140525X07002579.
Byrne, R. M. J., Segura, S., Culhane, R., Tasso, A., & Berrocal, P. (2000). The temporality effect in counterfactual thinking about what might have been. Memory & Cognition, 28(2), 264–281. http://dx.doi.org/10.3758/BF03213805.
Gilovich, T., Vallone, R., & Tversky, A. (1985). The hot hand in basketball: On the misperception of random sequences. Cognitive Psychology, 17(3), 295–314. http://dx.doi.org/10.1016/0010-0285(85)90010-6.
Hsee, C. K., & Abelson, R. P. (1991). Velocity relation: Satisfaction as the function of the first derivative of outcome over time. Journal of Personality and Social Psychology, 60(3), 341–347. http://dx.doi.org/10.1037//0022-3514.60.3.341.
Hsee, C. K., Salovey, P., & Abelson, R. P. (1994). The quasi-acceleration relation: Satisfaction as a function of the chance of velocity of outcome over time. Journal of Experimental Social Psychology, 30, 96–111. http://dx.doi.org/ 10.1006/jesp.1994.1005.
Kahneman, D., & Tversky, A. (1982). The simulation heuristic. In D. Kahneman, P. Slovic & A. Tversky (Eds.), Judgement under uncertainty: Heuristics and biases (pp. 201–208). New York: Cambridge University Press.
Kahneman, D., & Varey, C. A. (1990). Propensities and counterfactuals: The loser that almost won. Journal of Personality and Social Psychology, 59(6), 1101–1110. http://dx.doi.org/10.1037//0022-3514.59.6.1101.
Kühberger, A., Groβ bichler, C., & Wimmer, A. (2011). Counterfactual closeness and predicted affect. Thinking and Reasoning, 17(2), 137–155. http://dx.doi.org/ 10.1080/13546783.2011.562079.
Langer, E. J. (1975). Illusion of control. Journal of Personality and Social Psychology, 32(2), 311–328. http://dx.doi.org/10.1037//0022-3514.32.1.311.
Markman, K. D., & Guenther, C. L. (2007). Psychological momentum: Intuitive physics and naïve beliefs. Personality and Social Psychology Bulletin, 33(6), 800–812. http://dx.doi.org/ 10.1177/0146167207301026.
Markman, K. D., & McMullen, M. N. (2003). A Reflection and Evaluation Model of comparative thinking. Personality and Social Psychology Review, 7(3), 244–267. http://dx.doi.org/10.1207/S15327957PSPR0703\_04.
McMullen, M. N., & Markman, K. D. (2002). Affective impact of close counterfactuals: Implications of possible futures for possible pasts. Journal of Experimental Social Psychology, 38(1), 64–70. http://dx.doi.org/10.1006/jesp.2001.1482.
Meyers-Levy, J., & Maheswaran, D. (1992). When timing matters: The influence of temporal distance on consumers’ affective and persuasive responses. Journal of Consumer Research, 19(3), 424–433. http://dx.doi.org/10.1086/209312.
Miller, D. T., & Gunasegaram, S. (1990). Temporal order and the perceived mutability of events: Implications for blame assignment. Journal of Personality and Social Psychology, 59(6), 1111–1118. http://dx.doi.org/10.1037/0022-3514.59.6.1111.
Petrocelli, J. V., Percy, E. J., Sherman, S. J., & Tormala, Z. L. (2011). Counterfactual potency. Journal of Personality and Social Psychology, 100(1), 30–46. http://dx.doi.org/10.1037/a0021523.
Roese, N. J. (1997). Counterfactual thinking. Psychological Bulletin, 121(1), 133–148. http://dx.doi.org/10.1037//0033-2909.121.1.13.
Roese, N. J., Fessel, F., Summerville, A., Kruger, J., & Dilich, M. A. (2006). The propensity effect: When foresight trumps hindsight. Psychological Science, 17(4), 305–310. http://dx.doi.org/10.1111/j.1467-9280.2006.01703.x.
Spellman, B. A. (1997). Crediting causality. Journal of Experimental Psychology-General, 126(4), 323–348. http://dx.doi.org/10.1037/0096-3445.126.4.323.
Strickland, L. H., & Grote, F. W. (1967). Temporal presentation of winning symbols and slot-machine playing. Journal of Experimental Psychology, 74(1), 10-&. http://dx.doi.org/10.1037/h0024511.
Sundali, J., & Croson, R. (2006). Biases in casino betting: The hot hand and the gambler’s fallacy. Judgment and Decision Making, 1(1), 1–12.
Teigen, K. H (1996). Luck: The art of a near miss. Scandinavian Journal of Psychology, 37, 156–171. http://dx.doi.org/10.1111/j.1467-9450.1996.tb00648.
Teigen, K. H. (1998). When the unreal is more likely than the real: Post hoc probability judgments and counterfactual closeness. Thinking & Reasoning, 4(2), 147–177. http://dx.doi.org/10.1080/135467898394193.
Teigen, K. H. (2005). The proximity heuristic in judgments of accident probabilities. British Journal of Psychology, 96, 423–440. http://dx.doi.org/10.1348/000712605X47431.
Walsh, C. R., & Byrne, R. M. J. (2004). Counterfactual thinking: The temporal order effect. Memory & Cognition, 32(3), 369–378. http://dx.doi.org/10.3758/BF03195831.
Wohl, M. J. A. & Enzle, M. E. (2003). The effects of near wins and near losses on self-perceived personal luck and subsequent gambling behaviour. Journal of Experimental Social Psychology, 39, 184–191. http://dx.doi.org/10.1016/S0022-1031(02)00525-5.
Wu, Y., van Dijk, E., & Clark, L. (2014). Near-wins and near-losses in gambling: A behavioral and facial EMG study. Psychophysiology. Online first. http://dx.doi.org/10.1111/psyp.12336.
Zhang, Q., & Covey, J. (2014). Past and future implications of near-misses and their emotional consequences. Experimental Psychology, 61(2), 118–126. http://dx.doi.org/10.1027/1618-3169/a000231.
Copyright: © 2014. The authors license this article under the terms of the Creative Commons Attribution 3.0 License.
This document was translated from LATEX by HEVEA.