| Figure 1: A typical UK bookie, Ladbrokes. The two posters on the left are advertising special bets: “England to beat Italy 2-0” and “Kane to score the first goal”. |

Judgment and Decision Making, Vol. 10, No. 3, May 2015, pp. 225-231
How bookies make your moneyPhilip W. S. Newall* |
UK bookies (bookmakers) herd geographically in less-affluent areas. The present work shows that UK bookies also herd with the special bets that they advertise to consumers, both in their shop window advertising and on TV adverts as shown to millions of viewers. I report an observational study of betting adverts over the 2014 soccer World Cup. Bet types vary in complexity, with complex types having the highest expected losses. Bookies herded on a common strategy of advertising special bets on two levels: by almost exclusively advertising complex bet types with high expected losses, and by advertising representative events within a given complex bet type. This evidence is most consistent with bookies’ advertising targeting a representativeness heuristic amongst bettors. Bookies may know how to nudge bettors toward larger losses.
Keywords: gambling, sports betting, bookies, bookmaking, advertising,
representativeness heuristic.
The “specials” have long been a feature of soccer betting in British bookies. Special bets on the day’s events are sent from a central office to an individual bookie’s manager, and then heavily promoted. Originally specials were on hand-written boards, but they are now typically shown on posters or electronic screens. Betting shops have historically been visually unappealing; law prevents the interior of a betting shop from being visible to passers-by. The Gambling Act of 2005 relaxed these rules, allowing bookies to advertise in their windows: Bookies now advertise the specials and promotions for other forms of gambling on large shop window posters (Figure 1).
Figure 1: A typical UK bookie, Ladbrokes. The two posters on the left are advertising special bets: “England to beat Italy 2-0” and “Kane to score the first goal”.
UK bookies cluster in less-affluent areas (Ramesh, 2014). Although this finding has been contested by the industry, it has withstood further analysis (Reed, 2014). For example, on the Walworth Road in traditionally less-affluent south-east London, seven bookies from five chains—each with its shop window specials—compete on a few hundred metres of road.
But the rise of internet gambling, and further Gambling Act reforms allowing gambling advertising to appear on TV since 2007, mean the specials have invaded the nation’s living rooms. Online bookies enable betting throughout a soccer match with “in-play” betting, and advertise specials on TV either before the match or during the half-time break. TV specials provide the odds on special bets as the match is happening. More betting firms are beginning to advertise their specials on TV. In 2012 4.1% of all TV advertising was for gambling (Ofcom, 2013).
This paper reports an observational study of bookies’ specials over the 2014 soccer World Cup. Bookies herded in their advertising on two levels. First, bookies concentrated their advertising on a few specific bet types with high expected losses for bettors. But bookies also advertised similar representative events within each bet type. Although bookies rarely advertised the same specific bet (this happened 31 times in the sample of 437 adverts), bookies nonetheless used the same strategy in their advertising. It is hypothesized that bookies have herded on a strategy that exploits bettors’ biases.
Bookies allow bets to be placed on many different events within a soccer match, either before a match, or even during the match with “in-play” betting apps. The “overround” is the amount by which a bookie’s odds for a set of mutually exclusive events exceeds probability = 1. The higher the overround, the higher bettors’ expected losses will be, under the condition that bettors are subject to a Dutch book, with the bookie making risk-free profits. Overrounds are almost always positive; if a bookie’s odds summed to less than one, than bettors could make risk-free arbitrage profits, which can sometimes be achieved by combining the odds from several bookies (Constantinou & Fenton, 2013). The overround is commonly used as an estimate of bettors’ expected losses in the sports betting literature, where
| Expected losses = |
| (1) |
For example, the set of odds quoted on William Hill’s (the largest chain of bookies in the UK) website for the World Cup final corresponded to a probability of Germany winning in normal time of 0.435 (or 13-to-10 in odds form, where a bet of $10 wins $13 profit if Germany wins), a probability of a draw of 0.308, and a probability of Argentina winning of 0.294, then 0.435 + 0.308 + 0.294 = 1.037, overround = 0.037, and expected losses = 3.6%.
These bets, on the three most salient outcomes of a soccer match, are referred to as “match-winner” bets here. Previous studies on the fairness of soccer betting odds have primarily analyzed match-winner bets (Constantinou & Fenton, 2013; Forrest & Simmons, 2001). They are also the least complex bets analyzed here, since all of the possible events in a soccer match are partitioned into just three mutually exclusive events.
Overrounds can also be calculated for bets on more complex events. Bookies offer bets on specific scorelines, where bettors have to correctly predict the exact final result (e.g., Germany to win 1–0, a 0–0 draw, Argentina to win 2–1 etc.), a more fine-grained partitioning of the possible events in a soccer match than match-winner bets. Because soccer is a low-scoring game, most bookies will offer a range of bets on specific scorelines, which should correctly sum to a set of mutually exclusive events with probability = 1. While extreme scorelines may happen, (e.g., Germany winning 8–6), such events are in practice nearly impossible in professional soccer, and will lead to a tiny downward bias in measured overrounds. The sum of probabilities from bets on individual scorelines from William Hill’s website for the World Cup final equalled 1.265, or an overround of 0.265 and expected losses of 20.9%. This shows the large differences in expected losses between different bet types.
First goalscorer bets frequently featured in 2014 World Cup specials, e.g. “Thomas Müller to score first”. These bets are on the first scorer of a goal in the match, meaning that any normative assessment of this bet requires an assessment of relative scoring chances for at least 20 players. Bookies offer these bets on all players who could take part in a match, with bets later refunded on all players who did not play before the first goal was scored (allowing substitutes to be eligible for the bet). Bookies also allow bets to be placed on “no-score”, giving a complete set of events which should normatively sum to probability = 1. Overrounds for first goalscorer bets can therefore be calculated on a post-hoc basis after the match. The overround on William Hill’s eligible first goalscorer bets for the World Cup final translated to 0.832, or expected losses of 45.4%. This figure was especially high because five substitutes joined the game before the first goal was scored.
Scorecaster bets are the final and most complex bet type discussed here. These bets are a conjunction of scoreline and first goalscorer bets for a specific team, e.g. “Thomas Müller to score first and Germany to win 3–1”. Overrounds could not be calculated for these bets with the data collected in this study, because betting odds were not available for a complete set of events (e.g., Thomas Müller could score first but Germany go on to lose). But scorecaster bets must have high overrounds because of the already-high overrounds of their constituent parts.
Since betting markets occur in the real world and for real stakes, they are an ecologically-valid way to explore biases in probability judgment (Ayton, 1997). Three theories of biases in probability judgment could be relevant.
Support theory states that the sum of probability estimates increases as a class of events is unpacked into a number of constituent elements (Tversky & Koehler, 1994). Compared to a normative probability judgment, the increased salience of sub-categories leads to higher total subjective probabilities for unpacked events. An example from Tversky and Koehler is that the sum of probability ratings of the separate components of “death resulting from heart disease, cancer or some other natural cause” was higher than the rating of “death resulting from natural causes”.
Support theory could thus explain why the implied probability of a team winning is higher for scoreline than match-winner bets (since scoreline bets are unpacked to a greater degree). An earlier study of bookies’ odds for soccer games found evidence in favor of support theory (Ayton, 1997) when the disjunctive components of a bet were presented separately. Support theory predicts that bookies could profit by encouraging bettors toward finely-partitioned bets which should be overestimated the most, and the data on overrounds in the previous section is in line with this. The probability of each partition is overestimated, resulting in the sum of these estimates being too high.
Conjunction bias is the finding that, other things being equal, participants prefer bets on compound events rather than simple events (Bar-Hillel, 1973; Slovic, 1969). Importantly, people do not always suffer conjunction bias. Some conjunctions seem as implausible as they truly are (for example, when flipping a fair coin the sequence H-H-H-H-H seems less likely than H-T-H-T-T). The conjunction bias is a weaker version of the “conjunction fallacy”, where participants rate P(A&B) > P(A) or P(B), violating the axioms of probability by rating the probability of a complex event as higher than one of its constituent elements (Tversky & Kahneman, 1983). The conjunction fallacy therefore implies the conjunction bias. Tversky and Kahneman’s Linda problem is the best-known example of the conjunction fallacy:
Linda is 31 years old, single, outspoken, and very bright. She majored in philosophy. As a student, she was deeply concerned with issues of discrimination and social justice, and also participated in anti-nuclear demonstrations.
A majority of participants in Tversky and Kahneman’s experiments rated it is as more likely that Linda is a bank teller and is active in the feminist movement, than Linda is a bank teller, thereby rating P(A&B) > P(A). Tversky and Kahneman say this error is due to the description of Linda being more representative of someone who is active in the feminist movement, and argue that the “representativeness heuristic” leads to the overestimation of complex probabilities, although rival explanations of the conjunction fallacy are still debated (Tentori, Crupi, & Russo, 2013). People would reason much better if asked for the probability that Linda is a bank teller and is active in the pro-gun lobby.
Representative events in a soccer match are the favorite team winning (match-winner bets), the favorite winning by a high scoreline (scoreline bets), or a star player scoring the first goal (first goalscorer bets). The favorite winning by a high scoreline (e.g. Germany winning 4–1) is a highly representative event, and may well be overestimated, especially since bettors may underestimate the number of possible high scorelines (e.g. 4–0, 3–1 and so on). There are fewer representative events involving underdog teams, but 1–0 is representative of a poor team winning, since it is easiest to recall games where an underdog has eked out a narrow win. A star player scoring the first goal is a highly representative event that bettors may overestimate. A non-star player scoring the first goal is less salient, but may be actually quite likely given the number of players in a soccer match (the combined chances from many non-star players).
Finally, bettors may simply have a preference for bets with high potential payoffs, because they overweight small probabilities (Kahneman & Tversky, 1979). Match-winner bets do not tend to offer high payoffs, as long as the two teams are somewhat evenly matched. Therefore, bookies may offer finely-partitioned bets just to satisfy bettors’ preference for high potential payoffs. If this is the case, then the odds on offer from advertised specials would be a key factor.
On each match day, shop window specials and specials from inside the shop (defined as any bet prominently advertised on a poster or electronic screen) were photographed from shops of at least the four main chains of bookies in the UK, who own 7,865 of the UK’s approximately 8,700 betting shops. Specials were recorded from across the UK, but predominantly from Bristol, London, and Stirling. Shops from the same betting chain usually ran the same or very similar specials in each sampled city. The sample of specials analyzed in this paper is incomplete, but the study was designed to be as inclusive as feasible.
In total 103 TV specials were recorded by the researcher using a digital TV with recording and playback features. All matches except for South Korea versus Belgium were covered (recording failure). Sixty specials were shown during the half-time break, with the remainder being shown before the match had started.
All observed shop window specials were recorded, which totaled 179 observations across five retail bookies. First goalscorer, scoreline, and scorecaster specials were also recorded from within individual betting shops, to enlarge the sample of specials from more salient media. These three bet types were focused on because of their high frequency in TV and shop window specials. Within-bookie specials covered a wide variety of bet types, both within- and between-bookies, and so it was infeasible to record and analyze all of these specials.
On the morning of each match day odds of all events were downloaded as html files from the sites of Ladbrokes, Paddy Power, and William Hill (a permanent record of odds from other sites could not be recorded due to these sites being programmed in flash). These data was then used in the analysis. This procedure was deemed more accurate than relying on third party odds-comparison sites to collect data from more bookies. Data for other bookies were estimated by using the average odds for each event across these three bookies. This introduces potential error, but bookies’ odds were very similar. For example, the mean raw probability of a 1–0 win was 0.11 for either team over all matches and all three bookies. The between-bookie standard error of these probabilities was only 0.007.
Odds change in the run-up to a match, meaning that sometimes advertised and recorded probabilities for the same event differed even within a bookie. If this was the case, then downloaded probabilities were used, rather than making arbitrary adjustments to a complete set of odds (if the probability on one event decreases, then either the overround may decrease or the probability on other events may increase).
Figure 2: Overrounds in three bet types over the 2014 World Cup. 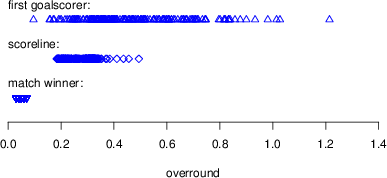
Averaged over the 2014 World Cup, overrounds on match-winner bets for the three bookies were very similar: 0.045 (Ladbrokes), 0.039 (Paddy Power), and 0.059 (William Hill). Data from oddschecker.com was used to evaluate whether overrounds on match-winner bets from these three bookies were representative of the entire industry. Increasing the sample to 56 online bookies revealed an industry-average overround of 0.051, with a standard error of 0.020, indicating that these three bookies are representative of the wider industry.
Averaged over the 2014 World Cup, overrounds on scoreline bets for the three bookies were 0.237 (Ladbrokes), 0.323 (Paddy Power), and 0.282 (William Hill), or 0.281 on average.
Figure 3: Percentage of TV and shop window advertising by bet type. 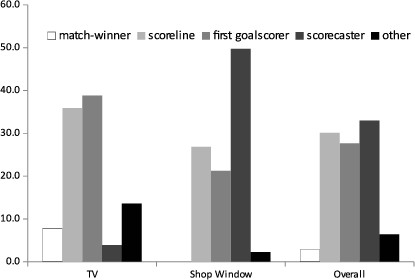
Over the whole 2014 World Cup, overrounds on first goalscorer bets averaged 0.478. Overrounds were slightly more variable in this bet type, but were uniformly high: 0.464 (Ladbrokes), 0.424 (Paddy Power), and 0.534 (William Hill). While first goalscorer bets often have similar overrounds to scoreline bets, they can have much higher overrounds if many substitutes join the match before the first goal is scored (which is something that bookies cannot perfectly predict).1 Figure 2 summarizes recorded overrounds in these three bet types.
Which bet types featured in bookies’ specials? TV and shop window specials are the most salient to non-regular bettors. Figure 3 provides full details on all observed TV and show-window specials. Eight of 103 TV adverts were on match-winner bets (7.8%), while match-winner bets never appeared in collected shop window specials. Overall, match-winner bets comprised 2.8% of total advertising over these two media. First goalscorer bets (27.7%) and scoreline bets (30.1%) were much more frequently advertised. These bet types have much higher expected losses than match-winner bets. Bookies also frequently advertised scorecaster bets (33.0%). The sample is completed by 6.4% “other” bets. These were complex bets that did not fit neatly into any of the more frequent categories, such as “Germany to win and both teams to score”.
Table 1: Summary of data collected. These firms account for 8,131 of the UK’s approximately 8,700 high-street bookies (numbers from the association of British bookmakers, and from the bookies’ websites). Bet 365 and Betway are online-only bookies.
Advertising medium Bet type Bet365 Betfred Betway Coral Ladbrokes Paddy Power William Hill Total TV Match-winner 7 - 1 - 0 - - 8 First goalscorer 35 - 2 - 3 - - 40 Scoreline 30 - 5 - 2 - - 37 Scorecaster 0 - 0 - 4 - - 4 Other 0 - 7 - 7 - - 14 Total 72 - 15 - 16 - - 103 Shop Window Match-winner - 0 - 0 0 0 0 0 First goalscorer - 0 - 0 38 0 0 38 Scoreline - 8 - 0 35 5 0 48 Scorecaster - 0 - 36 0 0 53 89 Other - 0 - 0 4 0 0 4 Total - 8 - 36 77 5 53 179 Within-bookie First goalscorer - 0 - 0 29 3 0 32 Scoreline - 40 - 0 28 0 0 68 Scorecaster - 0 - 54 0 1 0 55 Total - 40 - 54 57 4 0 155 Total 72 48 15 90 150 9 53 437 Number of shops - 1,375 - 1,786 2,268 266 2,436 8,131
Bookies’ advertising had a strong tilt toward complex bet types with high expected losses; 90.8% of TV and shop window specials were for bet types with high expected losses. This shows that bookies herd by advertising bet types with high expected losses. See Table 1 for a breakdown of all 437 specials recorded.
Figure 4: Data scatterplot of first goalscorer bets. This lack of variation between-bookies shows that bookies herded on a common strategy of advertising likely goalscorers. 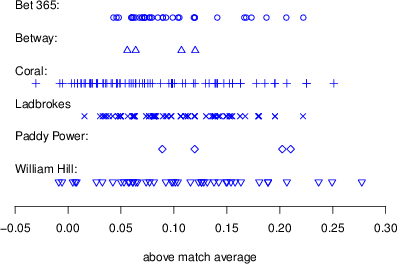
There were 263 bets involving the first goalscorer; 110 were first goalscorer bets. Five bets were a conjunction of first goalscorer and winning team bets (grouped with first goalscorer bets in the analysis). There were 148 scorecaster bets, for which the “first goalscorer” part of the bet will be used in this analysis. Bookies are taking risks with pre-match bets: First goalscorer bets are refunded if the player does not take part in the match prior to the first goal, while scorecasters revert to scoreline bets. Thirty one bets (11.8%) were shown on TV at half-time. Twenty five, or 10.8% of the 232 pre-match first goalscorer bets, were non-valid due to the player not taking part prior to the first goal and were hence not analyzed.
A player’s probability of scoring the first goal was transformed by subtracting the average probability of a player in that match scoring the first goal, providing a measure of above-average scoring likelihood. There were no significant differences on this measure between first goalscorer and scorecaster bets, t(236) = 1.05, p = .295, and pre-match and half-time bets, t(236) = 1.21, p = .227, so the results were pooled. Instead of randomly selecting players from the match, the specials were geared toward advertising likely goalscorers: Advertised players had a probability of scoring 0.098 higher than average. Given that the average player had a probability of 0.065 of scoring the first goal, advertised players were more than twice as likely as average to score the first goal. Bookies herded in their advertising of likely goalscorers in first goalscorer bets. Figure 4 shows visually the lack of variation in the data.
Figure 5: Scoreline bets. Team strength for each advertised bet is shown on the x-axis. Observations are grouped by scoreline, where 1–0 is the most likely winning scoreline, 2–1 the next most likely and so on. There is a clear pattern where higher scorelines are advertised for teams of higher team strength. Scoreline means of team strength are: 1–0 0.42; 2–1 .56; 2–0 0.58, 3–0 plus 0.71. 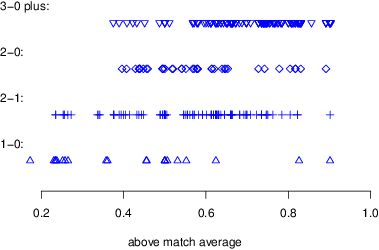
Bookies frequently advertised bets on specific match scorelines: 275 pre-match adverts were recorded from seven bookies (131 scoreline bets and 144 scorecaster bets; half-time bets were not analyzed since the number of goals scored in the first half affects the likelihood of various scorelines). What specific events from these bet types were advertised to consumers?
Figure 6: Distribution of decimal odds for the three main bet types. 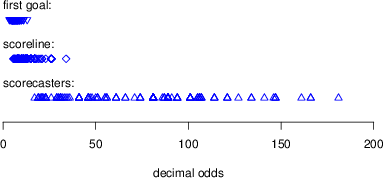
“Team strength” was measured via bookies’ probabilities of a team winning, normalized to the range (0,1), so that a team with strength = 0.5 was equally likely to win or lose the match (removing the influence of draws and the overround). Figure 5 shows team strength on the x-axis; observations are grouped by specific scorelines, where 1-0 is statistically the most likely winning scoreline, 2–1 the second most likely, and so on. There is a clear trend that as team strength increases, higher (and less likely) scorelines are shown. A scoreline of 1–0 is most often shown for underdogs (team strength < 0.5), and scorelines of 3–0 or higher are most often shown for favorites. There is a bias toward favorites, with a mean team strength of .618, in line with bookies advertising representative events.
If bettors overweight small probabilities, bookies’ advertising may be geared toward bets with long odds. Figure 6 plots the potential payoff from all valid pre-match scoreline, first goalscorer, and scorecaster bets. Odds are presented in decimal format, a convenient format of odds presentation, where decimal odds = 1/probability. Decimal odds also represent the total payoff for a winning $1 bet. There is a large variation in odds within each bet type, and little overlap between different bet types. First goalscorer bets have decimal odds of between 3.5 and 13; scoreline bets range between 5.5 and 34; scorecaster bets range between 17 and 181.
UK bookies cluster in less-affluent areas (Ramesh, 2014; Reed, 2014). As well as herding geographically, the present work shows that bookies herd in how they advertise specific bets to consumers. Bookies herd on two levels, firstly concentrating on a few types of bets with high expected losses (first goalscorer, scoreline, and scorecaster bets—see Figure 3). Bookies rarely advertise match-winner bets, which have much lower expected losses than the other three bet types. But bookies also herd within these three bet types, by advertising likely goalscorers and by combining favorite teams with unlikely scorelines and vice versa.
The present work hypothesises that this herding might be caused by an exploitation of bettor biases. Support theory correctly predicts that overrounds will increase with the number of partitions of a bet. However, the very strong pattern of advertising within each bet type is more consistent with bookies targeting the representativeness heuristic, as support theory does not make any predictions about specific partitions being overestimated compared to others. Almost all advertised scoreline and first goalscorer bets seem to tap into notions of representativeness. And by combining a representative first goalscorer and representative scoreline, scorecaster bets may be made attractive despite offering high expected losses to bettors.
Figure 6 shows that there is little evidence for bookies targeting a specific level of risk with their bets: There is little overlap in the riskiness of the three major bet types. However, this need not be the case. Bookies could easily make first goalscorer bets as risky as scorecaster bets by advertising extremely unlikely goalscorers (for example the goalkeeper, a player who almost never scores in open play), but they prefer to only advertise likely goalscorers, in keeping with representativeness. Similarly, scoreline bets could be made much riskier by advertising underdog teams winning by unlikely scorelines (an extremely unrepresentative event), but this advertising strategy was not used.
The large differences in expected losses between different bet types indicate that simply nudging bettors toward different bet types may have a large effect on total losses. Ladbrokes, Paddy Power, and William Hill are all publically-listed companies, and revealed in shareholder disclosures that their gross wins over the 2014 World Cup were 24.3%, 17.3%, and 18.4% respectively. This is over three times higher than the expected losses from match-winner bets at these three bookies of 4.3%, 3.7%, and 5.6% respectively. There remains substantial room to reduce bettors’ losses.
Betting markets constantly change, so this study provides only a snapshot in time. It is easy to imagine how complex bets may have come to take their current role. Since complex bets split the event space into ever-finer partitions, a risk-averse bookie would naturally increase overrounds every time a level of complexity is added, as insurance against professional sports betters exploiting the greater choice space. But a modern bookie with access to big data may have discovered the variables which maximize total profits from complex bets. While bettors may find it easy to compare odds on match-winner bets, the number of possible events within complex bet types may make it harder to shop around for the best deal. Although bookies all had similar patterns in their advertising of complex bets, two bookies rarely advertised exactly the same bet (this happened only 31 times in 437 adverts). While nudges are the currently favored method of protecting biased consumers (Thaler & Sunstein, 2008), the sort of nudges present in bookies’ advertising may be having the opposite effect.
Ayton, P. (1997). How to be incoherent and seductive: Bookmakers’ odds and support theory. Organizational Behavior and Human Decision Processes, 72(1), 99–115.
Bar-Hillel, M. (1973). On the subjective probability of compound events. Organizational Behavior and Human Performance, 9(3), 396–406.
Constantinou, A. C., & Fenton, N. E. (2013). Profiting from arbitrage and odds biases of the European football gambling market. The Journal of Gambling Business and Economics, 7(2), 41–70.
Forrest, D., & Simmons, R. (2001). Globalisation and efficiency in the fixed-odds soccer betting market. Mimeo. University of Salford, Salford, UK.
Kahneman, D., & Tversky, A. (1979). Prospect theory: An analysis of decision under risk. Econometrica, 47(2), 263–292.
Ofcom. (2013). Trends in advertising activity - gambling. Retrieved from http://stakeholders.ofcom.org.uk/binaries/research/tv-research/Trends\_in\_Ad\_Activity\_Gambling.pdf.
Ramesh, R. (2014). England’s poorest bet £13bn on gambling machines. Retrieved from http://www.theguardian.com/society/2014/feb/28/englands-poorest-spend-gambling-machines.
Reed, H. (2014). A review of the local data company’s report: An independent analysis of betting shops and their relationship to deprivation along with their profile relative to other high street business occupiers. Retrieved from http://www.stopthefobts.org/wp-content/uploads/2014/12/Reed-report.docx.
Slovic, P. (1969). Manipulating the attractiveness of a gamble without changing its expected value. Journal of Experimental Psychology, 79(1), 139–145.
Tentori, K., Crupi, V., & Russo, S. (2013). On the determinants of the conjunction fallacy: Probability versus inductive confirmation. Journal of Experimental Psychology: General, 142(1), 235–255.
Thaler, R. H., & Sunstein, C. R. (2008). Nudge: Improving decisions about health, wealth, and happiness. New York: Yale University Press.
Tversky, A., & Kahneman, D. (1983). Extensional versus intuitive reasoning: The conjunction fallacy in probability judgment. Psychological Review, 90(4), 293–315.
Tversky, A., & Koehler, D. J. (1994). Support theory: A nonextensional representation of subjective probability. Psychological Review, 101(4), 547–567.
Copyright: © 2015. The authors license this article under the terms of the Creative Commons Attribution 3.0 License.
This document was translated from LATEX by HEVEA.