Graphs versus numbers: How information format affects risk aversion in gambling
Michael Dambacher*#$
Peter Haffke$$ Daniel Groß$
Ronald Hübner$$
In lottery gambling, the common phenomenon of risk aversion shows up as
preference of the option with the higher win probability, even if a
riskier alternative offers a greater expected value. Because riskier
choices would optimize profitability in such cases, the present study
investigates the visual format, with which lotteries are conveyed, as
potential instrument to modulate risk attitudes. Previous research has
shown that enhanced attention to graphical compared to numerical
probabilities can increase risk aversion, but evidence for the
reverse effect — reduced risk aversion through a graphical display of
outcomes — is sparse. We conducted three experiments, in which
participants repeatedly selected one of two lotteries. Probabilities
and outcomes were either presented numerically or in a graphical format
that consisted of pie charts (Experiment 1) or icon arrays (Experiment 2 and 3).
Further, expected values were either higher in the safer or in the
riskier lottery, or they did not differ between the options. Despite a
marked risk aversion in all experiments, our results show that
presenting outcomes as graphs can reduce — albeit not eliminate — risk
aversion (Experiment 3). Yet, not all formats prove suitable, and
non-intuitive outcome graphs can even enhance risk aversion (Experiment 1).
Joint analyses of choice proportions and response times (RTs) further
uncovered that risk aversion leads to safe choices particularly in fast
decisions. This pattern is expressed under graphical probabilities,
whereas graphical outcomes can weaken the rapid dominance of risk
aversion and the variability over RTs (Experiment 1 and 2). Together, our
findings demonstrate the relevance of information format for risky
decisions.
Psycho-economic research has shaped a sophisticated picture of human
behavior in risky decision making (Fehr-Duda & Epper, 2012; Gigerenzer
& Gaissmaier, 2011; Kahneman, 2003; Mishra, 2014). One of the most
established phenomena in this domain is risk aversion, the
preference of the safer option, even if the expected benefit of a
riskier alternative is higher. The tendency to avoid risks is
particularly expressed under positive prospects with medium to large
probabilities (Holt & Laury, 2002; Tversky & Kahneman, 1992).
Although risk preferences vary between individuals and are sensitive to
factors, such as time pressure (Ben Zur & Breznitz, 1981),
environmental conditions (Guiso, Sapienza & Zingales, 2013; Haushofer
& Fehr, 2014), or the affective state of the decision maker (Nguyen &
Noussair, 2014), risk aversion is a widespread attitude that is
relatively stable within individuals over time (Glöckner & Pachur,
2012; Wölbert & Riedl, 2013). While effects have been mostly described
in terms of choice proportions, risk aversion has also been shown in
faster response times (RTs) for the safer option (Rubinstein, 2013).
Indeed, recent approaches increasingly take advantage of both choice
proportions and RTs, since both measures provide important
information about risk preferences and choice difficulty (Busemeyer &
Townsend, 1993; Busemeyer, 2015; Diederich, 2003; Usher & McClelland,
2004).
A grand proportion of evidence about risk aversion comes from gambling
experiments, in which participants choose between lotteries, each with
a given probability to get a certain outcome. In
lotteries with positive prospects, risk aversion is characterized as
preference of the lottery with the higher win probability. As
consequence, participants repeatedly opt for the safer lottery despite
a higher expected value (EV) in a riskier alternative. Here, an
increase of risk taking would contribute to the optimization of
decisions (in terms of outcome profitability), which is arguably a
desirable goal in many situations. Such optimization would seem to
require a more balanced consideration of probabilities and outcomes.
The question therefore is, how can decision makers be persuaded to
appreciate the importance of outcomes?
A straightforward idea to enhance the impact of a certain piece of
information is to increase its perceptual salience, which is known to
attract attention and to foster processing (Awh, Belopolsky &
Theeuwes, 2012; Chun, Golomb & Turk-Browne, 2011). Compared to
numerical information, for instance, a graphical representation can
well be more salient, given that graphs offer a large variability in
visual features that contribute to salience (e.g., shape, color, size,
orientation; see Itti & Koch, 2001). Indeed, numerical and graphical
information are common elements in experiments examining decisions
under risk. Outcomes are usually displayed numerically, whereas
probabilities are conveyed either in a numerical or in a graphical
format. Yet, despite some previous work, influences of these different
formats on risky decisions are not well established.
Prior research has predominantly investigated effects of different
probability formats, and a number of studies showed relatively stable
results. For instance, probabilities that were conveyed as numbers,
histograms, pie charts, or natural frequencies, yielded qualitatively
similar patterns of results concerning phenomena of coalescing and
stochastic dominance (Birnbaum, Johnson & Longbottom, 2008; Birnbaum,
2004, 2006).
Other studies, especially in the health domain, demonstrated that
decisions are sensitive to the format in which probabilities are shown.
For instance, Chua, Yates, and Shah (2006) reported that graphical
rather than numerical probabilities increase the readiness to avoid
health risk. When quantities were shown graphically, people were more
willing to pay for safer alternatives than when risk was communicated
numerically. The authors proposed that graphs attract and hold
attention more strongly than numerical information. Accordingly,
enhanced processing increases the importance of graphical information
and emphasizes its impact on the decision. It has also been argued that
graphs can convey information more intuitively and hence facilitate
understanding. Thus, under certain conditions, graphical components
exhibit stronger influences on decisions than information in another
format (Ancker, Senathirajah, Kukafka & Starren, 2006; Bodemer &
Gaissmaier, 2012; Gaissmaier et al., 2012; Lipkus & Hollands, 1999;
Visschers, Meertens, Passchier & de Vries, 2009).
Further support comes from eye tracking data. Smerecnik et al. (2010)
examined processing differences between textual, tabular, and graphical
risk information, and found that graphs receive more attention (as
indicated by inspection times) and require less cognitive effort (as
indicated by pupil size) than the other probability formats. In turn,
it has been shown that gaze durations themselves affect preferences and
decisions, and can therefore enhance the preference for graphical
information (Armel, Beaumel & Rangel, 2008; Krajbich, Armel &
Rangel, 2010; for a review see Orquin & Mueller Loose, 2013). Thus,
there is some evidence that graphical probabilities have an
impact on decisions and contribute to risk averse choices.
However, it is an open question whether this rationale can be reversed,
that is whether graphically displayed outcomes can increase
the impact of lottery gains and therefore modulate risk attitudes in a
way that leads to reduced risk aversion. Systematic manipulations of
presentation formats in gambling experiments are rare. One exception is
a study by Fiedler and Unkelbach (2011), who crossed numerical and
graphical formats of lottery constituents. In the graphical format,
probabilities were displayed as spatially distributed winning (smileys)
and losing (Xs) lottery tickets, and outcomes were illustrated as
images of banknotes. Attractiveness ratings were then assessed for each
lottery, which was presented in isolation. In line with risk averse
preferences, the ratings indicated that attractiveness of lotteries
increased with win probability. This pattern was particularly expressed
under graphed probabilities and numerical outcomes. Critically, a
graphical outcome attenuated the preference for the higher probability
lottery, although it did not turn the pattern into absolute higher
attractiveness of the higher outcome. The finding suggests that
graphical outcomes can reduce risk aversion, but Fiedler and Unkelbach
pointed to an asymmetry between format effects of probabilities and
outcomes. They claimed that the comprehension advantage of a graphed
compared to a numerical format is larger for probabilities than for
outcomes, and experiencing outcomes as graphical quantities might even
have detrimental effects if they increase cognitive demands.
Yet, these conjectures have hardly been empirically tested, so
knowledge about the impact of graphical outcomes on risk aversion is
sparse. Evidence that graphs can enhance the relative importance of
information has been predominantly shown for probabilities, but it is
not established how risk aversion changes when the same graphical
representations reflect outcomes.
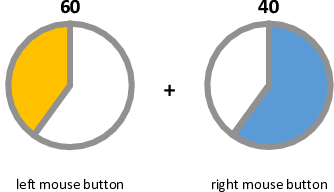
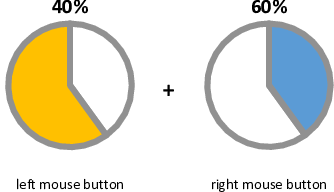
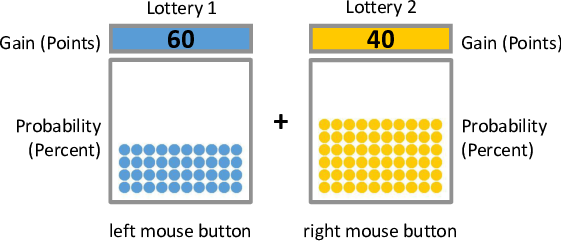
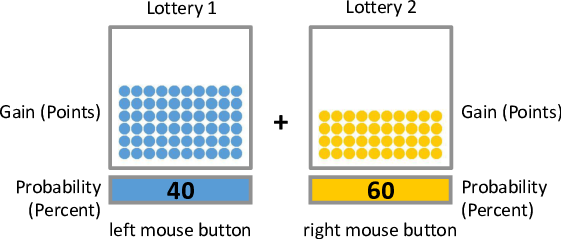
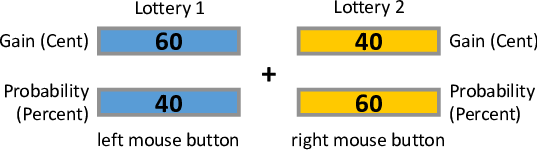
Figure 1: Stimulus example of Experiment 1. Participants chose between
two lotteries presented to the left and right of a central fixation
cross via clicks on the left or right mouse button. Colored pie chart
areas reflect (A) win probabilities (graphed-probability format) or (B)
non-zero outcomes (graphed-outcome format) of each lottery. Numbers
above each chart reflect (A) non-zero outcomes (graphed-probability
format) or (B) win probabilities (graphed-outcome format).
Probabilities and outcomes of a lottery pair added to 100 percent and
100 points in each trial, respectively. Presentation format was
manipulated between participants.
A
B
1.1 Present study
The present study aimed at further examining format effects and
focused on the impact of graphical and numerical information on risk
aversion. We conducted three experiments, in which participants
repeatedly selected one of two simultaneously presented lotteries, A
and B. Since strong risk aversion has been observed under non-negative
prospects (Holt & Laury, 2002; Tversky & Kahneman, 1992), both
lotteries offered positive and zero outcomes with certain
probabilities. Probabilities and outcomes were presented in numerical
or graphical formats. Graphical probabilities and outcomes were
presented as pie charts (Experiment 1) or icon arrays (Experiment 2
and 3). To assess the influence of format on choices under different
payoff combinations, lottery pairs A and B corresponded to one of four
expected value (EV) conditions, in which either (a) the higher win
probability (pro-prob), (b) the higher outcome (pro-out), (c) both
constituents (congruent), or (d) neither of them (neutral) were
indicative of the lottery with the higher EV.
Importantly, our procedure advances previous experimental protocols on
format effects in two points. First, probabilities and outcomes across
our conditions were represented by the same graphs. Consequently, we
largely eliminate potential confounds due to low level visual
differences, whereas Fiedler and Unkelbach (2011) used different
graphical formats for probabilities and outcomes. Second, we assessed
both choice proportions and RTs, since both measures together inform
about preference strength and choice difficulty. For instance, it is
well established that higher choice proportions usually come with
shorter RTs (Busemeyer & Townsend, 1993; Busemeyer, 2015; Jamieson &
Petrusic, 1977; Petrusic & Jamieson, 1978). Further, analyses of RT
distributions (i.e., conditional choice functions, see below) enabled
us to examine format effects on the dynamics of risk aversion, which
goes beyond a static characterization of risk preferences.
In all experiments, we expected a marked tendency of risk aversion,
which should show up as larger choice proportions and shorter RTs for
the option with the higher win probability (i.e., lottery
A).1
Besides these general predictions, we pursued two related questions: The
first was whether graphical lottery outcomes can reduce risk aversion,
just as graphical probabilities can foster risk aversion. As a
possible pattern, we considered that graphical information may attract
attention and hence increase the subjective importance of the graphical
component. Graphical outcomes should then result in a relative increase
of choices and a decrease of RTs for the riskier options (i.e., the
lotteries with the higher outcomes). Alternatively, graphical displays
may be particularly beneficial for the presentation of probabilities,
so that graphed-outcome formats have no effect or, in case of
detrimental influences (K. Fiedler & Unkelbach, 2011), even enhance
risk aversion.
The second question was, how format affects the dynamics of risk
aversion — that is, the relative change of choice proportions across
the RT distribution. Specifically, rapid accessibility of graphical
probabilities may promote risk averse choices particularly in fast
responses. Such a pattern — if it exists — might be inverted or at
least less pronounced with graphical outcomes.
Table 1: Overview of EV-conditions and presentation formats in Experiments 1 and 2. In the congruent EV-condition, win probabilities as well as outcomes, and therefore expected values, were higher in lottery A than in lottery B. In neutral, pro-prob, and pro-out EV-conditions, win probabilities were higher in lottery A and outcomes were higher in lottery B. Expected values were equal for both lotteries in the neutral, higher for lottery A in the pro-prob, and higher for lottery B in the pro-out EV-condition. EV-conditions were identical in the graphed-probability and the graphed-outcome presentation format. A and B refer to lottery A and lottery B, respectively.
Lottery components
Number of trials per participant
EV-condition
Win probability
Outcome
Expected value
Graphed-probability
Graphed-outcome
congruent
A > B
A > B
A > B
320
320
neutral
A > B
A < B
A = B
240
240
pro-prob
A > B
A < B
A > B
320
320
pro-out
A > B
A < B
A < B
320
320
Table 2: Combinations of win probabilities and outcomes set up a total of 15 lottery pairs in four EV-conditions.
Win probabilities (in %)
Outcomes (in points)
Expected values
EV-condition
Lottery A
Lottery B
Lottery A
Lottery B
Lottery A
Lottery B
1
pro-out
80
20
15
85
12.0
17.0
2
pro-prob
80
20
45
55
36.0
11.0
3
neutral
80
20
20
80
16.0
16.0
4
pro-prob
80
20
25
75
20.0
15.0
5
congruent
80
20
75
25
60.0
5.0
6
pro-out
70
30
25
75
17.5
22.5
7
congruent
70
30
75
25
52.5
7.5
8
neutral
70
30
30
70
21.0
21.0
9
pro-prob
70
30
35
65
24.5
19.5
10
congruent
70
30
65
35
45.5
10.5
11
pro-out
60
40
35
65
21.0
26.0
12
congruent
60
40
65
35
39.0
14.0
13
neutral
60
40
40
60
24.0
24.0
14
pro-prob
60
40
45
55
27.0
22.0
15
pro-out
60
40
15
85
9.0
34.0
2 Experiment 1
In Experiment 1, numbers and pie charts were used to display the lottery
constituents. In the graphed-probability format, probabilities were
presented as pie charts and outcomes were shown as numbers; this is a
common format for lotteries that has been used in various gambling
studies (Alós-Ferrer, Granić, Kern & Wagner, 2016; Grether & Plott,
1979; Hey & Orme, 2014; Rieskamp, 2008; Smith et al., 2009).
Conversely, the graphed-outcome format displayed outcomes as pie charts
and probabilities as numbers (Figure 1).
2.1 Methods
Participants.
A total of 19 voluntary participants in the graphed-probability (11
female, mean age: 25.1 y; SD: 6.0 y) and another 18 participants in the
graphed-outcome format (13 female, mean age: 22.3 y; SD: 3.5 y) were
recruited at the Universität Konstanz. Data from one further
participant in the graphed-probability format was excluded because of
insufficient task compliance.
Task and stimuli.
In both presentation formats, participants performed a computerized
gambling task with a total of 1200 choices between two lotteries A and
B, which were presented to the left and right of a central fixation
cross on the screen (Figure 1). Each lottery comprised a probability
p of winning a positive amount of x points, and the
counter-probability 1–p of winning zero points. Win
probabilities as well as outcomes of each lottery pair summed up to 100
percent and 100 points, respectively. A detailed description of the
lottery characteristics is given in the following (see also Table 1 and
2).
In lottery A the chance of winning was either 60%, 70%, or 80%,
whereas the counter-probability of 40%, 30%, or 20%, respectively,
was associated with a zero-gain. Lottery B reflected the inverse
pattern, i.e., probabilities of non-zero gains of 40%, 30%, or 20%,
and corresponding zero-gain probabilities of 60%, 70%, or 80%.
Lottery pairs comprised non-zero outcomes of one of the following sets:
either 85/15, 80/20, 75/25, 70/30, 65/35, 60/40, or 55/45 points.
Selected combinations of probabilities and outcomes set up four
experimental EV-conditions (Table 1 and 2), which varied the predictive
power of the two lottery constituents with respect to the expected
value (EV): (1) In the congruent EV-condition, lottery A
exhibited both a higher win probability and a higher outcome than
lottery B; accordingly EV was higher in lottery A. (2) In the
neutral EV-condition, both lotteries had the same EV, but
lottery A had the higher win probability while lottery B had the higher
outcome. (3) In the pro-prob EV-condition, the higher EV was
linked to lottery A, which had a higher win probability but a lower
outcome than lottery B. (4) In the pro-out EV-condition, the
higher EV was held by lottery B, which had a higher outcome but a lower
win probability than lottery A.
Across all EV-conditions, presentation format was varied between
participants. In the graphed-probability format, probabilities
were displayed as pie charts, whereas non-zero outcomes were shown as
numbers above each chart. This format is relatively common in gambling
studies. The reverse mapping was used for the graphed-outcome
format, with outcomes as pie charts and win probabilities as numbers
above each chart. In both formats, numerical lottery constituents were
randomly jittered by ±2 points in order to reduce recognition effects;
an exception was the neutral EV-condition, where the absence of a
jitter granted equal EVs between lotteries A and B.
In all lotteries, characters had a visual angle of approximately
0.46°horizontally and 0.69°vertically. The diameter of each
pie chart extended to a visual angle of approximately 5.27°. The
distance from the center of each pie chart to the fixation cross was
3.55°. Pie chart areas reflecting win probabilities (i.e.,
graphed-probability) or outcomes (i.e., graphed-outcome) were colored
blue in one and yellow in the other lottery; colors as well as screen
positions (i.e., left or right) were randomly assigned to lotteries A
and B in each trial.
All stimuli were presented on a white background on an 18’’
color-monitor with a resolution of 1280 × 1024 pixels and a refresh
rate of 60 Hz. A computer mouse served as response device. Stimulus
presentation and response collection were controlled by the software
Presentation (version 16.3, Neurobehavioral Systems).
Procedure.
Participants were seated approximately 50 cm away from the monitor.
Their task was to select one of two lotteries by pressing the
corresponding mouse button with the index (left lottery) or the middle
finger (right lottery) of their right hand.
A trial started with a central fixation cross for a random interval
between 250 and 750 ms. Then a lottery pair appeared and stayed on the
screen until the participant responded. In the practice trials, a feedback
screen for 1000 ms displayed the result of the chosen gamble (i.e.,
either the non-zero outcome or zero points) with the purpose to
familiarize participants with the consequences of their decisions. No
feedback was given in the main trials in order to prevent strategy
changes over the course of the experiment. The result of each selected
lottery was calculated by the computer and stored for later payment.
Participants received course credits or a base payment of 8 EUR. In
addition, the points made through their lottery choices were converted
into a monetary amount of up to 8 EUR, depending on the proportion of
earned relative to the possible maximum points in the experiment.
Overall, the experiment comprised one practice block and 20 main blocks
of 60 trials each and took around one hour. Thereafter, participants were
presented with a questionnaire on risk behavior, which is not further
reported here.
Analyses.
Trials with RTs faster than 100 ms or slower than 2000 ms (4.4% in
graphed-probability and 5.8% in graphed-outcome) as well as data from
the practice block were excluded from analyses. We additionally dropped
data from one participant in the graphed-probability format because
38% suboptimal choices in the congruent EV-condition (compared to an
average of 2.74% in the graphed-probability and 7.47% in the
graphed-outcome format) pointed to insufficient task compliance.
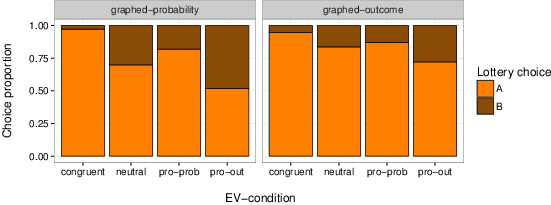
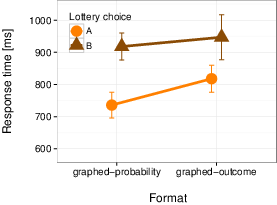
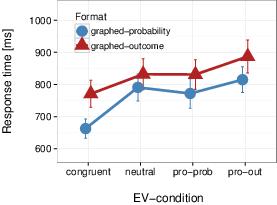
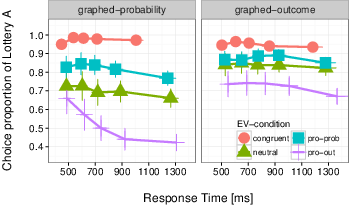
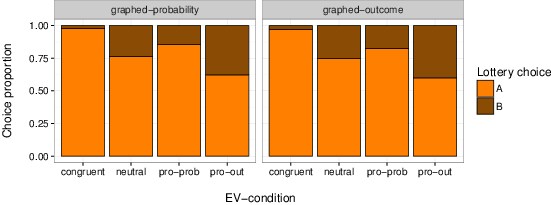
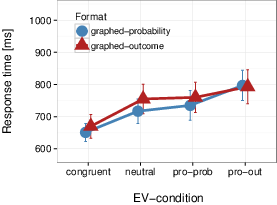
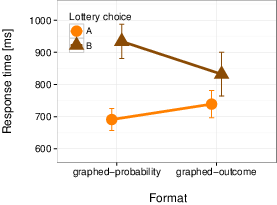
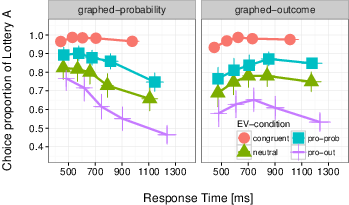
Figure 2: Empirical means in Experiment 1. (A) Choice proportions and
(B) RTs across EV-conditions and presentation formats. (C) RTs for
lottery A and B choices are averaged across EV-conditions. (D)
Conditional choice functions across five quantiles of RT distributions.
Error bars reflect standard errors of means.
A
B
C
D
The remaining data (i.e., 21,798 lottery choices in graphed-probability
and 20,346 choices in graphed-outcome) entered statistical analyses. We
examined effects of EV-conditions and display formats on mean choice
proportions and RTs. Further, we analyzed conditional choice
functions (CCFs), a quantile-based representation of choice
proportions and corresponding RTs across the response time
distribution. Analogous to vincentized conditional accuracy functions
(CAFs, e.g., Dambacher & Hübner, 2015), CCFs were calculated by
sorting the data (according to RTs) into five 20% bins. For each
bin, mean RT and mean choice proportions were computed separately for
each participant and condition. The data points were then averaged
across participants and plotted as choice proportions over RT bins.
Thus, CCFs show changes of choice proportions across the duration of
decisions and therefore provide information about the variability of
risk aversion over RTs. Whereas CAFs are quite common tools to examine
RT distributions, this is, to our knowledge, one of the first gambling
studies that takes advantage from the joint consideration of RTs and
choice proportions in the form of CCFs (Haffke & Hübner, 2015).
We analyzed the CCFs in repeated-measures regressions using the lmList
function of the lme4 package (version 1.1–8; Bates, Mächler, Bolker &
Walker, 2015) and determined the difference of subject-based regression
coefficients from zero via t-tests. The package ggplot2 (Wickham, 2009)
was used to visualize the data. Both packages are embedded in the R
environment for statistical computing (R Core Team, 2015).
2.2 Results
Choice proportions.
Overall, participants chose the safer lottery A (i.e., the lottery with
the higher win probability) more often than lottery B in both the
graphed-probability (75%) and the graphed-outcome format (85%),
confirming risk averse preferences in prospect of positive outcomes
(Tversky & Kahneman, 1992). Figure 2A displays mean choice proportions
across EV-conditions and presentation formats.
Mean choice proportions were analyzed in a two-way ANOVA with
EV-condition (congruent, neutral, pro-prob, pro-out) as within-subject
and presentation format (graphed-probability, graphed-outcome) as
between-subject factors. A significant effect of EV-condition,
F(3,105) = 45.63, p< .001, revealed that —
despite the overall tendency to avoid risk — choice proportions
followed EV differences (see Table 3). The proportion of lottery A
choices gradually decreased from the congruent over the pro-prob and
the neutral EV-condition to the pro-out EV-condition (pairwise
comparisons: all ps< .001).
Table 3: Mean choice proportions of lottery A and RTs (lottery A and B choices combined) across EV-conditions and presentation formats in Experiment 1. Numbers in parentheses reflect standard errors of means.
Choice proportions
RTs (ms)
EV-condition
Graphed-probability
Graphed-outcome
Graphed-probability
Graphed-outcome
congruent
0.97 (0.01)
0.95 (0.01)
663 (30)
771 (42)
neutral
0.70 (0.06)
0.84 (0.05)
791 (42)
832 (48)
pro-prob
0.82 (0.05)
0.87 (0.03)
772 (46)
831 (46)
pro-out
0.52 (0.06)
0.72 (0.05)
815 (40)
887 (51)
mean
0.75 (0.04)
0.85 (0.04)
760 (40)
830 (47)
Further, a trend of presentation format, F(1,35) = 3.10,
p = .087, was qualified by an interaction of EV-condition ×
presentation format, F(3,105) = 5.46, p = .002.
Post-hoc tests revealed that the pro-out EV-condition exhibited more
choices of the greater win probability (lottery A) in the
graphed-outcome compared to the graphed-probability format (p
= .018). The neutral EV-condition yielded a trend in the same direction
(p = .084). Thus, participants were more risk averse when
outcomes rather than probabilities were shown as pie charts. This result
is at odds with the idea that attentional capture enhances the impact
of graphed information, as this would have yielded fewer instead of
more lottery A choices in the graphed-outcome format. Format effects in
the congruent and the pro-prob EV-condition were not significant
(ps> .10).
On average, participants received a bonus of EUR 3.30. The difference of
earned points in the graphed-probability vs. the graphed-outcome format
was not significant (p = .15).
RTs
Mean RTs (Table 3) were analyzed in a two-way ANOVA with EV-condition as
within-subject and presentation format as between-subject factors.
Despite the visual impression in Figure 2B, the main effect of
presentation format was not reliable, F(1,35) = 1.37,
p = .250. However, an almost-significant interaction of
EV-condition × presentation format, F(3,105) = 2.60,
p = .056, pointed to faster RTs for the
graphed-probability than for the graphed-outcome format in congruent
trials (p = .042). No other EV-condition showed a reliable
format effect (all ps> .25).
The main effect of EV-condition, F(3,105) = 40.92, p< .001, revealed an increase of RTs from congruent to pro-out
trials, with RTs to neutral and pro-prob trials in between (Figure 2B).
RTs were faster for trials in which probability and outcome jointly
pointed to the higher EV option relative to trials in which magnitudes
for win probability and outcome were crossed over the lotteries
(congruent vs. neutral and congruent vs. pro-prob: ps< .001). Whereas the difference between the neutral and the
pro-prob EV-condition was not significant (p = .164),
decisions in the pro-out condition entailed the slowest RTs (pro-out
vs. neutral and pro-out vs. pro-prob: ps< .001).
The pattern suggests that outcome-oriented decisions took additional
time in both the graphed-probability and the graphed-outcome format.
This was further supported in a separate analysis of RTs to lottery A
and B choices (Figure 2C). A two-way ANOVA2 on the within-subject factor choice (lottery A or B)
and the between-subject factor presentation format
(graphed-probability, graphed-outcome) yielded slower responses for
lottery B than for lottery A choices, F(1,35) = 32.33,
p< .001. Decisions favoring the high outcome of
lottery B required more time than those opting for the high
probability of lottery A. Presentation format had no reliable
influence, neither as main effect nor in interaction with lottery
choice, Fs< 1.
Conditional choice functions (CCFs).
We examined RT distributions in conditional choice functions (CCFs),
which visualize decision dynamics as choice proportions over RTs (Figure
2D). In the graphed-probability format, repeated-measures regressions
with choice proportions as criterion and EV-condition together with
mean RT of each bin as predictors revealed no reliable differences
between the intercept (congruent) and the main effects of the other
EV-conditions (Table 4). This indicates that a general preference of the
greater win probability is expressed in fast decisions, regardless of
the EV. Further, the variation of choice proportions over RTs was not
significantly different from zero in the congruent (intercept) and the
neutral EV-condition. However, reliable interactions with RT revealed
that the proportion of lottery A choices decreased with longer RTs in
the pro-prob as well as in the pro-out EV-condition. This suggests that
lottery outcomes had a greater impact in slower decisions. Such a trend
is reasonable in the pro-out condition where the greater outcome of
lottery B grants the higher EV. In the pro-prob condition, though, a
decrease of lottery A choices also decreases profitability. Reduced
risk aversion in slower responses therefore did not necessarily
optimize choices.
Table 4: Repeated-measures regressions of lottery A choice proportions over EV-conditions and RTs in the two formats of Experiment 1. Boldface marks significant predictors.
Graphed-probability
Graphed-outcome
Estimate
SE
t-value
p
Estimate
SE
t-value
p
(Intercept)
0.96253
0.01799
53.50
< 0.01
0.96945
0.01564
62.00
< 0.01
RT
0.00002
0.00002
0.97
0.35
–0.00002
0.00003
–0.81
0.43
pro-prob
–0.07028
0.08019
–0.88
0.39
–0.08517
0.07013
–1.21
0.24
neutral
–0.20022
0.10944
–1.83
0.08
–0.11250
0.08154
–1.38
0.19
pro-out
–0.21156
0.12279
–1.72
0.10
–0.17883
0.09545
–1.87
0.08
RT × pro-prob
–0.00016
0.00007
–2.29
0.03
0.00004
0.00007
0.55
0.59
RT × neutral
–0.00015
0.00009
–1.71
0.10
0.00003
0.00008
0.41
0.69
RT × pro-out
–0.00035
0.00010
–3.49
< 0.01
–0.00002
0.00007
–0.36
0.72
Analogous analyses in the graphed-outcome format revealed no significant
differences between the intercept and the other predictors.
Accordingly, Figure 2D illustrates high choice proportions of lottery A
across all EV-conditions and across RTs. Thus, in Experiment 1, a high
and persisting level of risk aversion in the graphed-outcome format
suggests only negligible influences of outcome-oriented information in
the decision.
2.3 Discussion
In line with previous studies, participants in Experiment 1 showed risk
averse preferences. Choice proportions were larger and RTs shorter
for the option with the higher win probability. The data therefore
confirm the finding that preferences show up in both choice proportions
and RTs (Busemeyer & Townsend, 1993; Petrusic & Jamieson, 1978).
Further, decisions were modulated by EV-differences between lottery
pairs. Risk aversion in choice proportions gradually decreased as the
riskier lottery B became more profitable relative to the safer lottery
A. Likewise, RTs were slower when the riskier lottery B was chosen.
Apparently, deviations from the risk averse preference were
associated with additional processing and thus longer decision times in
both the graphed-probability and the graphed-outcome format.
Critically, the results also revealed effects of presentation format.
Risk aversion was stronger in the graphed-outcome compared to the more
common graphed-probability format. This pattern is surprising, because
it contradicts the idea that graphs enhance attentional processing and
therefore augment the impact of associated information (Smerecnik et
al., 2010). Instead, the graphical format reduced the relevance of
outcomes and led participants to rely on the numerical probability
information. Notably, this effect was reliable in the pro-out
EV-condition, where outcome — and not probability — is indicative
for the more profitable option. This suggests that participants had
difficulties in making use of the graphical outcome information, in
line with Fiedler and Unkelbach’s (2011) assumption that outcome
graphs may have detrimental effects when they come with increased
cognitive demands. In fact, the pie charts used in Experiment 1 are
well established as representation of probabilities, but are uncommon
as visualizations of monetary values. Consequently, participants
chose a strategy that focuses on reliable and easily accessible
information, numerical probabilities.
Analyses of CCFs additionally supported this view. In the
graphed-outcome format, we found no variations of choice proportions
over RTs. Risk aversion was comparably strong over the entire RT
distribution, suggesting that increasing decision time was not related
to additional evaluation that affected decisions. In contrast, the
graphed-probability format was characterized by a marked risk aversion
across all EV-conditions, particularly in fast responses. Risk aversion
decreased for slower decisions in the pro-out and pro-prob
EV-condition, suggesting that outcome information was considered more
strongly.
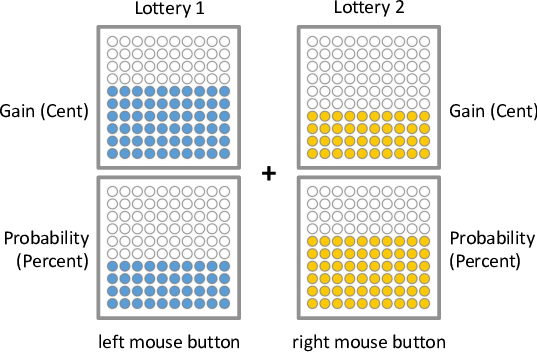
Figure 3: Stimulus example of Experiment 2. Colored points reflect (A)
win probabilities (graphed-probability format) or (B) non-zero outcomes
(graphed-outcome format) of each lottery. Numbers above each graph
reflect (A) non-zero outcomes (graphed-probability format) or (B) win
probabilities (graphed-outcome format). Probabilities and outcomes of a
lottery pair added to 100 percent and 100 points in each trial,
respectively. Presentation format was manipulated between
participants.
A
B
3 Experiment 2
The results of Experiment 1 demonstrate that presentation format has a
reliable effect on risk attitudes. However, against the prediction
that graphs capture attention and enhance the impact of information,
risk aversion increased rather than decreased with graphical outcomes.
We suggested that pie charts are not intuitive means to convey lottery
outcomes. Another variant of graphical representation, though, may
yield a different pattern.
We tested this possibility in Experiment 2 by using icon arrays to
represent lottery probabilities in the graphed-probability format and
lottery outcomes in the graphed-outcome format (Figure 3). Otherwise,
Experiment 2 closely resembled Experiment 1.
3.1 Methods
Participants
Data were assessed at the Universität Konstanz from 21 voluntary
participants in the graphed-probability (13 female, mean age: 24.4 y;
SD: 4.7 y) and from another 20 participants in the graphed-outcome
format (10 female, mean age: 24.6 y; SD: 4.8 y).
Stimuli, task and procedure.
Lottery characteristics, task and procedure were adopted from
Experiment 1 (see Table 1 and 2). Participants again made a total of
1200 choices between lottery pairs A and B. However, graphical
information was presented as icon arrays of colored points (Figure
3). Because the maximum number of points within each lottery option
amounted to 100, the number of colored points was equivalent to the
absolute gain probability in the graphed-probability format and to the
absolute outcome magnitude in the graphed-outcome
format. Non-graphical lottery constituents were presented as
numbers. Outcomes were always shown above probabilities, independent
from format. Additional labels next to the lotteries guarded against
confusion of the constituents.
In all lotteries, characters had a visual angle of approximately
0.46°horizontally and 0.69°vertically. Each icon array had
a visual angle of 12.03°. The distance from the array center to
the fixation cross was 9.17°.
Feedback of the chosen lottery outcome familiarized participants with
the results of their decisions in one practice block. No feedback was
given in the 20 main blocks of 60 trials each. Participants received course
credits or a base payment of 8 EUR, together with a proportional
monetary compensation of their earned points.
Analyses
Excluding trials with RTs faster than 100 ms or slower than 2000 ms
resulted in a total of 24,374 lottery choices in the
graphed-probability format (i.e., drop of 3.3 %) and 23,152 choices in
the graphed-outcome format (i.e., drop of 3.5%). Analogous to
Experiment 1, we examined effects of presentation format and
EV-conditions on mean choice proportions, RTs and conditional choice
functions (CCFs).
Figure 4: Empirical means in Experiment 2. (A) Choice proportions and
(B) RTs across EV-conditions and presentation formats. (C) Separate
choice RTs for lottery A and B are averaged across EV-conditions. (D)
Conditional choice functions across five quantiles of RT distributions.
Error bars reflect standard errors of means.
A
B
C
D
3.2 Results
Choice proportions.
In line with risk averse preferences, participants selected lottery A
more often than lottery B in both the graphed-probability (80%) and
the graphed-outcome format (79%). Choice proportions across
EV-conditions and presentation formats are shown in Figure 4A and Table
5.
Table 5: Mean choice proportions of lottery A and RTs (lottery A and B choices combined) across EV-conditions and presentation formats in Experiment 2. Numbers in parentheses reflect standard errors of means.
Choice proportions
RTs (ms)
EV-condition
Graphed-probability
Graphed-outcome
Graphed-probability
Graphed-outcome
congruent
0.97 (0.01)
0.97 (0.01)
651 (28)
670 (37)
neutral
0.77 (0.06)
0.75 (0.06)
717 (38)
755 (46)
pro-prob
0.86 (0.04)
0.83 (0.05)
735 (46)
760 (47)
pro-out
0.62 (0.06)
0.60 (0.06)
797 (47)
793 (53)
mean
0.80 (0.03)
0.79 (0.03)
723 (38)
743 (45)
A two-way ANOVA on choice proportions with EV-condition (congruent,
neutral, pro-prob, pro-out) as within-subject and presentation format
(graphed-probability, graphed-outcome) as between-subject factors
revealed a significant effect of EV-condition, F(3,117) =
44.41, p< .001. Choice proportions of lottery A
decreased with the relative increase of EVs in lottery B (Table 5): the
proportion of lottery A choices was higher in the congruent than in the
pro-prob EV-condition, in the pro-prob compared to the neutral
EV-condition, as well as in the neutral compared to the pro-out
EV-condition (ps< .001).
Neither presentation format nor the interaction of format × EV-condition
yielded reliable differences in choice proportions (Fs< 1). Thus, the finding of Experiment 1, that outcome graphs
(pie charts) enhance risk aversion, did not generalize to icon arrays.
On average, participants earned 3.33 EUR in Experiment 2. The difference
between the format conditions was not significant (p = .52).
Table 6: Repeated-measures regressions of lottery A choice proportions over EV-conditions and RTs in the two formats of Experiment 2. Boldface marks significant predictors.
Graphed-probability
Graphed-outcome
Estimate
SE
t-value
p
Estimate
SE
t-value
p
(Intercept)
0.98263
0.00989
99.36
<0.01
0.93408
0.03175
29.42
<0.01
RT
–0.00001
0.00002
–0.33
0.74
0.00007
0.00004
1.63
0.12
pro-prob
0.03521
0.04733
0.74
0.47
–0.18269
0.08710
–2.10
0.05
neutral
–0.02907
0.07636
–0.38
0.71
–0.22080
0.07952
–2.78
0.01
pro-out
–0.03116
0.09041
–0.34
0.73
–0.25856
0.09936
–2.60
0.02
RT × pro-prob
–0.00024
0.00005
–4.40
<0.01
0.00008
0.00008
0.99
0.34
RT × neutral
–0.00026
0.00006
–4.04
<0.01
–0.00001
0.00004
–0.28
0.78
RT × pro-out
–0.00043
0.00007
–6.09
<0.01
–0.00012
0.00008
–1.45
0.16
RTs.
Mean RTs (Table 5 and Figure 4B) were analyzed in a two-way ANOVA with
EV-condition as within-subject and presentation format as
between-subject factor. Presentation format had no reliable influence
on RTs, neither as main effect (F< 1) nor in
interaction with EV-condition, F(3,117) = 1.20, p =
.311. However, a strong effect of EV-condition, F(3,117) =
46.81, p< .001, attested an increase in RTs as the
EV of lottery A relative to lottery B decreased (Figure 4B). Accordingly,
RTs were fastest in congruent trials (congruent vs. pro-prob and
congruent vs. neutral: ps< .001) and slowest in
pro-out trials (pro-out vs. pro-prob and pro-out vs. neutral:
ps< .001). The difference between the neutral and
the pro-prob EV-condition was not significant (p = .101). This
pattern confirms our previous finding that an increase of
outcome-oriented choices comes with additional time costs.
The result was substantiated in a separate two-way ANOVA on RTs with the
within-subject factor choice (lottery A or B) and the between-subject
factor presentation format (graphed-probability, graphed-outcome; see
Figure 4C). The main effect of choice, F(1,39) = 48.70,
p< .001, revealed slower RTs for lottery B than for
lottery A choices. Notably, this pattern was qualified by a significant
choice × format interaction, F(1,39) = 9.51, p =
.003, which showed that the RT advantage of lottery A choices was
smaller when outcomes rather than probabilities were presented
graphically. The main effect of format was not significant (F< 1).
Conditional choice functions (CCFs).
CCFs were scrutinized in repeated-measures regressions with mean RTs of
the bins and EV-conditions as predictors. In the graphed-probability
format, coefficients for the EV-conditions did not reliably differ from
the intercept (congruent; see Table 6). Thus, all EV-conditions revealed
a strong preference of the lottery with the greater win probability in
fast decisions (Figure 4D). Further, the main effect of RT was not
reliable, indicating that choice proportions for congruent items did
not substantially vary across RTs. However, significantly negative
slopes in the interaction terms revealed a decrease of lottery A
choices with longer RTs in all other EV-conditions. This is compatible
with the results of Experiment 1, where risk aversion in the
graphed-probability format was particularly strong in fast responses
and dropped for slower decisions. The pattern holds for pro-out and
neutral trials, as well as for pro-prob trials, where the decrease of
lottery A choices comes at the cost of profitability.
CCFs in the graphed-outcome format yielded a different pattern. Here,
differences between the Intercept and the coefficients of the other
EV-conditions revealed a reduced propensity towards higher win
probability: compared to the congruent intercept, regression
coefficients were significantly smaller in the pro-out, the neutral, as
well as the pro-prob EV-condition. Thus, in line with our hypotheses,
the graphical lottery outcome reduced risk aversion in fast decisions.
Notably, variations of choice proportions over time are visually small
(Figure 4D, right panel), and interactions with RTs are not reliable.
3.3 Discussion
With icon arrays as graphical lottery components, we again found strong
risk averse preferences that showed up as larger choice proportions
and faster responses for the option with the higher win probability.
Participants were also sensitive to the EV of lottery pairs. Choice
proportions of the safer lottery A dropped as the relative EV of the
riskier lottery B increased. Analogously, RTs increased as lottery A
became less profitable across EV-conditions. This confirms the finding
of Experiment 1 that a deviation from risk averse preferences comes
with longer decision times.
Concerning format effects, choice proportions yielded no effect. Thus,
we did not replicate the finding of Experiment 1, where graphical
outcomes enhanced risk aversion. This supports our assumption that the
effect resulted from comprehension difficulties of the uncommon
representation of outcome as pie charts. We therefore conclude that
graphical outcomes do not generally increase risk aversion. Notably,
though, displaying outcomes as icon arrays also did not show a
reduction of risk aversion in choice proportions, which would be
expected if graphs increased the impact of outcomes.
Yet, the pattern of RT results indicates some format-driven modulations
of risk attitudes. The RT advantage for choices of the safer option was
smaller when outcomes were presented graphically. It appears that
graphical outcomes facilitated choices of the riskier high-outcome
lottery, suggesting reduced risk aversion in parts of the decision
process.
The finding was corroborated in CCF analyses. As in Experiment 1, the
graphed-probability format revealed strong risk aversion across all
EV-conditions in fast responses. At slower decisions, risk aversion
decreased in the pro-out, neutral, as well as the pro-prob
EV-condition. In contrast, the pattern was different for CCFs in the
graphed-outcome format. Here, significant main effects of the pro-out,
neutral, as well as the pro-prob EV-conditions revealed reduced risk
aversion relative to the intercept at the fastest decisions, and the
absence of interactions with RT shows that this effect was relatively
stable over the entire response time distribution. Thus, RTs and CCFs
in Experiment 2 together point to some reduction of risk aversion in
response to graphical outcomes.
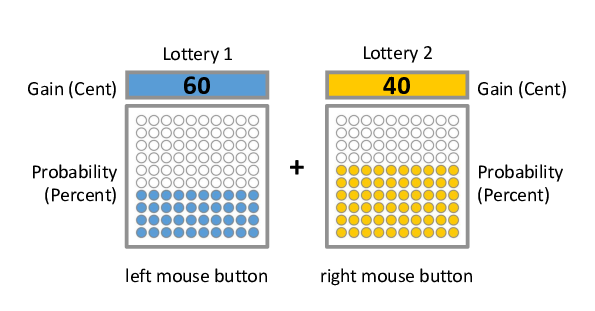
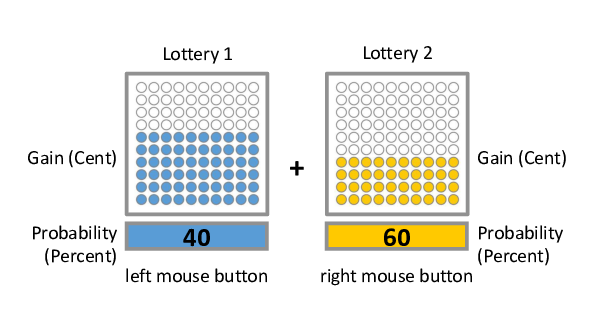
Figure 5: Stimulus example of Experiment 3. Lottery pairs in the
presentation formats (A) all-numeric, (B) all-graphed, (C)
graphed-probability, and (D) graphed-outcome. Presentation format was
manipulated within participants.
A
B
C
D
4 Experiment 3
The previous two experiments varied presentation formats between
participants. Advantageously, this prevents decision makers from
transferring response strategies from one format to another, which
might blur specific effects. As a flipside, it remains unclear whether
and how preferences change when the same participants are faced with
different formats. Two open questions therefore are: Would graphical
outcomes reduce risk aversion when participants have experience with
other graphical and numerical constellations? And does the dominance of
risk aversion in rapid decisions generalize across formats that are
exposed to the same participants?
We addressed these questions in Experiment 3, where we manipulated
presentation formats within participants. Further, we increased the
number of formats by fully crossing lottery components (probability,
outcome) and presentation format (numerical, graphical). Thus, in
addition to the graphed-probability and the graphed-outcome format of
the previous experiments, we introduced an all-numeric and an
all-graphed format, in which both probabilities and outcomes were
presented as numbers and graphs, respectively. Graphical components
were again represented by icon arrays (see Experiment 2), but due to the
higher number of formats, we implemented only two EV-conditions
(pro-prob and pro-out).
Despite these changes, we expected (1) overall risk averse preferences
in choice proportions and RTs, (2) reduced risk aversion in the
graphed-outcome format, and (3) at least in the graphed-probability
format, stronger risk aversion in fast compared to slower decisions.
4.1 Methods
Participants.
A total of 52 voluntary participants were recruited at the Universität
Konstanz. Data from four participants were excluded, because they did
not comply with task instructions or did not wear their vision aids
during the experiment. Hence, data from 48 participants (33 female,
mean age: 23.4 y; SD: 5.9 y) entered statistical analyses.
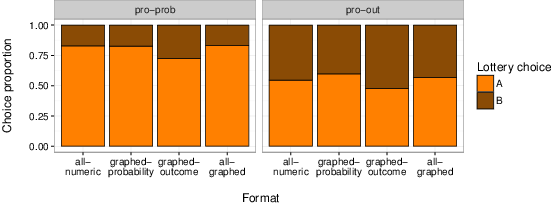
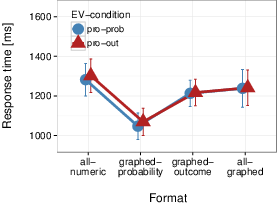
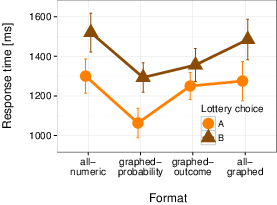
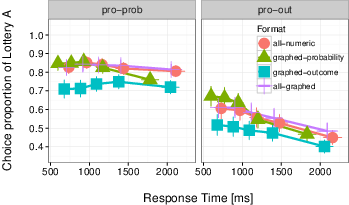
Figure 6: Empirical means in Experiment 3. (A) Choice proportions and
(B) RTs across EV-conditions and presentation formats. (C) Separate
choice RTs for lottery A and B are averaged across EV-conditions. (D)
Conditional choice functions across five quantiles of RT distributions.
Error bars reflect standard errors of means.
A
B
C
D
Task and stimuli.
The task closely resembled Experiment 2. Participants made a total of
1056 choices between pairs of lotteries A and B. Different from the
previous presentation formats, graphed (i.e., icon arrays) and
numerical probabilities and outcomes were fully crossed within
participants. In particular, each participant made 264 lottery
choices in each of four presentation formats (Figure 5): all-numeric
(i.e., numerical probability and outcome), graphed-probability
(together with numerical outcome), graphed-outcome (together with
numerical probability), and all-graphed (i.e., graphical probability
and outcome). The graphed-probability and the graphed-outcome format
were therefore very similar to those of Experiment 2, but now varied
within the same participants. Presentation formats were blocked and
their sequence was counterbalanced across the 48 participants.
As in the previous experiments, probabilities as well as outcomes of
lottery A and B in each pair summed up to 100 percent and points (Euro
cents), respectively. However, probabilities and outcomes now featured
a greater variability than in Experiments 1 and 2. In lottery A, gain
probabilities took values between 59% and 91%, and outcome
magnitudes between 49 points and 1 point. Accordingly, probabilities
in lottery B varied between 41% and 9%, and outcomes between 51 and
99 points. Lottery A and B pairs set up two EV-conditions: in the
pro-prob condition, EVs were higher in lottery A, whereas in the
pro-out condition, they were higher in lottery B. Additionally, the
difference between EVs in lottery A and B was manipulated in two
levels (low, high). However, this factor revealed no interactions with
presentation format and is therefore not further pursued here.
Lottery characters had a visual angle of 0.46°horizontally and
0.69°vertically. Icon arrays extended to a visual angle of
12.03°. The distance from the array center to the fixation cross
was 9.17°.
Procedure.
The experiment was divided into four blocks, in which the lotteries were
sequentially presented in the four formats. At the beginning of each
block, 13 practice trials familiarized participants with the new
format, and feedback informed about the outcome of the selected
lottery. In the following 264 main trials of each block, no feedback
was given. Participants took a short break between blocks and after
half of the trials in each block.
Participants received course credits or a base payment of five Euros,
and in addition, the summed outcome of 24 randomly selected trials.
Accordingly, lottery outcomes in Experiment 3 symbolized Euro cents.
Analyses.
Compared to the previous experiments, RTs were slower in Experiment 3.
Outlier criteria were therefore adjusted, so that RTs faster than 100
ms or slower than 4000 ms were excluded. This resulted in a total of
48,524 lottery choices with a drop of 5.6% in the all-numeric, 2.2%
in the graphed-probability, 3.5% in the graphed-outcome format, and
5.8% in the all-graphed format. We examined effects of presentation
formats and EV-conditions on choice proportions, RTs and conditional
choice functions (CCFs).
4.2 Results
Choice proportions.
Overall greater choice proportions of the lottery with the higher win
probability (68 % lottery A choices) confirmed risk averse
preferences. Choice proportions across EV-conditions and presentation
formats are listed in Table 7 (see also Figure 6A).
Table 7: Mean choice proportions of lottery A and RTs (lottery A and B choices combined) across EV-conditions and presentation formats in Experiment 3. Numbers in parentheses reflect standard errors of means.
Choice proportions
RTs (ms)
Format
Pro-prob
Pro-out
Pro-prob
Pro-out
all-numeric
0.83 (0.03)
0.55 (0.05)
1282 (82)
1302 (85)
graphed-probability
0.83 (0.03)
0.60 (0.05)
1047 (67)
1069 (69)
graphed-outcome
0.73 (0.04)
0.48 (0.05)
1213 (66)
1217 (67)
all-graphed
0.83 (0.03)
0.57 (0.05)
1238 (95)
1241 (90)
mean
0.80 (0.02)
0.55 (0.02)
1179 (62)
1189 (61)
A two-way ANOVA on choice proportions with EV-condition (pro-prob,
pro-out) and presentation format (all-numeric, all-graphed,
graphed-probability, graphed-outcome) as within-subject factors yielded
a significant effect of EV-condition, F(1,47) = 39.64,
p< .001. Higher choice proportions of lottery A in
the pro-prob than in the pro-out EV-condition (Table 7) showed that
participants were sensitive to the EV manipulation.
There was no interaction of EV-condition and presentation format,
F(3,141) = 1.53, p = .209. However, the main effect
of presentation format was significant, F(3,141) = 5.56,
p = .001. Pairwise comparisons of the four formats revealed
that choice proportions of lottery A were lower in the graphed-outcome
relative to the remaining formats (all ps< .01).
Differences of choice proportions between all other formats
(all-numeric, graphed-probability, all-graphed) were not reliable (all
ps> .40). Thus, graphical lottery outcomes
together with numerical probabilities was the only format that reduced
risk aversion in choice proportions. This reduction was independent
from EV-condition, although fewer choices of lottery A were only
profitable in pro-out, but not in pro-prob trials.
Notably, the graphed-outcome format also yielded the highest gain (Euro
cents) across all trials (i.e., not the actual payoff, where only a
subset of trials was selected). On average, the overall gain per
participant in the graphed-outcome format amounted to 48.44 EUR, which
was significantly higher than the gain in the graphed-probability
(46.67 EUR, p = .037) and the all-graphed (45.74 EUR,
p = .002) format. The difference to the all-numeric (47.16
EUR, p = .248) format as well as differences between the other
formats were not reliable (ps> .19).
Table 8: Repeated-measures regressions of lottery A choice proportions over EV-conditions and RTs in the four formats of Experiment 3. Boldface marks significant predictors.
Estimate
SE
t-value
p
(Intercept)
0.86700
0.04870
17.80
<0.01
RT
–0.00005
0.00004
–1.45
0.15
Pro-out
-0.16100
0.05960
–2.71
0.01
graphed-probability
0.04770
0.05360
0.89
0.38
Graphed-outcome
–0.13900
0.04020
–3.47
<0.01
all-graphed
–0.00405
0.03780
–0.11
0.92
RT × pro-out
–0.00010
0.00003
–3.56
<0.01
RT × graphed-probability
–0.00008
0.00005
–1.71
0.09
RT × graphed-outcome
0.00005
0.00004
1.45
0.15
RT × all-graphed
0.00002
0.00004
0.55
0.59
pro-out × graphed-probability
0.03680
0.04030
0.91
0.37
pro-out × graphed-outcome
0.02480
0.04860
0.51
0.61
pro-out × all-graphed
–0.01810
0.03280
–0.55
0.58
RT × pro-out × graphed-probability
–0.00004
0.00003
–1.13
0.27
RT × pro-out × graphed-outcome
0.00001
0.00004
0.38
0.71
RT × pro-out × all-graphed
0.00001
0.00003
0.46
0.65
RTs.
Mean RTs (Table 7 and Figure 6C) were analyzed in a two-way ANOVA with
EV-condition and presentation format as within-subject factors.
EV-condition had no reliable influence, neither as main effect nor in
interaction with presentation format (Fs< 1).
However, a significant main effect of presentation format,
F(3,117) = 3.92, p = .010, revealed that RTs were
faster in the graphed-probability than in all other formats (pairwise
comparisons: all ps< 0.01). RT differences between
the all-numeric, the graphed-outcome, and the all-graphed format were
not significant (pairwise comparisons: all ps>
0.34). Thus, the within-subject design of Experiment 3 augments the
results from Experiments 1 and 2 where RT advantages of the
graphed-probability format showed only up in numerical trends. This
suggests that graphic probabilities together with numerical outcomes
reflect a highly intuitive format for risky decision making.
RTs for choices of lottery A and B were further examined in a separate
two-way ANOVA with the within-subject factors choice (lottery A or B)
and presentation format (all-numeric, graphed-probability,
graphed-outcome, all-graphed) (Figure 6B). The main effect of choice,
F(1,47) = 11.99, p = .001, revealed slower RTs for
lottery B than for lottery A choices. Further, a significant effect of
presentation format confirmed the result of fastest RTs in the
graphed-probability format, F(3,141) = 4.082, p =
.008. The interaction of choice × presentation format was not
significant, F(3,141) = 1.88, p = .137, but
exploratory post-hoc tests within each presentation format confirmed
the visual impression of Figure 6B that the marked RT advantage of
lottery A in the all-numeric (p = .001), the
graphed-probability (p< .001), and the all-graphed
format (p = .012), is somewhat attenuated in the
graphed-outcome format (p = .072).
Conditional choice functions (CCFs).
CCFs were analyzed in repeated-measures regressions with mean RTs in the
bins, EV-conditions, and presentation format as within-subject
predictors (Figure 6D). Relative to the intercept (i.e., pro-prob
EV-condition in the all-numeric format), Table 8 reveals three
significant effects. First, the pro-out EV-condition exhibits less
lottery A choices. Second, a format-related decrease of risk averse
choices is present only in the graphed-outcome format, whereas effects
of the graphed-probability and the all-graphed format are not
significant. Third, the RT × pro-out interaction reveals that lottery A
choices in the pro-out condition decrease with longer decision times
across all formats, whereas the RT-dependent variation in the pro-prob
EV-condition was not reliable and yielded only a trend for the
interaction of RT × graphed-probability format.
4.3 Discussion
As in the previous experiments, we observed risk averse
preferences in choice proportions and RTs. Overall, the safer lottery A
was chosen more often and more rapidly than the riskier lottery B. Yet,
choice proportions were also related to profitability: the riskier
lottery B was selected more frequently in the pro-out than in the
pro-prob EV-condition, indicating that participants took lottery
outcome into account in all presentation formats. The safer lottery A
also yielded faster RTs than lottery B, but compared to Experiments 1
and 2, RTs were overall considerably slower. We speculate that this was
a consequence of the within-subject design in Experiment 3, where
changes of presentation formats may have reduced response routines and
encouraged participants to spend more time on decisions.
Importantly, we also found clear format effects. Relative to all other
presentation formats, choice proportions of the riskier lottery B were
higher in the graphed-outcome format. This is in line with the
hypothesis that graphs can enhance the impact of outcomes and hence
increase risk taking. Indeed, presenting outcomes as icon arrays
together with probabilities as numbers was the only format that reduced
risk aversion in choice proportions. This effect was observed across
EV-conditions, despite the fact that an increase of lottery B choices
was profitable only in pro-out, but not in pro-prob trials. We
therefore suggest that the reduction of risk aversion is due to the
higher visual salience, and hence an attentional advantage of graphical
outcomes relative to numerical probabilities (Smerecnik et al., 2010).
In addition to salience, though, icon arrays hold the necessary
accessibility to reflect outcomes (in contrast to pie-charts in Experiment
1). Although the increase of risk taking in the pro-prob EV-condition
reduced profitability, the graphed-outcome format yielded the highest
overall gain compared to the other formats. This supports our claim
that the reduction of risk aversion through an adequate presentation
format can optimize the profit of risky decisions.
The effects on choice proportions are neatly summarized in the CCF
regressions. Significant main effects attested to reduced risk aversion
across EV-conditions in the graphed-outcome format, as well as across
all formats in the pro-out EV-condition. In addition, the interaction
of RT with the pro-out EV-condition demonstrates a decrease of risk
aversion with increasing decision time. Risk aversion is again dominant
in fast decisions and declines with RT. Interestingly, however, this
effect now generalized across all presentation formats, whereas similar
dynamics of risk aversion in Experiments 1 and 2 showed up only in the
graphed-probability format. We assume that the repeated exposure to
different formats in the within-subject design of Experiment 3 has
caused strategy transfers and training effects between the formats.
Yet, over all three experiments our CCF analyses consistently show that
risk attitudes can change with RTs, attesting the value of examining
decision dynamics.
Finally, presentation format also affected RTs, which were fastest in
the graphed-probability format. This effect substantiates analogous
numerical trends in Experiments 1 and 2. Together, the patterns
indicate that deciding between risky options is easiest when
probabilities are shown as graphs, and outcomes as numbers. A plausible
reason is that this format is a common visualization of risky choices,
such that its familiarity facilitates decisions.
5 General discussion
Risk aversion — the preference of the safer choice option despite a more
lucrative riskier alternative — is a well-established phenomenon in
decision making (K. Fiedler & Unkelbach, 2011; Holt & Laury, 2002;
Kahneman & Tversky, 1984), which can lead to over-conservative choices
that are suboptimal for the maximization of decision outcomes. Because
of potential benefits from more risk taking, the identification of
factors influencing individual risk preferences without manipulating
the content of the choice options is of great interest. One plausible
idea to reduce risk aversion is to modulate the format of risky
information in a way that increases the impact of outcomes relative to
that of probabilities.
The present study addressed this issue and investigated effects of
presentation format on risk aversion in three gambling experiments.
Participants repeatedly chose between two lotteries with non-negative
prospects, and we varied whether either probabilities or outcomes (Experiment
1–3), or both (Experiment 3) were presented in a numerical or a graphical
format. The rationale was that increased attention to salient graphical
outcomes may encourage decisions towards riskier options with higher
outcomes.
Despite a marked risk aversion with higher choice proportions and
shorter RTs for the safer lottery in all experiments, the results of
Experiment 3 confirmed that graphical outcomes can decrease risk
aversion. Yet, not all graphs are suitable in this respect, and the
choice of non-intuitive graphs can even lead to the opposite effect
(Experiment 1). Further, concerning decision dynamics, we found strongest
risk averse preferences in fast responses, especially when risk
information was presented graphically (Experiment 1 and 2); at slower
responses, risk aversion declined. We discuss these results in more
detail in the following.
5.1 Graphs vs. numbers
Prior research indicated that the presentation format can influence
choices between risky options. Specifically, presenting probabilities
as graphs instead of numbers enhanced risk aversion, an effect that
has been attributed to the higher salience of graphs, which attracts
attention. The resulting processing advantage increases the influence
of graphical information on the decision (Chua et al., 2006;
K. Fiedler & Unkelbach, 2011; Smerecnik et al., 2010).
It is therefore tempting to assume that the direction of this effect can
be reversed. Presenting outcomes instead of probabilities as graphs
should then enhance attention towards outcomes and therefore increase
choices of riskier options. However, Fiedler and Unkelbach (2011)
reasoned that the advantage of graphed outcomes is weak and can even
turn into a disadvantage as graphical outcomes may increase cognitive
demands.
Indeed, this is what we observed in Experiment 1. While pie chart
probabilities yielded strong risk aversion, presenting outcomes as pie
charts enhanced rather than reduced risk aversion. In line with Fiedler
and Unkelbach’s prediction, we reasoned that pie charts are uncommon
and non-intuitive outcome representations and are therefore hard to
evaluate. As a consequence, decision makers relied on the accessible —
and in this case numerical — probability information, which resulted in
preferences for the safer options. However, the increase of risk
aversion through pie-chart outcomes does not necessarily generalize to
other graphical formats.
We therefore used icon arrays as graphs in two additional experiments.
The results in Experiment 2 were mixed. Choice proportions did not
reveal a format effect, but a reduced RT advantage for safer lotteries
suggested some facilitation of risky choices when outcomes were
presented as graphs. Clear evidence for reduced risk aversion was
found in Experiment 3 where risky choices were more frequent in the
graphed-outcome compared to three other formats. Notably, choice
proportions did not differ when both outcomes and probabilities were
shown graphically or numerically, so that the reduction of risk
aversion was driven by the specific combination of graphical outcomes
with less salient numerical probabilities.
Our results thus confirm that certain graphical outcomes can attenuate,
albeit not eliminate, risk aversion. This finding is not trivial
considering previous reports of choice insensitivity to different
formats (Birnbaum et al., 2008; Birnbaum, 2004, 2006) as well as the
increase of risk aversion due to graphical outcomes in Experiment 1.
The present study therefore unveils possibilities and limits of
format-related modulations of risk attitudes. We used pie charts and
icon arrays as two common graphical formats for risky decisions.
Obviously, though, there are countless other formats, some of which may
well be better suited to reduce risk aversion. Consequently, a
systematic investigation of the visual features of graphical formats
would be a desirable next step to further guide this research. For
instance, psychophysical methods could help to assess how distinct
salience parameters of graphs translate into subjective representations
of outcomes and probabilities.3 The usage of eye tracking could additionally
inform about attentional processes. The resulting evidence about the
role of stimulus format may eventually advance models of decision
making.
5.2 Correlates of risk aversion
In addition to the demonstration of format effects, our study enriches
the landscape of correlates of risk preferences. Risk aversion, usually
assessed via choice proportions, is reflected in more choices of the
safer option (Holt & Laury, 2002; Kahneman & Tversky, 1984). Also in
our experiments we observed a marked risk aversion in choice
proportions across all conditions. Overall, participants selected the
safer lottery in around 75% of the trials, and even in trials
featuring a higher EV for the riskier lottery (i.e., pro-out
EV-condition), participants opted for the safer alternative in 58% of
all choices. Risk averse preferences were also reflected in RTs.
Faster responses for the safer lottery indicated that decisions
following the higher win probability were easier than those relying on
the higher outcomes of the riskier lottery (Rubinstein, 2013).
This observation is in line with previous findings of shorter RTs for
preferred choice options (Busemeyer & Townsend, 1993; Busemeyer, 2015;
Jamieson & Petrusic, 1977; Petrusic & Jamieson, 1978).
Going beyond the separate examination of RTs and choice proportions, we
considered the two measures jointly in conditional choice functions
(CCFs; Haffke & Hübner, 2015). Clearly, CCFs permit no inferences
about causal relationships between RTs and choice proportions, but they
inform about the dynamics of risk preferences and, in the present
study, revealed that risk aversion varies with RTs. When probabilities
were presented graphically in Experiments 1 and 2, choice preferences
for the safer option were particularly expressed in fast responses,
irrespective of lottery EVs, whereas risk aversion was lower for slower
decisions. This decline was not restricted to the pro-out condition,
where the riskier lottery offered the higher EV. The same trend was
observed in the pro-prob condition, where profitability was actually
reduced when risk aversion dropped. Thus, slower decisions in
Experiments 1 and 2 did not necessarily increase profitability.
This may seem surprising, because longer RTs are often associated with
controlled information processing and hence expected to result in
better decisions. However, this conclusion is problematic since slower
responses can also result from low preferences or low discriminability
between options (Krajbich, Bartling, Hare & Fehr, 2015).
Nevertheless, the dynamics in the CCFs are informative, and decision
theories may capture the expressed risk aversion at fast RTs as a
response bias that leads to a selection advantage of the safer option.
For instance, models of evidence accumulation assume that, for binary
choices, stimulus information is accumulated over time until one of two
response criteria (i.e., one for each option) is reached and the
associated response is initiated (e.g., Ratcliff & McKoon, 2008;
Ratcliff, 1978). Response biases occur if one of the criteria is closer
to the initial level of evidence at the beginning of the accumulation
process (e.g., through a shift of the starting point of evidence
accumulation or through asymmetric response criteria). In risky
decisions, such a bias towards the criterion for the safer option would
lead to a greater proportion of safe lottery choices especially at fast
RTs — i.e., the pattern we observed in the graphed-probability format
of Experiments 1 and 2 (Mulder, Wagenmakers, Ratcliff, Boekel &
Forstmann, 2012). Response biases may therefore contribute to the
impression of sometimes automatic-intuitive characteristics of risky
decisions (S. Fiedler & Glöckner, 2012).
Interestingly, in the graphed-outcome format of Experiments 1 and 2, the
CCFs revealed no variation of choice proportions over RTs. With pie
charts (Experiment 1), risk aversion remained high even for slow responses.
With icon arrays in (Experiment. 2), risk aversion was reduced already at fast
decisions. The graphed-outcome format therefore yielded rather stable
preferences across RTs, consistent with a reduced response bias in the
context of evidence accumulation.
In comparison, CCFs in Experiment 3 revealed a decrease of risk aversion
with longer RTs in all presentation formats within the pro-out
EV-condition. Thus, also the graphed-outcome format showed expressed —
and perhaps biased — risk aversion under rapid responses. Yet, this
fast trend was absent in the pro-prob EV-condition. Overall, decisions
in Experiment 3 therefore became more profitable with increasing RTs. A
potential reason for this difference to Experiments 1 and 2 is that
repeated exposure to different presentation formats in the
within-subject design of Experiment 3 enabled participants to gain
experience with the formats and to transfer response strategies that
supported the optimization of decisions. Indeed, the reduction of risk
aversion in the graphed-outcome format increased the overall gains of
participants.
In summary, this study shows that choice proportions and RTs as well as
their combination (CCFs) reflect useful correlates of risk preferences,
which provide unique information. So far, psycho-economic studies often
base their conclusions on choice proportions and provide no or only
superficial RT analyses (e.g., Demaree, Burns, Dedonno, Agarwala &
Everhart, 2012; Dong, Lin, Zhou & Du, 2014; Glöckner, Fiedler,
Hochman, Ayal & Hilbig, 2012; Hertwig et al., 2004; Holt & Laury,
2002; Pachur, Hertwig, Gigerenzer & Brandstätter, 2013; Payne &
Braunstein, 1978). One plausible reason is, of course, that RT
recording is not always practical, as for instance in paper-pencil
experiments. However, RT measures may sometimes also be omitted because
they seem not to be of interest. Our results argue against this view as
they show that RTs and CCFs can augment the understanding decision
dynamics.
6 Conclusions
The present results demonstrate that graphical representations of
lottery outcomes can reduce risk aversion. We propose that this effect
is due to the greater salience of graphs, which attracts attention to
larger outcomes and therefore increases the readiness to opt for
riskier choices. Non-intuitive formats, though, can yield the opposite
effect. Thus, our findings support the view that information format in
risky decisions is a non-trivial factor, which deserves further
investigation.
References
Alós-Ferrer, C., Granić, Đ.-G., Kern, J., & Wagner, A. K. (2016).
Preference reversals: Time and again. Journal of Risk and
Uncertainty, 52, 65–97. http://dx.doi.org/10.1007/s11166-016-9233-z
Ancker, J. S., Senathirajah, Y., Kukafka, R., & Starren, J. B. (2006).
Design features of graphs in health risk communication: A systematic
review. Journal of the American Medical Informatics
Association, 13(6), 608–618. http://dx.doi.org/10.1197/jamia.M2115
Armel, K. C., Beaumel, A., & Rangel, A. (2008). Biasing simple choices
by manipulating relative visual attention. Judgment and
Decision Making, 3(5), 396–403.
Awh, E., Belopolsky, A. V., & Theeuwes, J. (2012). Top-down versus
bottom-up attentional control: A failed theoretical dichotomy.
Trends in Cognitive Sciences, 16(8), 437–443.
http://dx.doi.org/10.1016/j.tics.2012.06.010
Bates, D., Mächler, M., Bolker, B., & Walker, S. (2015). Fitting linear
mixed-effects models using lme4. Journal of Statistical
Software, 67(1). http://dx.doi.org/10.18637/jss.v067.i01
Birnbaum, M. H. (2004). Tests of rank-dependent utility and cumulative
prospect theory in gambles represented by natural frequencies: Effects
of format, event framing, and branch splitting. Organizational
Behavior and Human Decision Processes, 95, 40–65.
http://dx.doi.org/10.1016/j.obhdp.2004.05.004
Birnbaum, M. H. (2006). Evidence against prospect theories in gambles
with positive, negative, and mixed consequences. Journal of
Economic Psychology, 27(6), 737–761.
http://dx.doi.org/10.1016/j.joep.2006.04.001
Birnbaum, M. H., Johnson, K., & Longbottom, J.-L. (2008). Tests of
Cumulative Prospect Theory with graphical displays of probability.
Judgment and Decision Making, 3(7), 528–546.
Bodemer, N., & Gaissmaier, W. (2012). Risk communication in health. In
S. Roeser, R. Hillerbrand, P. Sandin, & M. Peterson (Eds.),
Handbook of Risk Theory: Epistemology, Decision Theory, Ethics,
and Social Implications of Risk (2nd ed., pp. 621–660). Dordrecht:
Springer.
Busemeyer, J. R., & Townsend, J. T. (1993). Decision Field Theory: A
dynamic-cognitive approach to decision making in an uncertain
environment. Psychological Review, 100(3), 432–459.
Chua, H. F., Yates, J. F., & Shah, P. (2006). Risk avoidance: Graphs
versus numbers. Memory and Cognition, 34(2), 399–410.
Dambacher, M., & Hübner, R. (2015). Time pressure affects the
efficiency of perceptual processing in decisions under conflict.
Psychological Research, 79(1), 83–94.
http://dx.doi.org/10.1007/s00426-014-0542-z
Demaree, H. A., Burns, K. J., Dedonno, M. A., Agarwala, E. K., &
Everhart, D. E. (2012). Risk dishabituation: In repeated gambling, risk
is reduced following low-probability “surprising” events (wins or
losses). Emotion, 12(3), 495–502.
http://dx.doi.org/10.1037/a0025780
Diederich, A. (2003). Decision making under conflict: Decision time as a
measure of conflict strength. Psychonomic Bulletin and Review,
10(1), 167–176.
Dong, G., Lin, X., Zhou, H., & Du, X. (2014). Decision-making after
continuous wins or losses in a randomized guessing task: Implications
for how the prior selection results affect subsequent decision-making.
Behavioral and Brain Functions, 10(1), 11.
http://dx.doi.org/10.1186/1744-9081-10-11
Fehr-Duda, H., & Epper, T. (2012). Probability and risk: Foundations
and economic implications of probability-dependent risk preferences.
Annual Review of Economics, 4(1), 567–593.
http://dx.doi.org/10.1146/annurev-economics-080511-110950
Fiedler, K., & Unkelbach, C. (2011). Lottery attractiveness and
presentation mode of probability and value information. Journal
of Behavioral Decision Making, 24(1), 99–115.
http://dx.doi.org/10.1002/bdm.685
Fiedler, S., & Glöckner, A. (2012). The dynamics of decision making in
risky choice: An eye-tracking analysis. Frontiers in
Psychology, 3, 335. http://dx.doi.org/10.3389/fpsyg.2012.00335
Gaissmaier, W., Wegwarth, O., Skopec, D., Müller, A.-S., Broschinski,
S., & Politi, M. C. (2012). Numbers can be worth a thousand pictures:
Individual differences in understanding graphical and numerical
representations of health-related information. Health
Psychology, 31(3), 286–296. http://dx.doi.org/10.1037/a0024850
Glöckner, A., Fiedler, S., Hochman, G., Ayal, S., & Hilbig, B. E.
(2012). Processing differences between descriptions and experience: A
comparative analysis using eye-tracking and physiological measures.
Frontiers in Psychology, 3, 173.
http://dx.doi.org/10.3389/fpsyg.2012.00173
Glöckner, A., & Pachur, T. (2012). Cognitive models of risky choice:
Parameter stability and predictive accuracy of prospect theory.
Cognition, 123(1), 21–32.
http://dx.doi.org/10.1016/j.cognition.2011.12.002
Grether, D. M., & Plott, C. R. (1979). Economic theory of choice and
the preference reversal phenomenon. American Economic Review,
69(4), 623–638.
Haffke, P., & Hübner, R. (2015). Effects of different feedback types on
information integration in repeated monetary gambles. Frontiers
in Psychology, 5, 1597. http://dx.doi.org/10.3389/fpsyg.2014.01597
Hertwig, R., Barron, G., Weber, E. U., & Erev, I. (2004). Decisions
from experience and the effect of rare events in risky choice.
Psychological Science, 15(8), 534–539.
http://dx.doi.org/10.1111/j.0956-7976.2004.00715.x
Hey, J. D., & Orme, C. (2014). Investigating generalizations of
expected utility theory using experimental data. Econometrica,
62(6), 1291–1326.
Itti, L., & Koch, C. (2001). Computational modelling of visual
attention. Nature Reviews Neuroscience, 2(3),
194–203. http://dx.doi.org/10.1038/35058500
Jamieson, D. G., & Petrusic, W. M. (1977). Preference and the time to
choose. Organizational Behavior and Human Performance,
19(1), 56–67. http://dx.doi.org/10.1016/0030-5073(77)90054-X
Kahneman, D. (2003). Maps of bounded rationality: Psychology for
behavioral economics. The American Economic Review,
93(5), 1449–1475.
Kahneman, D., & Tversky, A. (1984). Choices, values, and frames.
American Psychologist, 39, 341–350.
Krajbich, I., Armel, C., & Rangel, A. (2010). Visual fixations and the
computation and comparison of value in simple choice. Nature
Neuroscience, 13(10), 1292–1298. http://dx.doi.org/10.1038/nn.2635
Krajbich, I., Bartling, B., Hare, T., & Fehr, E. (2015). Rethinking
fast and slow based on a critique of reaction-time reverse inference.
Nature Communications, 6, 7455.
http://dx.doi.org/10.1038/ncomms8455
Lipkus, I. M., & Hollands, J. G. (1999). The visual communication of
risk. Journal of the National Cancer Institute Monographs,
25, 149–163.
Mishra, S. (2014). Decision-making under risk: Integrating perspectives
from biology, economics, and psychology. Personality and Social
Psychology Review, 18(3), 280–307.
http://dx.doi.org/10.1177/1088868314530517
Mulder, M. J., Wagenmakers, E.-J., Ratcliff, R., Boekel, W., &
Forstmann, B. U. (2012). Bias in the brain: A diffusion model analysis
of prior probability and potential payoff. Journal of
Neuroscience, 32(7), 2335–2343.
http://dx.doi.org/10.1523/JNEUROSCI.4156-11.2012
Orquin, J. L., & Mueller Loose, S. (2013). Attention and choice: A
review on eye movements in decision making. Acta Psychologica,
144(1), 190–206. http://dx.doi.org/10.1016/j.actpsy.2013.06.003
Pachur, T., Hertwig, R., Gigerenzer, G., & Brandstätter, E. (2013).
Testing process predictions of models of risky choice: A quantitative
model comparison approach. Frontiers in Psychology,
4, 646. http://dx.doi.org/10.3389/fpsyg.2013.00646
Payne, J. W., & Braunstein, M. L. (1978). Risky choice: An examination
of information acquisition behavior. Memory and Cognition,
6(5), 554–561. http://dx.doi.org/10.3758/BF03198244
Petrusic, W. M., & Jamieson, D. G. (1978). Relation between probability
of preferential choice and time to choose changes with practice.
Journal of Experimental Psychology: Human Perception and
Performance, 4(3), 471–482. http://dx.doi.org/10.1037/0096-1523.4.3.471
R Core Team. (2015). R: A language and environment for statistical
computing. Vienna, Austria: R Foundation for Statistical Computing.
Ratcliff, R. (1978). A theory of memory retrieval. Psychological
Review, 85(2), 59–108.
Ratcliff, R., & McKoon, G. (2008). The diffusion decision model: Theory
and data for two-choice decision tasks. Neural Computation,
20(4), 873–922. http://dx.doi.org/10.1162/neco.2008.12-06-420
Rieskamp, J. (2008). The probabilistic nature of preferential choice.
Journal of Experimental Psychology: Learning, Memory, and
Cognition, 34(6), 1446–1465. http://dx.doi.org/10.1037/a0013646
Rubinstein, A. (2013). Response time and decision making: An
experimental study. Judgment and Decision Making, 8,
540–551.
Smerecnik, C. M. R., Mesters, I., Kessels, L. T. E., Ruiter, R. A. C.,
De Vries, N. K., & De Vries, H. (2010). Understanding the positive
effects of graphical risk information on comprehension: Measuring
attention directed to written, tabular, and graphical risk information.
Risk Analysis, 30(9), 1387–1398.
http://dx.doi.org/10.1111/j.1539-6924.2010.01435.x
Smith, B. W., Mitchell, D. G. V., Hardin, M. G., Jazbec, S., Fridberg,
D., Blair, R. J. R., & Ernst, M. (2009). Neural substrates of reward
magnitude, probability, and risk during a wheel of fortune
decision-making task. Neuroimage, 44(2), 600–609.
http://dx.doi.org/10.1016/j.neuroimage.2008.08.016
Tversky, A., & Kahneman, D. (1992). Advances in prospect theory:
Cumulative representation of uncertainty. Journal of Risk and
Uncertainty, 5(4), 297–323. http://dx.doi.org/10.1007/BF00122574
Usher, M., & McClelland, J. L. (2004). Loss aversion and inhibition in
dynamical models of multialternative choice. Psychological
Review, 111(3), 757–769. http://dx.doi.org/10.1037/0033-295X.111.3.757
Visschers, V. H. M., Meertens, R. M., Passchier, W. W. F., & de Vries,
N. N. K. (2009). Probability information in risk communication: A
review of the research literature. Risk Analysis,
29(2), 267–287. http://dx.doi.org/10.1111/j.1539-6924.2008.01137.x
Wickham, H. (2009). ggplot2: Elegant graphics for data
analysis. New York: Springer.
Wölbert, E., & Riedl, A. (2013). Measuring time and risk
preferences: Reliability, stability, domain specificity.
CESifo Working Paper Series (Vol. 4339).
Department
of Neuroscience, Pyschology and Behaviour, University of Leicester, University Road, LE1 7RH, UK.
Phone: +44 (0)116 229 7128. Email: md365@leicester.ac.uk.
Graduate School of Decision Sciences, Universität Konstanz, Germany.
This research was supported by the German Research Foundation (DFG)
through research unit FOR 1882 Psychoeconomics. We thank
Marina Köpfer for data acquisition in Experiment 3.
By convention, we call the gamble with the higher win
probability lottery A, irrespective of outcome magnitude. In
contrast, lottery B refers to the gamble with the higher outcome
magnitude in all EV-conditions, except for the congruent condition,
where win probability as well as outcome was higher in lottery
A. The terms lottery A and lottery B serve only as labels for the
choice options in this paper. Participants were unaware of the
lottery labels, and screen positions (left or right of the fixation
cross) as well as colors (yellow or blue) varied randomly between
lotteries A and B.
We restricted the
ANOVA to the two factors choice and presentation mode because the
inclusion of the third factor EV-condition led to empty cells in the
congruent EV-condition. This is because choice of lottery A or B is
not experimentally controlled and is unequally distributed across
conditions.