The effect of consumer ratings and attentional allocation on product valuations
Nathaniel J.S. Ashby*
Lukasz Walasek#
Andreas Glöckner$
Online marketplaces allow consumers to leave reviews about the
products they purchase, which are visible to potential customers and
competitors. While the impact of reviews on valuations of worth and
purchasing decisions has been intensively studied, little is known
about how the reviews themselves are attended to, and the relation
between attention and valuations. In three studies we use
eye-tracking methodologies to investigate attention in subjective
monetary valuations of consumer goods. We find that, when evaluating
consumer goods, individuals’ attention to ratings are related to
their frequencies, attention to positive or negative information is
related to subjective valuations, and that perspective (owner vs.
non-owner) influences the type of information attended to. These
findings extend previous research regarding the valuations of risky
prospects as implemented in abstract monetary gambles and suggest
that similar cognitive processes might underlie both types of tasks.
Over the last decade the number of online retail sales has been
increasing exponentially. In the second quarter of 2013 alone,
e-commerce accounted for 5.8 percent of total sales in the United
States, generating over 64 billion dollars in revenue.1
Online markets have without doubt changed the amount of product
information available to both consumers and merchants. In particular,
one aspect that makes online shopping distinct from more traditional
sales formats is the availability of product ratings and customer
reviews (Sénécal & Nantel, 2004). For instance, marketplaces such
as Amazon and eBay offer customers the chance to leave reviews about
the products they purchase, which are made freely available to
potential customers, the retailer, as well as competing merchants.
These consumer reviews have been shown to predict purchasing decisions
(Chen & Xie, 2008; Chevalier & Mayzlin, 2006; Chou, 2012; Dellacoras
et al., 2007; Floyd et al., 2014), to drive future consumer ratings
(Moe & Trusov, 2011), and to have more influence than expert reviews
on purchasing decisions (Chen, 2007; Sénécal & Nantel,
2004). This (over)reliance on reviews has been identified as a key
reason for herding behavior in online purchasing. Specifically, it has
been shown that sales figures increase as a function of product
ratings rather than the quality of the product (Chen, 2007;
Sénécal & Nantel, 2004). The effect of online reviews on both
preferential choices and valuation has been demonstrated in markets
for products ranging from books to beer (for a review see Hu et al.,
2008; see also Zhu & Zhang, 2010).
From the perspective of the decision maker, this reliance on the reviews
of others makes sense as ratings provide the consumer with the
opportunity to infer the quality of a good, based on the experiences of
other consumers (Chen, 2007; Hu et al., 2008). Consequently, ratings
and reviews are important elements of e-commerce, acting to reduce the
fear of uncertainty associated with online purchasing decisions (Beldad
et al., 2010; Koehn, 2003; Resnick et al., 2000; Tan, 1999). For
example, the availability of consumer ratings is one of the more robust
indicators used to infer the trustworthiness of an online retailer, and
thus acts to increase the propensity of making a purchase (Beldad et
al., 2010; Chou, 2012; Lim et al., 2006).
It is clear that consumer ratings have a large impact on consumer
decision making, however, details of the cognitive processes that
underlie this influence are still relatively unexplored. In the current
study we apply eye-tracking methodologies to improve our understanding
of these processes by investigating the relation of attention to
consumer ratings and individuals’ valuation of goods. Specifically, we
measure the distribution of attention to consumer ratings in the
context of an online marketplace with the goal of predicting consumers’
willingness to pay (WTP) and willingness to accept (WTA).
2 Attention
and cognitive processes of decision making
Starting with the seminal work by Russo (1978), eye-tracking
methodologies have become one important method for investigating the
cognitive processes underlying judgment and choice (Glaholt &
Reingold, 2011; Russo & Dosher, 1983; Russo & Leclerc, 1994; Wedel
& Pieters, 2000), and have become especially popular in the last 10
years (see Orquin & Mueller Loose, 2013, for an overview). It has
been shown, for example, that individuals increasingly focus on the
option they prefer over the course of a decision (Shimojo et al.,
2003), attend more to outcomes that are subjectively more important
for them (Orquin et al., 2013), and attend more to more probable
outcomes in risky decisions (Fiedler & Glöckner, 2012; Glöckner
& Herbold, 2011). Furthermore, attention systematically shifts
depending on perspective, with buyers attending to lower outcomes more
so than sellers (Ashby et al., 2012). This difference in attention has
been shown to partially mediate the endowment effect (i.e., the
disparity between WTP and WTA for the same good; Ashby et al.,
2012). In addition to reflecting the information uptake and
integration process, manipulations of attention have also been shown
to shift preferences, with objects that receive more attention
being preferred (Armel et al., 2008; Atalay et al., 2012; Shimojo et
al., 2003; but see Glaholt & Reingold, 2009, 2011). Thus, there is
ample evidence that that attention plays an important role in the
processes underlying preference construction.
One important class of models that aim to capture the relation between
attention and decision making are drift-diffusion models (DDMs). DDMs
suggest that, in a decision between two or more options, information
about each option is sampled according to a stochastic process. Then,
when one of the options has accumulated sufficiently greater positive
evidence than the alternatives, that option is chosen.
While some implementations of DDMs such as the Attentional Drift
Diffusion Model (aDDM) do not make specific predictions about how
attention is distributed over options during preference construction
(Krajbich, & Rangel, 2011), others such as Decision Field Theory
(DFT; Busemeyer & Towsend, 2003), and its extension developed to
predict subjective valuations, the Sequential Value Matching Model
(SVM model: Johnson & Busemeyer, 2005), do and can therefore account
for some of the findings introduced above. Specifically, they can
account for the fact that fixations to outcomes are a function of how
likely they are to occur and for the fact that attention to attributes
increases gradually with their importance. Notably, both classes of
models suggest that attention will have a direct impact on preference
formation.
Of particular relevance for the current work is the SVM model, which
extends classic work on DDMs—usually concerned with choices between
two or three options—to the case of valuations in which individuals
chose prices on a continuous scale. The SVM model does so by assuming
a two-layer process: In the first layer candidate valuations are
selected and revised. In the second layer evidence accumulation
process are applied in which evidence in favor of the candidate value
and the product are compared until a decision threshold is reached. If
the products value is higher than the candidate value then the
candidate value takes a step up, if the product value is lower than
the candidate value the candidate value takes a step down. There is a
probability that the candidate value is accepted. This probability
increases as the difference between the product and candidate value
decreases. According to the SVM model attention to an attribute will
increase with the importance of an attribute, and individuals’
valuations for products will increase with attention to positive
(value-increasing) and decrease with attention to negative
(value-decreasing) aspects. The SVM model explains differences between
WTA and WTP (i.e., the endowment effect) by differences in the
starting point for candidate prices (i.e. sellers start at the upper
end of the scale whereas buyers start at the lower end of the scale)
and insufficient adjustment. Hence, it does not predict differences in
attention between buyers and sellers. The first two predictions have
been confirmed for risky choices between, and valuations of, monetary
gambles (Ashby et al., 2012; Fiedler & Glöckner, 2012; Glöckner
& Herbold, 2011), while—in contrast to the prediction of the SVM
model—sellers showed increased attention to value-increasing aspects
as compared to buyers (Ashby et al., 2012).
In the following work, we test whether these three findings, which
test core predictions derived from the SVM model and general DDMs,
also hold for consumer valuations involving uncertain information in
the form of consumer reviews, which are often available in online
marketplaces. These tests are important for theoretical reasons as
well as practical ones. First, in contrast to previously used
paradigms, the situations of interest here are more complex in that
both direct information about the product (e.g., its appearance) and
indirect information from social sources are available. Given that
task complexity influences decision strategies (e.g., Payne, 1976;
Simon, 1955) it is unclear whether previous findings will
generalize. Second, and in a similar vein, it has been argued that
findings from monetary gambles do not necessarily generalize to
situations that involve real goods at all, as simpler strategies might
prevail in realistic settings that are potentially richer in affect
(e.g., Pachur & Galesic, 2013). Given these issues, it is important
to ask not only whether the previously observed effects hold, but also
whether they are different in magnitude (e.g., the strength of the
relation between outcome frequency and attentional allocation).
3 Hypotheses
The purpose of the current investigation is to extend the existing work
on attentional allocation beyond risky choice and valuation of risky
gambles to the valuation of consumer goods in the online retail
marketplace (i.e., the Amazon marketplace). In each study, we test
whether information is sampled (attended to) based on its frequency of
occurrence:
H1: The frequency of a given rating being provided will
guide attention to that rating, with higher frequency ratings garnering
a greater proportion of allocated attention.
In other words, in line with the processing assumptions of many DDMs for
valuation and choice (e.g., the DFT and SVM models) and previous
studies involving the valuation of risky prospects, we hypothesize that
attention will be allocated to ratings based on the percentage of
previous customers who provided such a rating. Thus ratings that were
endorsed (indicated) by more consumers will draw a greater proportion
of attention and will be attended to longer (even if ratings are
presented in an aggregated form).
As a direct consequence of the accumulation process, attentional
allocation should be systematically related to subjective valuations.
Thus, our second hypothesis is that:
H2: The proportion of attention that a person pays to lower
ratings correlates negatively with the person’s final valuations.
More precisely, we predict that the more an individual focuses on
lower ratings compared to higher ratings, the less he or she will
value a given product, in line with a prediction of the SVM model
(Johnson & Busemeyer, 2005). We note that without manipulating
attention it is not possible to make strong claims concerning the
direction of causality between the two factors. However, confirmation
of the correlation suggested by H2 would be a
necessary (although not sufficient) finding to support evidence
accumulation models such as the SVM model and the aDDM (Krajbich &
Rangel, 2011). To investigate whether attention just reflects emerging
preferences, or might even drive them (as suggested by SVM model and
aDDM), we further test whether this relation disappears when
controlling for the objective value of the ratings—their score and
frequency (some problems with this approach are discussed below)—and
whether this relationship between attention and valuation develops
over the course of the decision as an emerging preference, such that
it is found (or at least found to be larger) only in the latter part
of the decision process.
Additionally, in Study 3 we test whether previous findings related to
the role of top-down processes on attention allocation in the
valuation of risky prospects (Ashby et al., 2012; Kim et al., 2012;
Rubaltelli et al., 2012), which conflict with predictions of the SVM
model, will also be found in the context of online purchasing of
consumer goods. That is, we test whether perspective (i.e., being an
owner or non-owner) has an additional effect on how attention is
allocated:
H3: Perspective will have a top-down effect on attention
such that buyers will attend to lower ratings more than sellers (or
vice versa).
Specifically, based on previous findings that perspective biases
directed attention we expect that a similar pattern of biased
information search will also be found when the information being
attended to are consumer ratings. We are particularly interested in
whether these shifts in attention mediate differences in valuations
between buyers and sellers (i.e., the endowment effect) and if so to
what degree.
4 Study 1
4.1 Method
4.1.1 Participants and design
Twenty-seven participants were recruited from the MPI Decision Lab
Subjects Pool (the same pool was used for recruitment in Studies 2 and
3) and took part in Study 1, which was conducted alongside several
unrelated studies. The total time for all studies was under one hour
and participants received on average 12 Euro for their participation.
4.1.2 Materials
The stimuli (products) used in the study consisted of 40 common consumer
products (e.g., a computer mouse, thumb drive, umbrella), which were
selected from the Amazon.de marketplace. We used only products that
cost 30 Euro or less and had more than 10 customer ratings; ratings
were provided by customers and ranged from 1 (a very negative rating)
to 5 stars (the most positive rating). In addition, we attempted to
select categories of products that participants would be generally
familiar with to reduce the effect of product scarcity or uncertainty
on participants’ valuations (Loomes et al., 2009). For each option we
calculated the average negative rating and the proportion of customers
who gave such a rating, as well as the average positive
rating2 and the
proportion of participants who had given a positive rating. Product
ratings were coded as being positive if they were greater than 3.5
stars or negative if they were less than 2.5 stars; neutral ratings
between 2.5 and 3.5 stars were excluded. Items were selected so that
half of them had mostly positive ratings (above 3.5 stars) while the
other half had mostly negative ratings (below 2.5 stars).
Figure 1: Screenshot from Study 1 with average high star rating and
percentage of customers who gave such a rating on the left side of
screen and average low star rating and the percentage of participants
who gave such a rating on the right hand side of the screen.
4.1.3 Apparatus
Stimuli were presented on a 17" LCD monitor (resolution 1280
x 1024) and eye movements were recorded using an Eyegaze binocular
system (LC Technologies) with a remote binocular sampling rate of 120Hz
and an accuracy of 0.45° of visual angle.
4.1.4 Procedure
Upon arrival participants were seated (60 cm from the monitor and
employing a chin rest) and calibrated on the eye-tracker. They then
read instructions informing them that they would be presented with a
series of products and the ratings each product had received on
Amazon.de, and that their task was to assign a monetary value to each.
Participants were informed that they would see both the average high
and low rating as well as the percentage of previous customers who had
provided such ratings; ratings were presented on opposite sides of the
screen, counterbalanced across subjects (see Figure 1). Participants
were asked to indicate what they felt the product was worth as follows:
“Please provide a valuation for this product which would make you
equally happy to have either the amount you indicate or the product
shown.” Valuations were indicated by pushing (sliding) a computer
mouse up (down) which changed the valuation in 0.01 Euro increments, up
to a maximum of 30 Euros, and clicking the left mouse button to
confirm; the initial value displayed was always 0.00 Euro.
Clarification about the task was provided if necessary and participants
then provided valuations for each of the 40 products in random order
without pause.
4.2 Results
We defined our areas of interest (AOIs) so that they provided for
approximately a 1.5° visual angle border around our
stimuli (i.e., average star rating and the proportion of customers who
had given that rating—approximately 5.49° x
2.27° visual angle; notably however, the analyses that
follow were robust to changes in AOI definition). We then calculated a
Low-Gaze-Proportion (LGP; see Ashby et al., 2012) by dividing the
amount of time (duration of fixations in milliseconds) on the low
rating attributes (i.e., stars and probabilities) by the total time
spent attending to both the low and high ratings attributes (i.e.,
total gaze time).3 Thus, a LGP greater than 0.50 would indicate
that more attention was paid to the lower than to the higher rating,
while a LGP less than 0.50 would indicate a greater proportion of
attention was placed on the higher rating. Hence, LGP is a relative
measure that takes into account attention to both low and high
ratings. We note that LGP also captures some conceptual principles
related to general evidence accumulation models (e.g., accumulation of
evidence over time) and common choice rules (Luce, 1959), which other
variables such as simple fixation counts do not, providing further
justification for our use of LGP.
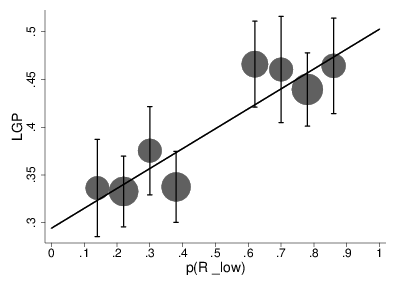
To test our first hypothesis (H1) that information
sampling would be predicted by the frequency of customers who provided
a given rating, we regressed LGP on the proportion of customers who had
given low ratings (p(Rlow)). In this and all analyses that
follow we conservatively correct for repeated measurement through the
use of a multi-level random coefficient model which places
p(Rlow) (and other predictors) on level 1 and
participants with random intercepts and slopes at level 2, while
additionally employing cluster corrected standard errors (Nezlek et
al., 2006; Rogers, 1993) using standard procedures (i.e., the
mixed command for mixed effect regressions and the
vce(cluster subject) option to allow correlations of error
terms within subject) in Stata 13 (Rabe-Hesketh & Skrondal, 2006,
2012). We find that LGP increases with p(Rlow), b =
.21, z = 4.86, p< .001 (Figure 2). Thus as
the frequency of negative reviews relative to positive reviews
increased, participants paid more attention (directed their gaze more)
to the negative star ratings, providing support for H1.
The same results hold for predictions of positive ratings. Furthermore,
the result is robust when predicting by the difference in proportions
between low and high star ratings (instead of using the ratio), and
when predicting fixation counts (e.g., proportion of fixations to the
low star ratings) rather than durations though, similar to findings in
our previous studies (Ashby et al., 2012), patterns of results for
fixation counts tended to be noisier and somewhat less robust (see
Footnotes 5 and 9, below).
Figure 2: Proportion of time spent attending to the low ratings
(LGP) by the frequency of consumers providing low ratings
(p(Rlow)) in Study 1. Observations on the x-axis are
collapsed into equally sized bins with the marker size indicating the
number of observations in each bin, and error bars indicating 95%
confidence intervals based on pooled SEs.
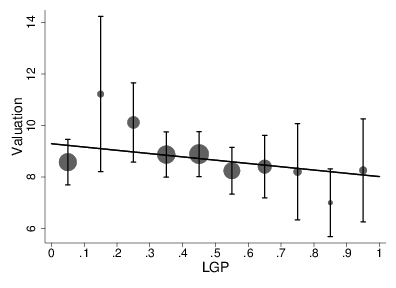
Figure 3: Valuation for each participant and each item by proportion of time
spent attending to the low ratings over time spent attending to low
ratings (LGP) in Study 1. Observations on the x-axis are collapsed
into equally sized bins with the marker size indicating the number of
observations in each bin; error bars indicate 95% confidence
intervals based on pooled SEs.
Next, we tested our second hypothesis (H2) that
attentional allocation would be related to valuations indicated by
participants by regressing subjective valuations on LGP. As predicted
we find LGP is a significant predictor, being negatively related to
subjective valuations, b = −.27, z = −3.30,
p< .01 (Figure 3).
To further explore the relation between attention and valuation,
particularly whether attention mainly reflects emerging valuations in
the form of confirmatory information search—or even drives
preferences as suggested by evidence accumulation models—we performed
two additional analyses. First, we tested whether differences in
attention just reflect frequentistic weighted averages. To do so we
calculated frequency-weighted customer ratings
(Rw) as follows:
Rw = (RlMl) + (RhMh)
Rl and Rh are the frequencies of
the low and high ratings, while Ml and Mh are the mean low and
high star ratings, respectively. If the effect of attention on
valuation disappears after including Rw that would reflect a simple
form of normative preferences (assuming that the expected utility of a
product’s given ratings follows a linear function) in how ratings were
taken into account. We note however, that the opposite results (i.e.,
still finding an effect of attention after controlling for Rw), is
only a weak indicator of whether attention has its own impact on
subjective valuations. That is, such a finding would not provide
conclusive evidence in favor of attention driving valuations since it
is possible (and likely) that Rw does not perfectly reflect a
person’s actual weighting of rating information. In other words, the
remaining correlation might just reflect imperfect measurement of
rating utilization (Kahneman, 1965; Linn & Werts, 1973). To conduct
this analysis, we regressed participants’ skew corrected
valuations4 simultaneously on LGP and
Rw. We find that LGP predicts valuation in addition to Rw, with
valuations decreasing as the duration of gaze to the attributes of low
ratings increases, b = −.12, z = −2.00,
p = .045 (Figure 3). Hence, attention provides unique
predictive power for valuations, although the effect is reduced by
56% after controlling for Rw.5 There is, however,
a clearer effect of Rw (coefficients), indicating that it is a
reliable measure of the influence of ratings on subjective
valuations, b = .001, z = 5.83, p< .001.
Second, we assessed more directly whether attention is just reflective
of an emerging valuation by testing whether the effects of LGP on
valuation just show confirmatory information search—similar to a
gaze cascade effect—in that people that have formed a high valuation
earlier in the process, later on look only at higher ratings to
confirm or bolster their forthcoming valuation. We first examined
whether first and last fixations differed in terms of the content they
were directed to by comparing the direction (coded 0 for high ratings,
1 for low ratings) of the first fixations and last fixations, which
were directed to either the low or high ratings (collapsed across
items). A paired samples t-test indicates that the first
fixation (M = .36; SE = .05) was not significantly
different from the last fixation (M = .44; SE =
.03), t(26) = 1.25, p = .22, showing that there was
no bias towards fixating on low or high ratings across the decision
process. Next, we sought to examine whether first or last fixations
affected valuations by regressing valuations on the direction of the
first and last fixations simultaneously. In doing so we find that
final fixations, b = −.09, z = −3.07, p< .01, but not first fixations, b = −.03,
z = −.79, p = .43, are significant predictors of
valuations, although a Wald test comparing their coefficients revealed
that they did not differ significantly (χ12 = 2.30, p
= .13). Overall, there appears to be no strong shifts in attention
between first and last fixations, which speaks against the hypothesis
that the effect of attention on valuation is reflective of only
emerging preferences. Still the significant effect of last fixations
might indicate that such an effect at least partially exists, although
it could also be explained by aDDM models in which particularly last
fixations are important for reaching a high versus low decision
threshold.
4.3 Discussion
We find clear support for our first two hypotheses in Study 1. In line
with H1 we find that as the frequency of customers
giving a low rating increases so does the proportion of attention
directed at it. Thus, as predicted by DFT and the SVM model, the
underlying relative frequency of ratings appears to predict where
attention is allocated to some degree. In line with our second
hypothesis we find that biases in attention towards low ratings
compared to the high ratings co-occur with a reduction in product
valuations. This effect reduces by more than half, though still holds
when controlling for the frequency-weighted ratings of a product, and
it does not increase significantly over the course of the decision
process. Taken together these additional analyses speak against the
hypothesis that attention is reflective of emerging preferences
only. A potential additional effect of attention on choice could be
explained by evidence accumulation models assuming that attention
drives valuation. However, given the natural limitations of the
regression approach applied in this research, any interpretations of
attention having a causal impact on valuations cannot convincingly be
made. Thus, in Study 1 we observe that in the valuation of consumer
products, attention to ratings are influenced by the frequency of
customers providing such reviews. Furthermore, we find that biases in
attention towards lower ratings go along with lower valuations of the
respective product.
Although some customer information websites use an aggregated format
where the percentages of positive (negative) reviews are displayed
(e.g., http://www.rottentomatoes.com), the external validity of
the results for other kinds of displays might be questioned. In Study
2 we therefore aimed to replicate the results using a more externally
valid display format that more closely resembles those commonly used
in online market places. Specifically, we used an information display
based on the layout of Amazon.de.
5 Study 2
5.1 Method
5.1.1 Participants and design
Thirty-four participants took part in Study 2 which was run together
with two unrelated studies. The total time was under an hour and
participants received on average 12 Euro for their participation;
participants who took part in Study 1 were excluded. Eye movements were
recorded using the same equipment as in the previous study.
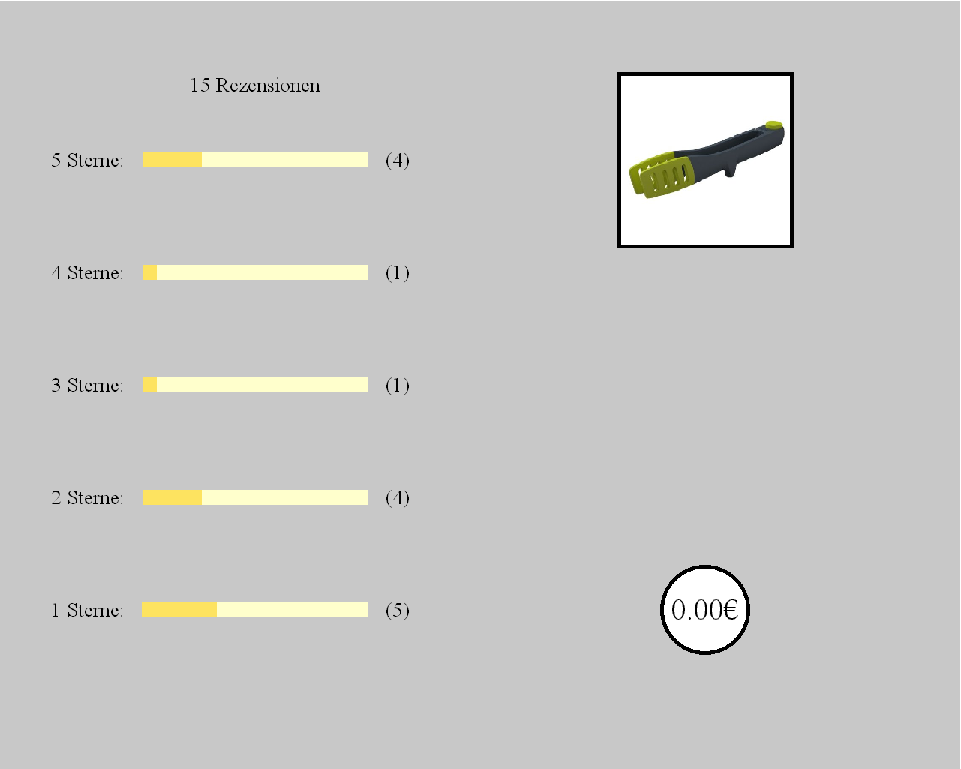
Figure 4: Screenshot of a trial from Studies 2 & 3. Total
number of customers giving reviews top left, graphical representation
of the proportion of customers giving each star rating (partially
filled bars) on left with absolute number of customers giving a certain
rating in brackets. Product displayed in upper right corner and
valuations entered in circle on bottom right.
5.1.2 Materials and procedure
All aspects of Study 2 were the same as Study 1 except for how rating
information was displayed. Specifically, instead of collapsing across
ratings we tried to closely mimic the set-up of Amazon.de by using a
graphical display (horizontal bars) to indicate the frequency of each
type of rating (i.e., one star, two stars, etc.) as well as the raw
count of customers who had provided such a rating, and the total
number of ratings provided (Figure 4).6
5.2 Results
We defined our AOIs to provide for an approximate 1° of
visual angle border around the ratings (star rating, graphical
frequency, and number of ratings—approximately 13.58° x
.56° visual angle), insuring that our AOIs took into
account the accuracy of the eye-tracker and ensuring that AOIs did not
overlap. Given that in contrast to Study 1 the value of ratings was
quasi continuous, we calculated a continuous LGPc score for
fixations to lower ratings, taking into account the magnitude of
ratings as follows:
LGPc =
2 P1 + P2
(2 P1 + P2) + (P4 + 2 P5)
Where Pi is the proportion of time spent looking at ith-stars
rating. Numbers 1 and 2 indicate the absolute strength of positive and
negative values, with 2 for more extreme ratings (i.e., 1 and 5 stars)
and 1 for ratings closer to the neutral midpoint (i.e., 2 and 4
stars). Hence, as before, an LGPc of zero occurs if
all fixations are on the negative ratings, and a score of one occurs
if all fixations were on the positive ratings. In addition, fixations
to more extreme ratings (e.g., 1 or 5 stars) are weighted twice as
much as less extreme ones (e.g., 2 or 4 stars).
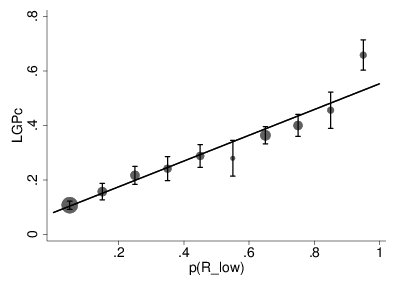
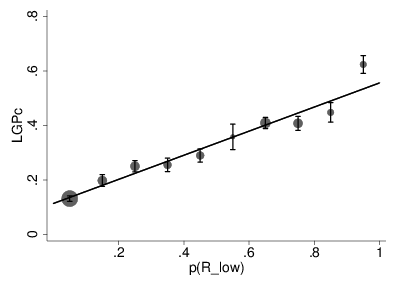
Figure 5: Low gaze proportion continuous (LGPc) by
weighted relative value of low ratings over (p (R_low) for
each participant and valuation in Study 2. Observations on the x-axis
are collapsed into equally sized bins with the marker size indicating
the number of observations in each bin and error bars indicating 95%
confidence intervals based on pooled SEs.
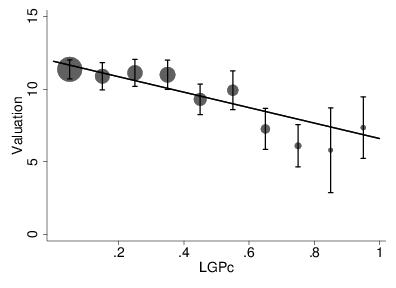
Figure 6: Valuation by low gaze proportion (LGPc) in
Study 2. Observations on the x-axis are collapsed into equally sized
bins with the marker size indicating the number of observations in each
bin and error bars indicating 95% confidence intervals based on pooled
SEs.
To test our first hypothesis we regressed LGPc on each
product’s p(Rlow).7
As in Study 1 we find support for our hypothesis that attention to
lower ratings increases with the relative frequency of those ratings,
b = .47, z = 15.41, p< .001
(Figure 5). As in Study 1 the results were robust when using positive
ratings and differences in frequencies, and when predicting fixation
counts instead of durations.
To test our second hypothesis we regressed subjects’ indicated
valuations (skew corrected) on LGPc and find, as predicted,
that LGPc shows a significant negative relation with
subjective valuations, b = −.45, z = −7.00,
p< .001 (Figure 6).
As in the previous study, to test whether the effect of
LGPc on valuations simply reflects rational
preferences (i.e., a normative linear weighting of ratings) we
regressed valuations on LGPc simultaneously with a
frequency-weighted rating score for products Rw.8 We find that
LGPc acts as an almost significant predictor over and
above Rw with increased attention to lower ratings predicting
decreases in valuation, b = −.09, z = −1.86,
p = .06, though as in Study 1 the effect is greatly reduced
(i.e., by 80%). As in the previous study increases in Rw were
found to be predictive of valuations, b = .12, z =
9.93, p< .001, with valuations increasing as the
frequency-weighted ratings increase, providing further support that it
is a reliable measure of the influence of ratings on subjective
valuations.
To examine whether first and last fixations differed in terms of the
content they were directed at, we compared the direction of the first
fixations and last fixations (collapsed across valuations) as in the
previous study. A paired samples t-test indicated that the
first fixation (M = .05; SE = .01) was less often
directed towards the lower ratings than the last fixation (M
= .39; SE = .02), t(33) = −12.60, p< .001. Thus, on average there was a bias towards fixating
on higher ratings earlier in the decision process. We note, however,
that the display had higher ratings in the upper left hand corner of
the screen, which provides a plausible explanation for this apparent
difference: reading from upper left to lower right. As in the previous
study we regressed valuations on the direction of the first and last
fixations (fixation to the lower ratings coded 0, higher ratings coded
1) simultaneously. In doing so we find that both first (b =
−.18, z = −2.85, p< .01) and final
fixations (b = −.12, z = −4.88, p< .001) are significant predictors of valuations; as before
a Wald test indicated that their coefficients were not significantly
different, χ12 = .85, p = .36. Thus, as in the
previous study, the relationship between attention and valuation does
not increase (decrease) over the course of the decision making
processes as one would predict if attention simply reflected emergent
preferences.
5.3 Discussion
Study 2 showed that, even when information is presented in a more
realistic and detailed fashion, roughly mirroring the Amazon.de online
marketplace, both of our hypotheses about the relationship between
attention and valuation are supported. First, attentional allocation
is driven by the stated frequency of a rating, and the relationship
between the two is quite strong even when those frequencies are not
described as probabilities, but are instead presented graphically and
as raw frequencies. Thus, as found in studies involving risky
prospects (Ashby et al., 2012; Fiedler & Glöckner, 2012) attention
does seem to be influenced by frequencies/percentages; although
notably, as in the previous studies, this relationship accounts for
only a portion of all variance in eye gaze. Therefore, while rating
frequencies are predictive, they account for only some parts of the
distribution of attention that we observed in the current study. In
addition, in line with our second hypothesis, attention is related to
subjective valuation, and this relationship does not change
significantly over the course of each decision, providing some support
for the general drift-diffusion model framework. It is noteworthy that
in this study even the first fixations significantly predict
valuations, which provides further evidence against the hypothesis
that attention is reflective only of emerging preferences.
6 Study 3
Study 3 was designed to test our third hypothesis regarding the
influence of perspective on both attentional allocation and valuation.
Importantly, besides the fact that the effect of perspective is
interesting in itself, this manipulation allows us to test whether the
endowment effect (Thaler, 1980) is conveyed by changes in attention.
Figure 7: Low gaze proportion continuous (LGPc) by weighted relative
value of low ratings (p(Rlow)) for each participant in
Study 3. Observations on the x-axis are collapsed into equally sized
bins with the marker size indicating the number of observations in
each bin and error bars indicating 95% confidence intervals based on
pooled SEs.
6.1 Method
Eighty-one participants took part in Study 3, which was designed
identically to Study 2, except that participants (between subjects)
made their valuations as either sellers (N = 41) or buyers
(N = 40). Participants randomly assigned to the role of buyers
were instructed to, “imagine that this item is available for purchase
and indicate the highest value you would be willing to pay to purchase
it.” Those randomly assigned to the role of sellers were instructed
to, “imagine that you currently own this item and indicate the lowest
value you would be willing to sell it for.”
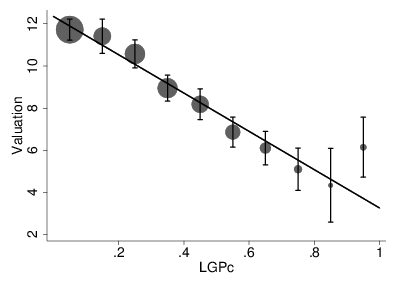
Figure 8: Valuation by low gaze proportion continuous
(LGPc) in Study 3. Observations on the x-axis are collapsed
into equally sized bins with the marker size indicating the number of
observations in each bin and error bars indicating 95% confidence
intervals based on pooled SEs.
6.2 Results
To test our first hypothesis we regressed LGPc (as
defined in Study 2) on p(Rlow) and find as predicted that
attention to lower outcomes increases with the relative frequency of
low ratings, b = .44, z = 28.00, p< .001 (Figure 7). Thus, as in both the previous studies,
there was a relationship between the frequency of a given rating being
provided and how attention is allocated. To test our third hypothesis,
that perspective would have an additional influence on attentional
allocation, we regressed LGPc on p(Rlow) and
perspective (coded 0 for sellers, 1 for buyers) and find as predicted
that perspective acts as a significant predictor, with buyers
(M = .29; SE = .01) focusing on lower ratings to a
greater degree than sellers (M = .26; SE = .01),
b = .05, z = 2.41, p<
.05. Still, it should be mentioned that the difference was small in
magnitude and that in both perspectives participants focused on higher
ratings to a greater extent than lower ratings. This latter effect
might, however, be partly due to the layout of the ratings with high
ratings appearing on the upper left side of the screen. As in the
previous studies, similar results are found when looking at the
positive ratings, the difference in positive and negative rating
frequencies, and when predicting fixation counts instead of durations.
To test our second hypothesis concerning whether attention is related
to valuations we predicted skew corrected valuations by
LGPc and find, as the in the previous studies, that
LGPc acts as a significant predictor, with increased
LGPc being negatively related to valuations,
b = −.70, z = −15.19, p<
.001 (Figure 8).
To examine whether this relationship is simply reflective of Rw and
perspective we preformed analysis as above but including both Rw
and perspective and find that LGPc continues to act as
a significant predictor, b = −.10, z = −2.42,
p< .05, though the relationship is reduced by
79%. As before we find Rw acts as a significant predictor
(b = .21, z = 18.42, p< .001)
and in addition find that buyers (M = 8.58; SE =
.17) indicated lower values than sellers (M = 10.80;
SE = 0.19), replicating the classic endowment effect
(b = −.19, z = −3.89, p<
.001). Lastly, to test whether LGPc might mediate
differences in valuation between perspectives (Ashby et al., 2012), we
conducted a mediation analysis, clustering across participants, and
using bootstrapping (conservatively with 5,000 repetitions) to
estimate standard errors (Preacher & Hayes, 2008) while
controlling for Rw. In doing so we find that LGPc
acts as an almost significant partial mediator, explaining a small
proportion (4%) of the difference in valuations that exists between
buyers and sellers, b = −0.007 [SE = .003],
z = −1.76, p = .08, CI.95[-.013,
.001]9.
As in the previous studies we examined whether initial fixations
(M = .05; SE = .007) differed from final fixations
(M = .41; SE = .01) and find that initial fixations
show a greater bias towards higher ratings, t(80) = −24.18,
p< .001, replicating the results of Study 2. Next,
we regressed valuations on the direction of the first and last
fixation as in the previous analyses. In doing so we again find that
initial fixations (b = −.17, z = −3.56,
p< .001) and final fixations (b = −.19,
z = −9.39, p< .001) are predictive of
valuations and a Wald test of their coefficients indicated that they
did not differ significantly (χ12 = .35, p = .56).
Lastly, given that some theories predict differential termination
points in information search/retrieval for buyers and sellers (Johnson
& Busemeyer, 2005; see also E. Johnson et al., 2007) we investigated
whether there was a differential shift in attention over the course of
the decision for buyers and sellers by regressing the difference in
initial and final fixations (initial−final fixation with fixations
to lower ratings coded 1, higher ratings coded 0) on condition. In
doing so we fail to find support a differential shift in attention
over time for buyers (Mfirst = .05 to Mfinal = .42) and
sellers (Mfirst = .05 to Mfinal = .40), b = −.01,
z = −.34, p = .73. In other words, while there is
a general shift in attention to lower ratings over the course of the
decision, this shift is not greater for buyers than for sellers.
7 General discussion
We conducted three studies investigating how attention is allocated
during product valuations based on online marketplace reviews, and the
relationship between attention and valuations, expanding
investigations beyond the case of product choice. Directly in line
with our first hypothesis we find in each study that there is a
significant relationship between where attention is allocated and the
frequencies—both when described as textual percentages and
graphically presented as frequency bars with absolute number of
ratings—of various ratings being given. Ratings of consumer products
that are endorsed by more consumers drew more attention. This effect
is directly in line with the general assumptions of drift-diffusion
models (DDMs) such as Decision Field Theory (DFT; Busemeyer &
Townsend, 2003) and its extension designed to predict subjective
valuations, the Sequential Value Matching Model (SVM: Johnson &
Busemeyer, 2005), and shows that the sampling effect extends beyond
simple displays involving valuations of, or choices between, risky
prospects. Secondly, we find in each study that attention is related
to valuations in that attention to lower ratings decrease valuation
and that this relationship does not change over the course of the
decision making process. Lastly, in line with our third hypothesis, in
Study 3 we find that attention is influenced by ownership perspective,
which is not predicted by the current implementation of the SVM
model. While this replicates and extends the finding that perspective
influences attentional allocation beyond valuations of risky prospects
(Ashby et al., 2012) and memory recall paradigms (Johnson et al.,
2007) it is worth noting that the effect is smaller than previously
observed with both perspectives focusing on higher ratings more than
lower ratings. Thus, although it appears that perspective does bias
attention in more complex environments as well, the bias is not as
large as has been reported in domains involving abstract monetary
gambles and attentional biases might be less of a factor in endowment
effects.
From a theoretical standpoint these results are highly informative.
First, the finding that sampling of information is closely related to
its frequency provides strong support for the underpinnings of DDMs
such as DFT and the SVM, which predict that the stochastic sampling
process is guided by the bottom-up influence of probabilities. Most of
the empirical evidence used to validate these models relies on highly
controlled choices between, and valuations of, risky prospects that
are relatively simple, low in contextual meaning, and affect-poor. It
is important for theory development that such findings generalize to
the context of consumer valuations where probabilities are replaced
with frequencies of a given rating being indicated by previous
purchasers. It is also of interest that in the current studies we
find both textually stated probabilities and graphical representations
of those probabilities guide attention to a similar degree. Thus, it
appears that both types of representations have a similar effect on
how attention is allocated. However, we would urge caution in drawing
strong conclusions about the equivalency of the two display formats as
such presentation differences are known to result in different
patterns of behavior and to interact with individual differences
(Dickert et al., 2011). As such, it is likely that some differences
are bound to exist in how different representations of
frequency/probability are reflected in attentional allocation, and we
suggest this as a fruitful line of study to pursue.
Furthermore, although there was a strong link between frequencies and
attentional allocation, the relationship was far from perfect. As such,
it is clear that the assumptions that underlie DDMs such as DFT’s and
the SVM’s stochastic sampling process are not yet well defined for
application outside binary choice. For instance, in Study 3 we find
that, in addition to the impact of frequency information on attentional
allocation, perspective also has a top-down influence on where
attention is directed; although as noted previously this effect is
smaller than has been found in studies involving valuations of risky
prospects (Ashby et al., 2012). Given that this top-down influence of
perspective on attentional allocation has now been shown to occur in
different domains (i.e., with risky prospects and consumer products),
and with different types of information displays (i.e., numeric and
graphical), it seems apparent that the behavioral findings of
differential information recall (Johnson et al., 2007) are likely to be
present in outward searches for information as well. Thus, DDMs which
make predictions about how attention is allocated during information
search would likely benefit by additionally taking the effects of
perspective into account. Future research could also explore how other
exogenous determinants of the reference point such as framing (Tversky
& Kahneman, 1981) or aspiration levels (Siegel, 1957), individual
factors such as mood (Loewenstein et al., 2001) and cognitive abilities
(Peters et al., 2006), and the salience of attributes (Pieters &
Wedel, 2004) influence the evidence accumulation process.
From a pragmatic standpoint the results of the current studies
indicate that not only do consumer ratings have a direct impact on
valuations of worth, as has been shown previously (Chen & Xie, 2008;
Dellarocas et al., 2007; Chou, 2012; Sénécal & Nantel, 2004), but
valuations are also related to how those ratings are attended to;
which as discussed above is only in part driven by the frequencies of
each particular rating being given. Thus, in addition to the direct
impact of ratings and their frequencies, consumers who focus more on
lower (higher ratings) might in turn value a given product as being
worth less (more). As such, online merchants should be aware that
regardless of the overall ratings, a product that has received any low
ratings could affect its judgments of worth if they garner sufficient
attention. We would further predict that this bias will in turn affect
decisions to purchase a product at a given price, but this of course
requires further empirical testing, as different processes are likely
to define attention to reviews in the context of choosing between
competing products (Nowlis & Simonson, 1997). However, given that
our displays were simplified and contained less information than is
provided by online marketplaces such as Amazon.de, the robustness of
such effects for actual consumer behavior requires further
investigation. For instance, online marketplaces often allow the
consumer to read individual ratings and to examine a products further
attributes such as technical specifications (e.g., weight, size,
material); factors known to influence consumer behavior (Chevalier &
Mayzlin, 2006). As such, future studies should follow up on the
current research by looking at how judgments are made in more
realistic environments. Particularly it is important to ask whether
the influence of attention to consumer ratings on pricing can be found
at similar strength in multi-attributive decision situations in which
attribute information has to be combined with ratings.
Importantly however, given that we mainly use a correlational
approach, conclusions concerning the direction of causality cannot be
conclusively made. That is, while we find that attention predicts
valuations in each of our studies, and that this is not just
reflective of an emerging confirmatory information search, it is still
not entirely clear if biases in attention simply reflect individuals’
preferences instead of driving them, or simply act to capture errors
in how ratings were assumed to affect valuations in the current
analyses (i.e., through a weighted additive calculation). Thus, while
we find evidence that attention is related to valuations of worth, we
must remain cautious concerning conclusion about the direction of the
effect; though our findings are in line with previous research that
offers some support for the contention that attentional allocation has
a direct, though minimal, impact on preference construction (Armel et
al., 2008; Atalay et al., 2012; Glaholt & Reingold, 2009, 2011;
Shimojo et al., 2003). As such, based on the current findings, it
seems possible that manipulations aimed at focusing attention on
positive ratings, even if those ratings are in the minority, should
have a positive effect on individual estimates of a products value. We
therefore suggest that future investigations should be aimed at
addressing the direction of the relationship between attention and
valuation by directly manipulating attention. Possibilities to do so
would be (a) to show positive or negative product ratings or
attributes for different durations (Armel et al., 2008) or (b) to
manipulate their salience by varying brightness (Milosavljevic et al.,
2012) or position (e.g., placing an option in the middle of a set,
which receives more attention, Atalay et al., 2012). Such
investigations—particularly when also avoiding demand effects by
involving real incentives—would be critical for the development of
theories related to evidence accumulation processes and the role
attention plays in general decision processes.
In conclusion, the studies reported here test popular theory in a novel
paradigm and suggest that the effects which are commonly found in the
valuation of risky prospects are also present in the valuation of
products based on consumer ratings, even when information is presented
graphically. As a result, the current studies act to both advance and
inform current theory by indicating where it is doing well (e.g.,
predicting information sampling based on frequencies/probabilities),
highlighting its generalizability to multiple domains. In addition, the
current studies point to where current theory is falling short (e.g.,
not including the top-down influence of perspective on
attention or clearly defining the role of attention), which we
hope will lead to a greater understanding of the information
acquisition process, and how that process impacts not only valuations,
but the preference construction process in general.
8 References
Armel, K. C., Beaumel, A., & Rangel, A. (2008). Biasing simple choices
by manipulating relative visual attention. Judgment and
Decision Making, 3(5), 396–403.
Ashby, N. J. S., Dickert, S., & Glöckner, A. (2012). Focusing on what
you own: Biased information uptake due to ownership. Judgment
and Decision Making, 7(3), 254–67.
Atalay, A. S., Bodur, H. O., & Rasolofoarison, D. (2012). Shining in
the center: Central gaze cascade effect on product
choice. Journal of Consumer
Research, 39(4), 848–866.
Beldad, A., de Jong, M., & Steehouder, M. (2010). How shall I trust the
faceless and the intangible? A literature review on the antecedents of
online trust. Computers in Human Behavior, 26, 587–869.
Busemeyer, J. R., & Townsend, J. T. (1993). Decision field theory: A
dynamic-cognitive approach to decision making in an uncertain
environment. Psychological Review, 100(3), 432–459.
Chen, Y. (2007). Herd behaviour in purchasing books online.
Computers in Human Behavior, 24(5), 1977–1992.
Chen, Y., & Xie, j. (2008). Online consumer review: word-of-mouth as a
new element of marketing communication mix. Management
Science, 54(3), 447–491.
Chevalier, J. A., & Mayzlin, D. (2006). The effect of word of mouth on
sales: Online book reviews. Journal of Marketing Research,
43(3), 345–354.
Chou, S. Y. (2012). Online reviews and pre-purchase cognitive
dissonance: A theoretical framework and research propositions.
Journal of Emerging Trends in Computing and Information
Sciences, 3(2), 199–204.
Dellarocas, C., Zhang, X. M., & Awad, N. (2007). Exploring the value of
online product reviews in forecasting sales: The case of motion
pictures. Journal of Interactive Marketing, 21(4), 23–45.
Dickert, S., Kleber, J., Peters, E., & Slovic, P. (2011). Numeracy as a
precursor to pro-social behavior: The impact of numeracy and
presentation format on the cognitive mechanisms underlying donation
decisions. Judgment and Decision Making, 6(7),
638-650.
Fiedler, S. & Glöckner, A. (2012). The dynamics of decision making
in risky choice: An eye-tracking analysis. Frontiers in
Cognitive Science, 3 (Article 335).
Floyd, K., Freling, R., Alhoqail, S., Cho, H. Y., Freling, T. (2014).
How online product reviews affect retail sales: A meta-analysis.
Journal of Retailing, 90(2), 217–232.
Glaholt, M. G., & Reingold, E. M. (2009). Stimulus exposure and gaze
bias: A further test of the gaze cascade
model. Attention, Perception, &
Psychophysics, 71(3), 445–450.
Glaholt, M. G., & Reingold, E. M. (2011). Eye movement monitoring as
a process tracing methodology in decision making
research. Journal of Neuroscience, Psychology, and Economics,
4(2), 125–146.
Glöckner, A., & Herbold, A. K. (2011). An eye-tracking study on
information processing in risky decisions: Evidence for compensatory
strategies based on automatic processes. Journal of Behavioral
Decision Making, 24(1), 71–98.
Hu, N., Liu, L., & Zhang, J. (2008). Do online reviews affect product
sales? The role of reviewer characteristics and temporal effects.
Information Technology & Management, 9(3), 201–214.
Johnson, J. G. & Busemeyer, J. R. (2005) A dynamic, computational model
of preference reversal phenomena. Psychological Review,
112(4), 841–861.
Johnson, E. J., Häubl, G., & Keinan, A. (2007). Aspects of endowment:
A query theory of value construction. Journal of Experimental
Psychology: Learning, Memory, and Cognition, 33(3), 461–474.
Kahneman, D. (1965). Control of spurious association and the reliability
of the controlled variable. Psychological Bulletin,
64(5), 326-329.
Kim, B. E., Seligman, D., & Kable, J. W. (2012). Preference reversals
in decision making under risk are accompanied by changes in attention
to different attributes. Frontiers in neuroscience, 6.
Koehn, D. (2003). The nature of and conditions for online trust.
Journal of Business Ethics, 43(1-2), 3–19.
Krajbich, I., & Rangel, A. (2011). Multialternative drift-diffusion
model predicts the relationship between visual fixations and choice in
value-based choice. Proceedings of the National Academy of
Sciences, 108(33): 13852–13857.
Lim, K. H., Ling Sia, C., Lee, M. K. O., & Izak,
B. (2006). Do I trust you online, and if so, will I buy? An
empirical study of two trust-building strategies. Journal of
Management Information Systems, 23(2), 233–266.
Linn, R. L., & Werts, C. E. (1973). Errors of Inference Due to Errors
of Measurement. Educational and Psychological Measurement,
33(3), 531–543.
Loewenstein, G. G., Hsee, C. K., Weber, E. U., & Welch, N. (2001). Risk
as feelings. Psychological Bulletin, 127(2), 267–286.
Loomes, G., Orr, S., & Sugden, R. (2009). Taste uncertainty and status
quo effects in consumer choice. Journal of Risk and
Uncertainty, 39(2), 113–135.
Luce, R. D. (1959). Individual
Choice Behavior a Theoretical Analysis. John Wiley and sons.
Milosavljevic, M., Navalpakkam, V., Koch, C., & Rangel, A. (2012).
Relative visual saliency differences induce sizable bias in consumer
choice. Journal of Consumer Psychology, 22(1), 67–74.
Moe, W.W., & Trusov, M. (2011). Value of Social Dynamics in Online
Product Ratings Forums, Journal of Marketing Research,
48 (3), 444–456.
Nezlek, J. B., Schröder-Abé, M., & Schütz, A. (2006).
Mehrebenenanalysen in der psychologischen
Forschung. Psychologische Rundschau, 57(4),
213–223.
Nowlis, S. M., & Simonson, I. (1997). Attribute-task compatibility as a
determinant of consumer preference reversals. Journal of
Marketing Research, 34(2), 205–218.
Orquin, J. L., Bagger, M. P., & Mueller Loose, S. (2013). Learning
affects top down and bottom up modulation of eye movements in decision
making. Judgment and Decision Making, 8(6), 700–716.
Orquin, J. L., & Mueller Loose, S. (2013). Attention and choice: a
review on eye movements in decision making. Acta
psychologica, 144(1), 190–206.
Pachur, T., & Galesic, M. (2013). Strategy selection in risky choice:
The impact of numeracy, affect, and cross-cultural differences.
Journal of Behavioral Decision Making, 26(3),
260–271. http://dx.doi.org/10.1002/bdm.1757.
Payne, J. W. (1976). Task complexity and contingent processing in
decision making: An information search and protocol analysis.
Organizational behavior and human performance, 16(2),
366-387.
Peters, E., Västfjäll, D., Slovic, P., Mertz, C. K., Mazzocco, K.,
& Dickert, S. (2006). Numeracy and decision making.
Psychological Science, 17(5), 407–413.
Pieters, R., & Wedel, M. (2004). Attention capture and transfer in
advertising: Brand, pictorial, and text-size
effects. Journal of
Marketing, 68(2), 36–50.
Preacher, K. J., & Hayes, A. F. (2008). Asymptotic and resampling
strategies for assessing and comparing indirect effects in multiple
mediator models. Behavior Research
Methods, 40(3), 879–891.
Rabe-Hesketh, S., & Skrondal, A. (2006). Multilevel modeling of complex
survey data. Journal of the Royal Statistical Society,
Series A (169), 805–827.
Rabe-Hesketh, S., & Skrondal, A. (2012). Multilevel and Longitudinal
Modeling Using Stata. 3rd ed. College Station, TX: Stata Press.
Resnick, P., Zeckhauser, R., Friedman, E., & Kuwabara, K. (2000).
Reputation systems. Communications of the ACM, 43(12), 45–48.
Rogers, W. (1993). Quantile regression standard
errors. Stata Technical
Bulletin, 2(9).
Rubaltelli, E., Dickert, S., & Slovic, P. (2012). Response
mode, compatibility, and dual-processes in the evaluation of simple
gambles: An eye-tracking investigation. Judgment &
Decision Making, 7(4), 427–440.
Russo, J. E. (1978). Eye fixations can save the world: A critical
evaluation and a comparison between eye fixations and other
information processing methodologies. Advances in consumer
research, 5(1), 561–570.
Russo, J. E., & Dosher, B. A. (1983). Strategies for multiattribute
binary choice. Journal of Experimental Psychology: Learning,
Memory, and Cognition, 9(4),
676.
Russo, J. E., & Leclerc, F. (1994). An eye-fixation analysis of
choice processes for consumer nondurables. Journal of Consumer
Research, 21(2), 274–290.
Sénécal, S., & Nantel, J. (2004). The influence of online product
recommendations on consumers’ online choices. Journal of
Retailing, 80, 159–169.
Shimojo, S., Simion, C., Shimojo, E., & Scheier, C. (2003). Gaze bias
both reflects and influences preference. Nature Neuroscience,
6(12), 1317–1322.
Siegel, S. (1957). Level of aspiration and decision making.
Psychological Review, 64(4), 253–262.
Simon, H. A. (1955). A behavioral model of rational choice. The
quarterly journal of economics, 69(1), 99–118.
Tan, S. J. (1999). Strategies for reducing consumers’ risk aversion in
internet shopping. Journal of Consumer Marketing, 6(2),
163-180.
Thaler, R. (1980). Toward a positive theory of consumer
choice. Journal of Economic Behavior & Organization,
1(1), 39–60.
Tversky, A., & Kahneman, D. (1981). The framing of decisions and the
psychology of choice. Science, 211(4481), 453–458.
Wedel, M., & Pieters, R. (2000). Eye fixations on advertisements and
memory for brands: A model and findings. Marketing science,
19(4), 297–312.
Zhu, F., & Zhang, X. (2010). Impact of online consumer reviews on
sales: The moderating role of product and consumer characteristics,
Journal of Marketing, 74(2), 133–148.
University of Göttingen and Max Planck Institute for Research on
Collective Goods.
The authors would like to thank Susann Fiedler and
Rebecca Wright for assistance and helpful comments on earlier versions
of this work. The second author’s contribution was supported by
Leverhulme grant RP2012–V–022.
Fixations were defined using the default
classification algorithm employed by the eye tracking software. In
approximately 16% of trials in Study 1, 5% in Study 2, and 4% in
Study 3 no fixations were made to the high and low ratings, or gaze
was lost by the eye tracker and these trials are not included in the
analyses that follow.
Valuations in each study showed significant
levels of positive skew. To correct for this we applied the
following formula: skew corrected valuation = ln(valuation –
k). Where k was selected such that it reduced the
level of skew to non-significance; results remained mainly the same
if uncorrected valuations were used.
Predicting valuations
instead by fixation counts (i.e., fixations to low/all fixations to
low and high ratings) results are in the same direction though the
effect fails to reach significance, p = .11: similar
results are found in Studies 2 (p = .36) and 3 (p
= .03). Thus, it appears that fixation durations are more closely
related to valuations than are fixation counts.
For more detailed
information concerning the probability distributions of ratings for
each of the products we refer to the data file which is published
jointly with this paper.
To take into account that in contrast
to Study 1 the value of ratings was quasi-continuous, we calculated
a weighted relative value of low ratings measure (i.e., 1 and 2) as
compared to all directed ratings (i.e., 1, 2, 4, 5):
p(Rlow) =
2 R1 + R2
(2 R1 + R2) + (R4 + 2 R5)
where Ri is a relative frequency of the ith-stars rating.
Conducting a similar mediation analysis but using
fixation counts the effect is in the same direction though
non-significant, p = .11, providing further evidence that
fixation durations are more closely related to valuations than are
simple fixation counts.