This study measures the perceived costs, perceived benefits, choice
outcome satisfaction, and choice process satisfaction from consumers
making hypothetical choices amongst prescription drug plans. I
juxtapose the number of options the consumer is choosing between and
his/her perceived variety of the choice set to understand which
contributes more to explaining these outcomes. I find that once
perceived variety is included in the model, the number of options
(i) has no effect on perceived benefits and choice outcome
satisfaction, (ii) increases perceived costs, and (iii) decreases
choice process satisfaction. Furthermore, the concave relationship
that has been shown to occur when the number of options increases is
a function of the subjective perception of variety. Overall, these
results contribute to our understanding of how assortment structure
and the number of options affect choice outcome and process
satisfaction. Additionally, this study provides some evidence that
can inform U.S. national heath insurance policy and the current
debate on choice in health care in the United States and other
countries.
Keywords: consumer choice, perceived variety, choice overload, choice
satisfaction, prescription drug plans, Medicare Part D
1 Introduction
A number of studies document “choice overload”, the phenomenon
that leads individuals to delay decision-making, report lower choice
satisfaction, and make poorer decisions when faced with a large number
of choice options (Iyengar & Lepper, 2000; Schwartz, 2004). Not all
studies, however, find evidence for the choice overload effect, and
most recently, there has been a call to understand how strong and
universal the effect is, as well as to identify some of the boundary
conditions for too much choice (Chernev, Bockenholt & Goodman, 2015;
Scheibehenne, Greifeneder & Todd, 2010).
Demonstrations of the choice overload effect suggest that, as we
increase the number of options, choice satisfaction initially improves
but after a certain point begins to decrease (in the shape of a
concave function). We can ask if this effect depends not only on the
number of alternatives in the choice set but also on how much variety
the alternatives in the choice set provide. This is a relevant
question for marketing managers that must decide how many options and
how much heterogeneity to include in a product line, for retailers
that must decide how many products to place on the shelf and whether
to include products that cover a range of different attributes, and
for public policy architects who must decide how many alternatives
(e.g., health plans) and of what types to offer citizens. In this
paper, I juxtapose the level of perceived variety against the number
of options to see which of these variables is more important in
explaining consumers’ perceived benefits, perceived costs, and
perceived net benefits of prescription health plans. The primary
hypothesis I test is that perceived variety is more important than the
number of options that a person has in influencing choice
satisfaction. The secondary hypothesis is that perceived variety
mediates the relationship between the number of options and choice
satisfaction.
Although the majority of studies in the choice overload
literature consider the number of options only in their analyses, there
is a reason to suspect that this type of model is too simplistic: the
relationship between the different options may also affect choice
satisfaction. In practice, some choice sets cover a wider product line
and some a narrower one even when both choice sets have the same number
of products. Empirically, it may be important to account for such
differences between choice sets.
For this reason and possibly others, researchers have considered the
roles of other attributes of choice sets, besides assortment size, in
models that explain how individuals select between alternatives. The
simple model has been enriched with the consideration of
information structure, the number of attribute levels for
each attribute and the distribution of attribute levels across
alternatives (Lurie, 2004); assortment structure which
depends on the relative attractiveness of the options, attribute
complementarity, and pricing (Chernev, 2012); and by choice
complexity, the number of alternatives and number of attributes on
which they are described (Greifeneder, Scheibehenne & Kleber,
2010). That these additions are critical to understanding consumer
choice is evidenced by the fact that complexity of the choice set
arises as one of the factors that moderates the choice overload effect
(Chernev et al., 2015).
This research has been complemented by studies in the marketing
literature that explore customer motivations for seeking variety.
Firstly, consumers care about the variety of the choice set because
they are more likely to find products they like from more varied choice
sets (Hoch, Bradlow & Wansink, 1999; Lancaster, 1990). Even for a
single consumer, variety seeking can be explained by the multiple needs
that a product may serve for a consumer, desire to maintain choice
flexibility over time, and intra- and inter-personal motives such as
desiring varied consumption (McAlister & Pessemier, 1982; Kahn &
Lehmann, 1991; Kahn, 1998). These motivations for wanting
variety in choice sets parallel the benefits that consumers seek from
having more options in a choice set: having more choice may increase
the availability of heterogeneous products at a single point in time
and over time (see for example Bundorf & Szrek, 2010, for a discussion
of this point in the context of health plan choice).
One difference between the number of options and variety is that,
while number of options is relatively easy to discern, the actual
level of variety of an assortment may not be easy for consumers to
perceive correctly. Perceived variety is apparently more closely
related to anticipated consumption utility than to actual variety,
because of structural factors such as assortment organization or
complexity, which may make it harder for consumers to discern actual
assortment variety (Broniarczyk & Hoyer, 2010; Broniarczyk, Hoyer &
McAlister, 1998; Hoch et al., 1999; Kahn & Wansink, 2004; Kahn,
Weingarten & Townsend, 2013; van Herpen & Pieters, 2002). This, and
the lack of data on perceived variety, may be two reasons why more
studies in the choice overload literature ignore the perceived variety
of the choice set or the assortment structure in their models.
However, a handful of studies incorporate both the number of options
and perceived variety (or actual variety) in their models. First, one
study analyzes the relationship between the number of choices and the
attribute distribution amongst twelve product categories in two
popular stores in Germany: Fasolo, Hertwig, Huber and Ludwig (2009)
found that larger supermarkets actually do have more variety (density
and entropy) than smaller supermarkets, and their simulations of
consumer choice strategies show that choice is more difficult but not
necessarily better from larger stores. In the context of speed
dating, Lenton and Francesconi (2011) consider the number of potential
mates and the actual variety of different mate options, and their
results suggest that increased variety (but not increased options)
created increased confusion amongst choosers, leading them to defer
choices and make poorer quality decisions. In another study, Mogilner,
Rudnick and Iyengar (2008) found that the presence of categories
influenced perceptions of variety and explained consumer satisfaction
better than the actual number of options of magazines. A different
study that estimates choice deferral finds that choice complexity,
rather than perceived variety, mediates the interaction between
presentation type and number of options (Townsend & Kahn, 2014). In
related work, Chernev and Hamilton (2009) show that consumers tend to
prefer stores or assortments with fewer alternatives when the options
are relatively attractive but prefer stores or assortments with more
alternatives when the options are less attractive.
Of these studies, Lenton and Francesconi (2011) is closest to the
current research. I take a different approach than Lenton and
Francesconi (2011) by building on an existing model in the literature
that considers the final outcome (outcome and process satisfaction)
and also separates the final outcome into benefits and costs. In this
model, costs and benefits increase with the number of options, and the
benefits increase more than the costs at first but the costs increase
at a faster rate, leading to a concave function (Reutskaja & Hogarth,
2009). In the present study, I add perceived variety to the original
Reutskaja-Hogarth model, thus testing whether it is the effect of the
number of options or whether it is the effect of perceived variety
that explains the concave function characteristic of choice overload.
The present study directly builds on previous work in this context
that considers the effects of choice set size on decision making
(Bundorf and Szrek, 2010), the effects of choice set size on
anticipated enrollment (Szrek & Bundorf, 2011), and the mediating
roles of costs and benefits in explaining decision quality (Szrek &
Bundorf, 2014). The question asked in this study is also closely
related to other research that fundamentally questions whether choice
is desired in and of itself (Iyengar & Lepper, 1999; Bown, Read &
Summers, 2003; Szrek & Baron, 2007) by considering whether
individuals are seeking more options or more variety.
2 Method
2.1 Participants
The analysis is from a survey fielded in December 2007 to a
sample of adults aged 65 years and older drawn from an internet-enabled
panel developed and maintained by Knowledge Networks. In total, 534
eligible panel members were contacted, and 294 unique respondents
completed the study, answering the key dependent and independent
variables, for a response rate of 55%. Respondents were given a fixed
fee for participating. Because the sample was restricted to internet
users, the study population is not representative of the US population
aged 65 and older, however it is a diverse population both in
geographical and socio-demographic terms (Bundorf and Szrek, 2010). Of
the 294 respondents that completed the survey, 251 gave responses to
both choice scenarios. Forty-three respondents answered one scenario
only. The main analysis uses all 545 observations ((2*251) + 43 = 545),
whereas a sub-analysis considers the 251 respondents that answered both
scenarios.
2.2 Procedure
Knowledge Networks sent an email to participants to visit the study
website. The link is available at
http://www.stanford.edu/group/health\_surveys/cgi-bin/ex/mkb1.htm.
Before entering the site, respondents were asked to provide informed
consent. Once agreed, they continued onto the website. First, they
were asked to assume a hypothetical scenario: they were not able to
obtain prescription drug coverage from any other source and needed to
make a decision amongst the prescription drug plans that would be
presented to them. They were asked to answer carefully, as if they
were making real decisions. Participants were then shown some
information about Medicare Drug Plans, and they were given the option
to open this information in another window for the duration of the
experiment. Respondents then entered the experiment and were
immediately randomized to one of two experimental conditions. The
experimental condition varied the level of differentiation in the
characteristics of the plans in their choice set.1 Within that
experimental condition, they were randomized to a set of 2, 5, 10, or
16 drug plan options. Respondents were asked to select a prescription
drug plan from the set shown to them. After choosing, respondents were
asked a series of questions about the plan that they chose and the
choice set they were shown. After answering these questions,
respondents were randomized to a different number of drug plans within
the same experimental condition. Respondents repeated the procedure of
choosing a drug plan and responding to the same post-choice questions.
2.3 Materials
The scenario was designed to be as real as possible. Descriptions of
the plan attributes were assembled from currently available materials
on the Medicare web site. Plan characteristics were selected to
resemble those currently available in the market and were devised from
data on plan offerings publicly available from the Centers for
Medicaid and Medicare Services. In addition, so that prices reflected
the attributes of each drug plan and to ensure that respondents were
choosing between plans of similar expected value, a premium for each
plan was calculated based on a model of the relationship between
observed premiums and plan characteristics at the time of data
collection (Simon & Lucarelli, 2006). With the attribute and price
information for each plan, we formed the master sets of drug plans,
which we used as a basis for the randomization (Bundorf & Szrek,
2010).
2.4 Measures
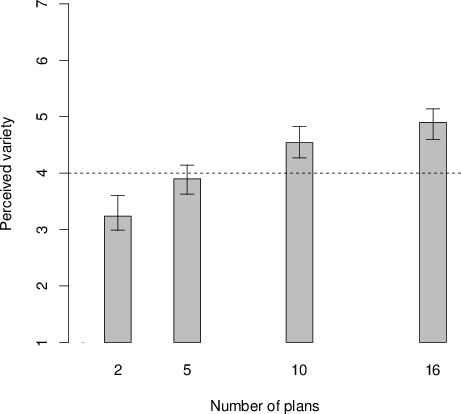
Figure 1: Mean perceived variety by number of plans:
An anova shows significant differences across the
distribution of variety by number of plans. Means were,
respectively, 3.24, 3.90, 4.54, and 4.90 on a scale from 1 to
7. Error bars show standard deviations.
Respondents were questioned about the perceived variety of
the choice set, choice outcome and choice process satisfaction,
perceived benefits of the chosen item, perceived costs of the choice
process, and desire for choice of multiple items. Additionally,
extensive information was available about the respondents’ demographic
characteristics and the following characteristics were included in the
models: age, gender, education level, race, marital status, household
income, and a 5-category self-perceived health status variable. Sample
means for these variables are listed in Appendix B, Table B1.
3 Results
Table 1: Key variable definitions, means, and correlations.
Name
Definition
Number of plans
Respondent randomized to 2, 5, 10, or 16 plans
Perceived variety
Do you think that the selection should have included a greater variety of plans? Scale 1–7, (1) I had too little variety, (4) I had the right amount of variety, (7) I had too much variety
Outcome satisfaction
How much do you like the plan you decided to pick? Scale 1–7, (1) Not at all, (7) Extremely
Process satisfaction
How much did you enjoy making the choice? Scale 1–7, (1) Not at all, (7) Extremely
Perceived benefits
How different/similar is the plan you chose from the ’ideal’ plan you would like to purchase for yourself? Scale 1–7, (1) Ideal plan would be very different from the plan I chose now, (7) The plan I chose now is the ideal one
Perceived costs
Did you find it difficult to make your decision? Scale 1–7, (1) Not at all, (7) Extremely
Desire for choice
Would you prefer to choose your own Medicare drug plan from a variety of plans or would you rather be automatically enrolled into a single standard plan? Scale 1–7, (1) I would prefer to NOT choose my own plan, (4) I am indifferent, (7) I would prefer to choose my own plan.
Correlations
Variable
Mean
S.D.
Number of Plans
Perceived variety
Outcome satisfaction
Process satisfaction
Perceived benefits
Perceived costs
Number of plans
8.18
5.19
1
Perceived variety
4.15
1.78
0.33*
1
Outcome satisfaction
4.29
1.38
0.07
0.22*
1
Process satisfaction
3.11
1.68
-0.07
0
0.56*
1
Perceived benefits
4.09
1.64
0.11
0.24*
0.63*
0.41*
1
Perceived costs
4.72
1.80
0.15*
0.18*
-0.19*
-0.40*
-0.11*
1
Desire for choice
5.68
1.61
0.02
-0.09
0.09
0.13*
0.06
-0.01
Note: All correlations are Spearman. N= 545 with up to 2 responses per individual, * reflects p<.01.
3.1 Summary statistics
Table 1 shows the means of the variables with their associated
correlations. Frequency distributions (not shown in table) highlight
that many people found the choice very difficult (61% responded with
5, 6, or 7) and many did not enjoy the choice at all (58% responded
with 1, 2, or 3). On the other hand, close to half of the respondents
claimed to have chosen a plan close to their ideal plan (45% responded
with 5, 6, or 7) and said they liked the plan they chose (46%
responded with 5, 6, or 7).
Number of options has a significant correlation with perceived
variety and choice difficulty. Perceived variety is also significantly
correlated with choice outcome satisfaction, perceived benefits, and
perceived costs (but not with choice process satisfaction which shows a
moderate correlation with desire for variety). Choice outcome
satisfaction exhibits strong positive correlations with choice process
satisfaction and perceived benefits, and a negative correlation with
perceived costs. Choice process satisfaction also has a positive
correlation with benefits and a negative correlation with costs. Costs
and benefits show a negative correlation.
Figure 1 (previous page) displays how perceived variety varies with
the number of options. An anova reveals that perceived variety is
significantly different across the distribution of number of options
(n=545, F=24.55, Prob>F=0.00). Four (4) on the perceived
variety scale corresponds to the respondent having the right amount of
variety, and with 2 or 5 plans, the respondents on average perceived
variety being less than they wanted and with 10 or 16 plans, the
respondents on average perceived variety being more than they wanted.
Table 2: Net benefits.
Choice outcome satisfaction
Choice outcome satisfaction
Choice process satisfaction
Choice process satisfaction
Number of plans
0.147
0.060
0.026
–0.047
[0.046, 0.248]**
[–0.040, 0.161]
[–0.088, 0.140]
[–0.155, 0.061]
Number of plans squared
–0.007
–0.004
–0.003
0.001
[–0.012, –0.002]**
[–0.009, 0.001]
[–0.009, 0.004]
[–0.005, 0.006]
Perceived variety
1.185
1.611
[0.918, 1.451]**
[1.299, 1.923]**
Perceived variety squared
–0.122
–0.193
[–0.154, –0.091]**
[–0.231, –0.155]**
Desire for variety
0.068
0.128
[–0.021, 0.157]
[0.015, 0.240]*
Constant
6.422
3.394
6.905
2.658
[3.835, 9.008]**
[0.823, 5.966]**
[3.373, 10.437]**
[–0.794, 6.111]
N
545
545
545
545
R2
0.09
0.22
0.08
0.24
F
1.35
5.95
2.08
7.93
Root MSE
1.36
1.26
1.66
1.51
Joint significance test (number of plans, number of plans squared)
F test
4.35
1.52
1.63
3.46
Prob>F
0.014*
0.220
0.198
0.033*
Joint significance test (perceived variety, perceived variety squared)
F test
42.94
51.6
Prob>F
0.000**
0.000**
Note: Models show coefficients and 95% confidence intervals for key variables. The following demographic control variables were included in the regression but are not displayed in the table: education, health status, household income, gender, age, race, and marital status: * p<0.05; ** p<0.01.
3.2 Regressions
Table 3: Perceived benefits and costs.
Perceived benefits
Perceived benefits
Perceived costs
Perceived costs
Number of plans
0.113
0.000
0.018
0.009
[–0.006, 0.231]
[–0.110, 0.110]
[–0.098, 0.133]
[–0.104, 0.122]
Number of plans squared
–0.004
0.000
0.002
0.002
[–0.010, 0.002]
[–0.006, 0.006]
[–0.004, 0.008]
[–0.004, 0.008]
Perceived variety
1.495
–0.832
[1.180, 1.809]**
[–1.250, –0.414]**
Perceived variety squared
–0.153
–0.119
[–0.191, –0.115]**
[0.071, 0.167]**
Desire for variety
0.088
0.038
[–0.021, 0.196]
[–0.095, 0.172]*
Constant
5.774
1.931
1.687
3.112
[3.140, 8.409]**
[–0.643, 4.505]
[–1.390, 4.764]
[–0.274, 6.498]
N
545
545
545
545
R2
0.08
0.23
0.09
0.16
F
1.34
12.14
6.61
7.06
Root MSE
1.62
1.48
1.76
1.7
Joint significance test (number of plans, number of plans squared)
F test
4.53
0.03
7.89
4.64
Prob>F
0.012*
0.973
0.001**
0.010*
Joint significance test (perceived variety, perceived variety squared)
F test
54.85
18.69
Prob>F
0.000**
0.000**
Note: Models show coefficients and 95% confidence intervals for key variables. The following demographic control variables were included in the regression but are not displayed in the table: education, health status, household income, gender, age, race, and marital status: * p<0.05; ** p<0.01.
I tested for a concave relationship between the number of options and
perceived benefits, costs, net benefits (choice outcome satisfaction
and choice process satisfaction), following Reutskaja and Hogarth
(2009). My model initially estimated each of these four dependent
variables with the number of options and number of options squared as
the explanatory variables (with the squared term to allow for a
non-linear relationship) plus the demographic control variables. I
then estimated a second model in which I added perceived variety and
perceived variety squared. I also included a control measure for
desire for variety in the models to improve the precision of the
perceived variety measure. All regressions use clustering to control
for up to two observations per individual and robust standard errors
to correct for homoscedasticity in the data. I analyzed the joint
significance of the linear and quadratic predictor variables. This
tests the main hypothesis through a comparison of the size and
significance of perceived variety and number of options.
Table 4: Margins calculated at each level of perceived variety.
Choice outcome satisfaction
Choice process satisfaction
Estimate
95% CI
Estimate
95% CI
Level
Lower bound
Upper bound
Lower bound
Upper bound
1
2.937
2.622
3.252
1.784
1.458
2.110
2
3.755
3.560
3.950
2.816
2.599
3.032
3
4.327
4.165
4.489
3.461
3.250
3.671
4
4.654
4.492
4.817
3.719
3.501
3.938
5
4.737
4.579
4.895
3.591
3.389
3.793
6
4.575
4.398
4.751
3.077
2.871
3.283
7
4.167
3.888
4.447
2.176
1.851
2.502
Perceived benefits
Perceived costs
Estimate
95% CI
Estimate
95% CI
Level
Lower bound
Upper bound
Lower bound
Upper bound
1
2.340
1.988
2.691
5.030
4.520
5.540
2
3.377
3.163
3.590
4.555
4.251
4.859
3
4.108
3.927
4.289
4.319
4.082
4.555
4
4.534
4.350
4.717
4.320
4.086
4.554
5
4.654
4.478
4.831
4.559
4.339
4.779
6
4.469
4.262
4.676
5.036
4.811
5.262
7
3.979
3.631
4.327
5.752
5.391
6.112
Note: Margins were calculated post-regression (Tables 2 and 3). They show the average estimated value of the dependent variable when all observations are as if they took on the value of perceived variety at that point. Control variables are left unchanged. Post-estimation tests show that the values of the margins at each level are significantly different from the margins at adjacent values in all regressions, except for choice difficulty in which they are the same for values 3 and 4.
Choice outcome satisfaction.
Table 2 shows how the net
benefits (choice outcome and choice process satisfaction) relate to
the number of options and perceived variety. I find that the number of
options has a statistically significant concave relationship with
choice outcome satisfaction when I do not include perceived variety
(as in Model 1). One interpretation from this model is that an
increase from five to six options increases choice outcome
satisfaction by 1% while an increase from five to ten options
increases choice outcome satisfaction by 3%. However, as shown in
Model 2, as soon as perceived variety is included in the model, the
joint effect of number of options is no longer significant. The joint
effect of perceived variety and perceived variety squared, in
contrast, is significant and concave; choice outcome satisfaction
peaks when perceived variety is 5 on a 1 to 7 scale (Table 4). Since
the interpretation of “4” on the scale for perceived variety is “I had
the right amount of variety”, this suggests that choice outcome
satisfaction is highest when perceived variety is one level higher
than “the right amount”. A change in perceived variety from 3 to 4
will increase choice outcome satisfaction by 5.3 percentage points,
while a change from 2 to 4 will increase choice outcome satisfaction
by 15 percentage points.
Choice process satisfaction.
The number of options and
number of options squared does not show a significant effect on choice
process satisfaction when perceived variety is not in the model (Table
2, Model 3). However, a joint significance test suggests that number
of options and number of options squared are jointly significant when
perceived variety is included (Model 4). When perceived variety is
fixed at 3, an increase from 5 to 10 plans reduces choice process
satisfaction by 2.7%. The joint effect of the perceived variety
variables is also significant and concave in this model, with choice
process satisfaction at its peak when perceived variety is 4 on a 1 to
7 scale (Table 4) – that is, when perceived variety is at the “right
amount”. Furthermore, increases in perceived variety from 3 to 4 will
increase choice process satisfaction by 4.3 percentage points, while a
change from 2 to 4 will increase choice process satisfaction by 15
percentage points.
Table 5: Joint significance tests of age groups, education groups, and gender.
Choice outcome satisfaction
Choice process satisfaction
Perceived benefits
Perceived costs
Omitted Age Group (65-69)
Age Group (70-74)
F test
4.15
0.68
0.18
0.11
Prob>F
0.042*
0.410
0.675
0.742
Age Group (75+)
F test
20.69
11.27
2.46
1.56
Prob>F
0.000**
0.000**
0.119
0.213
Omitted Education Group (Some College)
Education Group (Less than High School)
F test
9.20
1.19
5.87
0.56
Prob>F
0.003**
0.276
0.016*
0.456
Education Group (High School)
F test
0.14
0.57
0.66
4.13
Prob>F
0.713
0.453
0.417
0.043*
Education Group (Bachelor’s degree or higher)
F test
0.66
0.45
1.41
2.85
Prob>F
0.418
0.504
0.236
0.092
Female
F test
2.37
0.42
1.22
0.35
Prob>F
0.125
0.518
0.271
0.554
Note: Tests show the joint significance of the category listed, its interactions with perceived variety, and its interactions with perceived variety squared relative to the omitted group. All tests are run following regressions that estimate the dependent variable on the number of plans, number of plans squared, perceived variety, perceived variety squared, desire for variety, interactions with (perceived variety, perceived variety squared, and education group/age group/gender), and individual characteristics (education group, age group, gender, household income, self-assessed health status, race, and marital status).
Perceived benefits.
The number of options and number of
options squared exhibit a significant concave relationship with
perceived benefits when perceived variety is not included (Table 3,
Model 1), with perceived benefits peaking at 14 plans. However, once
perceived variety is included in the model (Table 3, Model 2), the
joint effect of number of options and number of options squared is no
longer significant. The joint effect of the perceived variety
coefficients, in contrast, is significant, and exhibits a concave
relationship with perceived benefits. Perceived benefits peak when
perceived variety is at 5 on a scale of 1 to 7 (Table 4), when
perceived variety is one level higher than the “right amount”. A
change in perceived variety from 3 to 4 increases perceived benefits
by 7 percentage points, while a change in perceived variety from 2 to
4 increases perceived benefits by 19 percentage points.
Perceived costs.
The number of options and number of
options squared show a significant effect on perceived costs –
increasing perceived costs with increases in the number of options —
regardless of whether perceived variety is included in the regression
(Models 3 and 4 in Table 3). Linear and squared terms of perceived
variety are jointly statistically significant displaying a convex
relationship with perceived costs. Perceived costs are lowest when
perceived variety is 3 or 4 (Table 4). In other words, perceived costs
are lowest when perceived variety is at “the right amount” or one
level lower. When perceived variety decreases or increases by one
level (down to 2 or up to 5), perceived costs increase by 4 percentage
points. Additionally, when perceived variety is 4, an increase from 5
to 10 plans increases perceived costs by 10%.
Individual characteristics.
I then tested whether the
effects of perceived variety on the dependent variables differ by the
age, gender, and education level of the respondent. I reran the
regressions as before with interactions for each of these demographic
variables with perceived variety and perceived variety squared.
Post-regression statistical tests in Table 5 highlight the effect of
interactions between education, age, gender, and perceived variety on
the dependent variables. For individuals in the lowest education group
(less than high school), perceived variety did not significantly
affect either choice outcome satisfaction or perceived benefits,
however desire for variety did – with individuals with higher desire
for variety showing lower choice outcome satisfaction and perceived
benefits (supported by further analysis).
The oldest age group (Age 75+) showed differences vis-à-vis the
other groups in how variety affected their assessment of net benefits.
In particular, perceived variety had a larger effect on their
assessments of both choice outcome and process satisfaction when
perceived variety was either very low or very high, lowering their
satisfaction (supported by further analysis). The middle age group (Age
70–74) also had lower endpoints for choice outcome satisfaction than
the youngest age group (Age 65-69).
I did not find that men and women exhibited differences in how
variety affected perceived benefits, costs, and net benefits.
Within subject analysis.
Next, I complement the analysis with a
within-subject analysis that considers how differences in perceived
variety and number of plans across the two choices made by the
respondent affect differences in perceived benefits, costs, and net
benefits. This analysis addresses the concern that an omitted variable
that relates to perceived variety and the dependent variables could be
affecting the results.
I find that choice outcome satisfaction, choice process satisfaction,
and perceived benefits all show a concave relationship with perceived
variety and that choice difficulty shows a convex relationship with
perceived variety (Appendix B, Table B2). Number of plans shows a
significant and a concave relationship for choice outcome
satisfaction.
Table 6: Mediation analysis: Indirect effects of number of plans through perceived variety.
Choice outcome satisfaction
Choice process satisfaction
a*b at X values
Estimate
95% BC CI
Estimate
95% BC CI
2
0.039
0.024
0.058
0.031
0.016
0.051
5
0.030
0.019
0.043
0.018
0.007
0.032
10
0.015
0.007
0.024
–0.000
–0.016
0.006
16
–0.000
–0.016
0.008
–0.031
–0.054
–0.013
Benefits
Costs
a*b at X values
Estimate
95% BC CI
Estimate
95% BC CI
2
0.047
0.027
0.069
–0.000
–0.018
0.011
5
0.037
0.023
0.054
0.006
–0.006
0.017
10
0.020
0.008
0.031
0.020
0.010
0.036
16
–0.000
–0.018
0.011
0.037
0.022
0.062
Note: Indirect effects (of the number of plans through perceived variety on the dependent variable) in four mediation models are shown. Models preserved the non-linear relationships between number of plans and the outcome variables and perceived variety and the outcome variables. Models also include demographic control variables. Estimates and 95% bias-corrected confidence intervals are shown for 1000 bootstrapped samples. Bolded values highlight confidence intervals that do not include 0.
3.3 Mediation models
From recent advances in research on mediation (Hayes, 2013; Preacher
& Hayes, 2008; Zhao, Lynch & Chen, 2010), we know that, in addition
to its direct effect (or even if there is no direct effect), a
variable may exert an (important) influence on another variable
indirectly. Hence, to complete the analysis, I ran mediation models
to test for whether perceived variety mediated the relationship
between number of options and the dependent variables. This tests the
second hypothesis by testing a path through which number of options
operates. I estimated mediation models that preserved the non-linear
relationships between the number of options (perceived variety) and
the dependent variables. I then used Medcurve to compute unbiased
bootstrapped confidence intervals (Hayes & Preacher, 2010).
In Tables 2 and 3, the joint effect of number of options and
number of options squared tests whether the direct effect of number of
options on the dependent variable is significant. Table 6 shows
the indirect effects of number of options on the different dependent
variables, measured at each number of options (2, 5, 10, or 16 health
plans).
Choice outcome and process satisfaction.
The indirect
effect of number of options through perceived variety on choice
outcome satisfaction is positive and significant when the number of
options is 2, 5, and 10. This effect is highest when the number of
options is 2 and decreases as the number of options increases,
becoming insignificantly different from 0 for the highest level of
options in the experiment (16). The interpretation is that an increase
in three options at the level of 2 plans will increase choice outcome
satisfaction through perceived variety by 0.12(=3 x 0.04), a 2
percentage point increase.
The indirect effect of number of options through perceived
variety on choice process satisfaction is positive and significant when
there are 2 or 5 options, zero for 10 options, and negative and
significant when there are 16 options. In other words, as the number of
options increases the effect of the number of options through perceived
variety on choice process satisfaction goes from being positive to
being negative. At 16 options, a three option increase indirectly
decreases choice process satisfaction by 0.09 (or 1.5 percentage
points).
Costs and Benefits.
The number of options also has a
positive and significant indirect effect through perceived variety on
the benefits of choice when the number of options is 2, 5, or 10. The
effect is largest for the smallest set size (2), where the effect of
an increase in three options increases perceived benefits by .15
points (2.50 percentage points). The number of options has an indirect
effect on the perceived costs when the number of options is 10 or
16. An increase in three options increases perceived costs at 16 plans
by 0.12 (2 percentage points).
4 Discussion
Many studies document a concave relationship between the number of
options and consumer satisfaction (Lenton, Fasolo & Todd, 2010;
Reutskaja & Hogarth, 2009; Shah & Wolford, 2007; Soyer & Hogarth,
2011). I also find such a relationship between the number of options
and both choice outcome satisfaction and perceived benefits. However,
because the literature points to the importance of assortment
structure and the variety of the choice set in influencing behavior, I
also include perceived variety in my models. Once I do this, I find
support for the primary hypothesis that perceived variety is more
important than the number of options that a person has: perceived
variety displays a concave relationship with choice outcome
satisfaction, choice process satisfaction, and perceived benefits and
a concave relationship with perceived costs (see Models 2 and 4 in
Tables 2 and 3). In contrast, after I include perceived variety in the
models, number of options did not improve any outcomes, but on average
reduced choice process satisfaction and increased perceived costs.
This finding is consistent with the notion that having more options is
desirable if they are perceived as differentiated options. In fact,
the results support the secondary hypothesis that having more options
does improve outcomes through its effect on perceived variety. While I
found (Tables 2 and 3) that, on average, the direct effect of number
of options was to decrease choice process satisfaction and increase
perceived costs, the mediation results (Table 6) suggest additional
ways in which number of options affects the dependent variables
through perceived variety. For small choice sets, having more options
increases perceived variety and consequently boosts choice outcome
satisfaction, choice process satisfaction, and perceived benefits. For
large choice sets, having more options increases perceived variety but
consequently reduces choice process satisfaction and increases
perceived costs. These findings suggest a theoretical mechanism
underlying the relationship between number of options and choice
outcomes.
The paper also builds on earlier studies in the literature. I was able
to replicate the results by Reutskaja and Hogarth (2009) before
illustrating the role of perceived variety in a similar model. The
findings regarding perceived variety can also be fit into the taxonomy
that Chernev (2012) offers for assortment structure, where perceived
variety relates to attribute complementarity. Furthermore, the results
provide additional support that perceptions of variety positively
influence consumer satisfaction (Broniarczyk et al., 1998; Hoch et
al., 1999; Mogilner et al., 2008). In summary, the study addresses
research on perceived variety and research on choice overload to show
that the same concave relationship that was previously attributed to
the number of options, is qualified by perceived variety and that the
peak of this inverted U shaped function is when perceived variety is ‘just
right’.
This study is not without limitations. Most critically, the measures
are simple and consist of single items. They were based on previous
papers in the literature (Iyengar & Lepper, 2000; Reutskaja &
Hogarth, 2009), but some authors have used more robust
measures. Actual variety has been measured in more robust ways by
other researchers (e.g., Fasolo et al., 2009; Lurie, 2004), but may
not always be a good replacement for perceived variety (Broniarczyk et
al., 1998; Hoch et al., 1999; Kahn & Wansink, 2004). In this study,
respondents did not discern the actual variety manipulation (Appendix
A), and future research should consider whether complexity of the
choice task was the main reason for this. Future research should also
explore the heterogeneity amongst respondents in their preferences for
more options and more variety, examining the extent of that
heterogeneity and its effects on choice satisfaction.
The data are, of course, from a specific context, but the experiments,
despite being hypothetical, use stimuli that closely resemble the true
stimuli and respondents are seniors that make these decisions in real
life. The results from non-hypothetical studies with other consumer
goods reinforce the findings. For example, Mogilner et al. 2008 show,
using magazines and coffee as stimuli, that perceived variety affects
choice satisfaction. Greifender et al. 2010 suggest, using pens and
MP3 players as stimuli, that the too-much choice effect is stimulated
by choice complexity, which is a function of the number of options as
well as other features of the choice set. Still, not all of the
results will necessarily be affected in the same way from using
hypothetical measures. Perceived variety and choice process
satisfaction, as in the previous two examples, may not differ as much
as choice outcome satisfaction does in a real scenario. Nevertheless,
I expect that the results will generalize reasonably well in contexts
where decisions are less consequential and not as complex, such as in
these two studies. Moreover, although the study was run with older
adults, related prior work has shown that numeracy is a more relevant
characteristic than age when it comes to choice overload. For example,
older adults with lower numeracy made poorer quality decisions in
extensive choice environments than their higher numeracy
counterparts2 (Szrek
& Bundorf, 2014) and were more likely to report positive willingness
to pay for choice than those with higher numeracy even when choice did
not improve their outcomes (Szrek & Bundorf, 2011). Elsewhere I have
found positive willingness to pay for choice amongst younger subject
pools (Szrek & Baron, 2007), implying that the results in this paper
should generalize to younger populations. Nevertheless, there is no
doubt that populations with lower socioeconomic status and lower
numeracy levels, including populations of older adults, have
difficulty with decisions involving extensive choice and may be
especially “lured” by the illusion of choice; these groups need more
assistance with these decisions especially when the decisions can
affect their welfare.
The relationship between perceived variety, choice
satisfaction, and individual utility or welfare has not been discussed
in this paper, however it is especially important in contexts that
affect the health and/or financial welfare of citizens. I caution that
when interpreting the results, optimizing the relationship between
perceived variety and consumer satisfaction should not be an objective
in and of itself, but need be related to other potential goals, like
improving the welfare of decision makers by helping them make better
decisions (see for example Kling et al. 2012 and Ketcham et al. 2012
for studies that measure welfare in this context). I briefly explored
the relationship between decision quality (as in Szrek and Bundorf,
2014), perceived variety, perceived benefits, perceived costs, and net
benefits of choice in the data. I found that perceived variety mediates
the relationship between perceived benefits and net benefits (both
outcome and process satisfaction) and decision quality, although it has
no direct effect on decision quality. These results are noteworthy as
they help to position these results in the broader context; in both the
health care context and in other financial contexts with important
consequences, a complete analysis should give some consideration to
decision quality.
The current health insurance exchanges in the United States are
similar to Medicare Part D in that choice is provided through an
internet platform that requires potential consumers to sort through
different choices and make a decision. Many of the difficulties that
researchers identify parallel those that have been discussed for
Medicare Part D (Wong et al., 2014) suggesting that the results
discussed in this paper are relevant to improving the current platform
for Affordable Care Act coverage in the U.S. In other countries,
health care choice is also a key policy issue. In Switzerland, for
example, individuals have to choose between many different private
health insurance plans (Frank & Lamiraud, 2009). Maintaining patient
choice of hospital (for example in England, Denmark, Norway, Sweden)
or choice of provider (for example in France or Germany) has been a
key policy issue – and regulatory mechanisms have tried not to
sacrifice choice for efficiency (Jost, Dawson & den Exter,
2006). Understanding how the number of options, perceived variety,
choice satisfaction, and decision quality relate may lead to a better
appreciation for when and how individuals benefit from more choice in
health care and other contexts.
References
Bown, N. J., Read, D., & Summers, B. (2003). The lure of
choice. Journal of Behavioral Decision Making, 16(4),
297.
Broniarczyk, S. M. & Hoyer, W. D. (2010). Retail assortment:
More[338?]= better. In M. Krafft & M.K. Mantrala (Eds.)
Retailing in the 21st Century, (pp. 271–284). Berlin, Germany:
Springer.
Broniarczyk, S. M., Hoyer, W. D., & McAlister, L. (1998). Consumers’
perceptions of the assortment offered in a grocery category: The impact
of item reduction. Journal of Marketing Research,
35(2), 166–176.
Bundorf, M. K. & Szrek, H. (2010). Choice set size and decision making:
the case of Medicare Part D prescription drug plans. Medical
Decision Making, 30(5), 582–592.
Chernev, A. (2012). Product assortment and consumer choice: An
interdisciplinary review. Foundations and Trends (R) in
Marketing, 6(1), 1–61.
Chernev, A., B¨ockenholt, U., & Goodman, J. (2015). Choice
overload: A conceptual review and meta-analysis. Journal of
Consumer Psychology, 25(2), 333–358.
Chernev, A. & Hamilton, R. (2009). Assortment size and option
attractiveness in consumer choice among retailers. Journal of
Marketing Research, 46(3), 410–420.
Fasolo, B., Hertwig, R., Huber, M., & Ludwig, M. (2009). Size, entropy,
and density: What is the difference that makes the difference between
small and large real-world assortments? Psychology &
Marketing, 26(3), 254–279.
Frank, R. G. & Lamiraud, K. (2009). Choice, price competition and
complexity in markets for health insurance. Journal of Economic
Behavior & Organization, 71(2), 550–562.
Greifeneder, R., Scheibehenne, B., & Kleber, N. (2010). Less may be
more when choosing is difficult: Choice complexity and too much choice.
Acta psychologica, 133(1), 45–50.
Hayes, A. F. (2013). Introduction to mediation, moderation, and
conditional process analysis: A regression-based approach. New York:
Guilford Press.
Hayes, A. F. & Preacher, K. J. (2010). Quantifying and testing indirect
effects in simple mediation models when the constituent paths are
nonlinear. Multivariate Behavioral Research, 45(4),
627–660.
Hoch, S. J., Bradlow, E. T., and Wansink, B. (1999). The variety of an
assortment. Marketing Science, 18(4), 527–546.
Iyengar, S. S. & Lepper, M. R. (1999). Rethinking the value of choice:
a cultural perspective on intrinsic motivation. Journal of
Personality and Social Psychology, 76(3), 349–366.
Iyengar, S. S. & Lepper, M. R. (2000). When choice is demotivating: Can
one desire too much of a good thing? Journal of Personality and
Social Psychology, 79(6), 995–.
Jost, T. S., Dawson, D., & den Exter, A. (2006). The role of
competition in health care: A western European perspective.
Journal of Health Politics, Policy and Law, 31(3),
687–703.
Kahn, B. E. (1998). Dynamic relationships with customers: High-variety
strategies. Journal of the Academy of Marketing Science,
26(1), 45–53.
Kahn, B. E. & Lehmann, D. R. (1991). Modeling choice among assortments.
Journal of Retailing. 67(3), 274–299.
Kahn, B. E. & Wansink, B. (2004). The influence of assortment structure
on perceived variety and consumption quantities. Journal of
Consumer Research, 30(4), 519–533.
Kahn, B. E., Weingarten, E., & Townsend, C. (2013). Assortment variety:
too much of a good thing. Review of Marketing Research,
10(1), 1–23.
Ketcham, J. D., Lucarelli, C., Miravete, E. J., & Roebuck, M. C.
(2012). Sinking, swimming, or learning to swim in Medicare Part D.
The American Economic Review, 102(6), 2639–2673.
Kling, J. R., Mullainathan, S., Shafir, E., Vermeulen, L. C., & Wrobel,
M. V. (2012). Comparison friction: Experimental evidence from Medicare
drug plans. The Quarterly Journal of Economics,
127(1), 199–235.
Lancaster, K. (1990). The economics of product variety: A survey.
Marketing Science, 9(3), 189–206.
Lenton, A. P., Fasolo, B., & Todd, P. M. (2010). Who is in your
shopping cart? expected and experienced effects of choice abundance in
the online dating context. In N. Kock (Ed.) Evolutionary
psychology and information systems research, (pp. 149–167).
New York, NY: Springer.
Lenton, A. P. & Francesconi, M. (2011). Too much of a good thing?
variety is confusing in mate choice. Biology Letters,
7(4), 528–531.
Lurie, N. H. (2004). Decision making in information-rich environments:
The role of information structure. Journal of Consumer
Research, 30(4), 473–486.
McAlister, L. & Pessemier, E. (1982). Variety seeking behavior: An
interdisciplinary review. Journal of Consumer Research,
9(3), 311–322.
Mogilner, C., Rudnick, T., & Iyengar, S. S. (2008). The mere
categorization effect: How the presence of categories increases
choosers’ perceptions of assortment variety and outcome satisfaction.
Journal of Consumer Research, 35(2), 202–215.
Preacher, K. J., & Hayes, A. F. (2008). Contemporary approaches to
assessing mediation in communication research. In A. F. Hayes, M. D.
Slater, & L. B. Snyder (Eds.), The Sage sourcebook of advanced
data analysis methods for communication research (pp. 13-54). Thousand
Oaks, CA: Sage.
Reutskaja, E. & Hogarth, R. M. (2009). Satisfaction in choice as a
function of the number of alternatives: When “goods satiate”.
Psychology & Marketing, 26(3), 197–203.
Scheibehenne, B., Greifeneder, R., & Todd, P. M. (2010). Can there ever
be too many options? a meta-analytic review of choice overload.
Journal of Consumer Research, 37(3), 409–425.
Schwartz, B. (2004). The paradox of choice. New York, NY: Ecco.
Shah, A. M. & Wolford, G. (2007). Buying behavior as a function of
parametric variation of number of choices. Psychological
Science, 18(5), 369–370.
Simon, K. I. & Lucarelli, C. (2006). What drove first year premiums in
stand-alone medicare drug plans? Technical report no. 12595,
National Bureau of Economic Research.
Soyer, E. & Hogarth, R. M. (2011). The size and distribution of
donations: Effects of number of recipients. Judgment and
Decision Making, 6(7), 616–628.
Szrek, H. & Baron, J. (2007). The value of choice in insurance
purchasing. Journal of Economic Psychology, 28(5),
529–544.
Szrek, H. & Bundorf, M. K. (2011). Age and the purchase of prescription
drug insurance by older adults. Psychology and Aging,
26(2), 308–320.
Szrek, H. & Bundorf, M. K. (2014). Enrollment in prescription drug
insurance: The interaction of numeracy and choice set size.
Health Psychology, 33(4), 340–348.
Townsend, C. & Kahn, B. E. (2014). The “visual preference heuristic”:
The influence of visual versus verbal depiction on assortment
processing, perceived variety, and choice overload. Journal of
Consumer Research, 40(5), 993–1015.
Van Herpen, E. & Pieters, R. (2002). The variety of an assortment: An
extension to the attribute-based approach. Marketing Science,
21(3), 331–341.
Wong, C. A., Asch, D. A., Vinoya, C. M., Ford, C. A., Baker, T., Town,
R., & Merchant, R. M. (2014). The experience of young adults on
healthcare. gov: suggestions for improvement. Annals of
Internal Medicine, 161(3), 231–232.
Zhao, X., Lynch, J. G., & Chen, Q. (2010). Reconsidering Baron and
Kenny: Myths and truths about mediation analysis. Journal of
Consumer Research, 37(2), 197–206.
Appendix A: Description of the variety manipulation
The experiment manipulated actual variety by randomizing
respondents to choice sets with more or less differentiation amongst
product attributes. This was accomplished by having one high
differentiation condition and another low differentiation condition.
The variety manipulation did not “work” in the sense that respondents
did not perceive a large or significant difference in the two
conditions. The correlation of actual variety and perceived variety is
0.0158 (Prob>t=0.7070).
I believe that the lack of a relationship between actual and
perceived variety has to do with the complexity of the task that was
asked of respondents, as reflected by the similarity to the real task.
In other papers, Bundorf and I document the difficulty of the task
(Szrek and Bundorf, 2011, Szrek and Bundorf, 2014) as do other
researchers (Ketcham, Lucarelli & Miravete, 2012; Kling et al.,
2012). Because this study elicited perceived variety, I do not discuss
actual variety further in the paper and focus instead on perceived
variety which has received as much attention as actual variety by
consumer behavior researchers. Here I summarize, for interested
readers, how actual variety (differentiation) was manipulated and
illustrate with some tables how the attributes in the high and low
differentiation choice sets compared to each other.
Implementing low and high differentiation.
The objective in creating
low and high differentiation conditions was to construct choice sets
such that within set variation in plan attributes would be greater in
high differentiation than in low differentiation sets. However, it
was also desirable for the mean characteristics of plans to be similar
among respondents in the low and high differentiation arms to ensure
that the characteristics of offered plans did not differ in systematic
ways between the arms. This was accomplished by first defining a set
of 16 highly differentiated plans (and then 16 sets of 16 low
differentiated plans) that were described on 5 attributes and then by
setting monthly premiums (the sixth attribute) in such a way that
choice sets were equivalent in terms of expected value. I describe how
this was done.
The high differentiation choice set was constructed by varying the
ranges of the plan characteristics (except monthly premium) as much as
possible but keeping them within the range of existing plans in the
market. Each of the 16 different plans in this highly differentiated
choice set was then used to define a low differentiation choice
set. So, for example, the 3rd plan in the high differentiation choice
set was the first plan in the 3rd set of (16) low differentiation
plans. The plan characteristics of the other 15 plans of the low
differentiation set were created by varying the characteristics of
each plan within pre-defined relatively narrow limits for the choice
set. Up to three characteristics were changed at a time for each
plan. The range for each of the attributes and the number of levels of
each attribute was restricted to vary from 3 or 4 levels to 2 or 3
levels. For example, the plans in the high differentiation condition
had a deductible of either 0, 100, or 250 (3 levels). In the low
differentiation choice sets, the possible deductibles are either 0 and
100 or 100 and 250 (2 levels). To use another example, the number of
drugs with a $20 or less copay has 4 levels in the high
differentiation choice set, spanning the range of 20 to 95. In the low
differentiation choice sets, the range is set by the original plan
from the choice set +/- 5, so the range spans 10 (for example, 15 to
25 or 35 to 45). For another example, see plan B of the high variety
choice set in Table A1 (at the end of Appendix A). For each of the 15
plans in the low differentiation set modeled after plan B, only three
characteristics were modified at a time (and these were modified
within the limits shown). For example, all plans in this low
differentiation choice set have coverage in the gap, although some
have coverage in the gap for generic and branded drugs, while some
plans have coverage in the gap for generic drugs only.
Then, to make sure that the characteristics of offered plans did not
differ in systematic ways between the arms, the monthly premium was
determined using the relationship between observed premium and plan
characteristics from the market (Simon and Lucarelli, 2006): monthly
premium = 4 + 0.4 * Formulary Breadth – 0.12 * Prior Authorization +
0.05 * Copayment + 10.0 * Generic Gap + 25 * Brand and Generic Gap –
10 * $100 Deductible – 25 * $250 Deductible. This equation, by
valuing the characteristics in dollar terms allows us to say that
respondents in all choice sets saw options with similar expected
value. This ensured that all respondents, regardless of the variety of
the choice set or number of options (plans) that they were randomized
to, would be choosing between plans that were actuarially
equivalent. In the set of plans shown in Table A1, the monthly premium
ranged from $38.15 to $65.25.
Randomization.
In the study, individuals were randomized to a level
of differentiation (high, low) and number of drug plans (2, 5, 10,
16). If they were randomized to the high differentiation choice set,
the plans presented to them were randomly chosen from the original
differentiated choice set (the high differentiation choice set). If
they were randomized to the low differentiation choice set, they were
randomized to one of the 16 low differentiation choice sets that were
created from the highly differentiated choice set. Plans presented to
them were then randomly chosen from this low variety choice set. The
order of presentation of the plans was also randomized.
Comparisons between the high and low differentiation choice
sets.
Tables A2 and A3 present comparisons of the low and high
differentiation choice sets. The high differentiation choice set has
higher maximum value and lower minimum value for all attributes
compared to the averages for the low variety choice sets (Table
A2). Similarly, the number of attribute levels, density, and range are
higher for the high differentiation choice set than for the average of
the low differentiation choice sets. (The number of attribute levels
for the monthly premium is an exception – this was always 16 because
of the equation used to calculate monthly premium.) An examination of
each of the low variety choice sets (not shown in table) shows that
the number of attribute levels, density, and range are always lower in
the low differentiation choice sets with the exception of number of
attribute levels for monthly premium (as mentioned) and for the
density of the deductible which is sometimes higher in the low
differentiation choice sets. The maximum values for all attributes are
higher (or equal) in the high differentiation set than the individual
low differentiation sets and the minimum values are lower (or equal)
for all attributes with the exception of the monthly premium which is
slightly higher in 4 low differentiation choice sets and slightly
lower in 1 low differentiation choice set (not shown in table). The
density was calculated by dividing the range by the number of
attribute levels minus 1. For example, in the high differentiation
choice set, the out of pocket maximum ranged from 2500 to 6350 and
there were 7 unique attribute levels, yielding a density of
641.7=(6350-2500)/(7-1).
The variances are shown for all choice sets in Table A3, and the
variances for each attribute are always lower for the low
differentiation choice sets compared to the high differentiation
choice set.
Table A1: Example of a Low Variety Choice Set.
Monthly premium
Deductible
Number of top 100 Medicare drugs on formulary
Number of drugs requiring prior authorization
Number of drugs with a $20 or less copay
Availability of coverage in the gap
Plan B from the high variety set
63,75
0
75
0
75
Yes, Generics and Branded drugs
Possible characteristics of the set of plans modeled after Plan B
Ranged from 38.15 to 65.25
0, 100
70, 75, 80
0, 5
65, 75, 85
Yes, Generics and Branded drugs Yes, Generics drugs
Table A2: Comparison of high and low differentiation choice sets.
Monthly premium
Deductible
Number of top 100 Medicare drugs on formulary
Number of drugs requiring prior authorization
Number of drugs with a $20 or less copay
Availability of coverage in the gap
HIGH
Maximum value
63.75
250
99
40
95
10
Minimum value
6.2
0
75
0
20
0
Number of attribute levels
16
3
4
4
4
3
Density
3.837
125
8
13.333
25
5
Range
57.55
250
24
40
75
10
LOW
Maximum value
55.313
156.25
92
21.563
68.5
7.188
Minimum value
28.138
37.5
83.688
13.438
50
2.188
Number of attribute levels
16
2
2.875
2.625
3
2
Density
1.812
118.75
4.479
5
9.25
5
Range
27.175
118.75
8.313
8.125
18.5
5
Note: The table shows the characteristics of the full (16 item) high differentiation choice set and averages for each characteristic across the full 16 low differentiation choice sets. Availability of coverage in the gap was converted to numeric, for the purposes of this table, where 10=Yes, Generics and branded drugs, 7=Yes, Generics only, and 0=No. Density is calculated as (Maximum value – Minimum value)/(Number of attribute levels – 1). The Range is calculate as (Maximum value – Minimum value).
Table A3: Variances of the attributes in the different choice sets.
Monthly premium
Deductible
Number of top 100 Medicare drugs on formulary
Number of drugs requiring prior authorization
Number of drugs with a $20 or less copay
High differentiation choice set
214.424
9545.455
34.618
200
920.455
Low differentiation choice set 1
81.971
5906.25
11.563
14.896
59.583
Low differentiation choice set 2
88.068
2500
11.563
6.563
53.333
Low differentiation choice set 3
62.394
2625
11.563
14.896
53.333
Low differentiation choice set 4
108.783
5906.25
11.563
6.563
28.533
Low differentiation choice set 5
84.259
2625
11.563
6.563
53.333
Low differentiation choice set 6
78.859
5906.25
11.563
14.896
53.333
Low differentiation choice set 7
57.875
2625
11.563
14.896
53.333
Low differentiation choice set 8
89.095
2625
11.563
14.896
53.333
Low differentiation choice set 9
89.630
5906.25
9.6
14.896
30.517
Low differentiation choice set 10
74.08
5625
9.6
6.563
51.667
Low differentiation choice set 11
82.037
2625
9.6
14.896
53.333
Low differentiation choice set 12
95.112
2625
9.6
6.563
28.533
Low differentiation choice set 13
115.087
5906.25
4.2
14.896
28.533
Low differentiation choice set 14
49.839
2625
4.733
14.896
53.333
Low differentiation choice set 15
58.613
2625
4.2
14.896
53.333
Low differentiation choice set 16
92.592
2625
4.2
6.563
53.333
Note: The table shows the variances for each 16-item choice set. There was one high differentiation choice set and 16 low differentiation choice sets.
Appendix B: Supplementary tables
Table B1: Variances of the attributes in the different choice sets.
Mean
Standard Deviation
Education
Less than High School
0.097
0.297
High School
0.316
0.465
Some college
0.264
0.441
Bachelor’s degree or higher
0.323
0.468
Self-reported health
Excellent
0.097
0.297
Very good
0.378
0.485
Good
0.369
0.483
Fair
0.139
0.347
Poor
0.017
0.128
Female
0.488
0.500
White Race
0.853
0.354
Married
0.716
0.452
Age (Range 65–89)
70.722
4.900
Annual Household Income
$5.000–$7.499
0.024
0.153
$7.500–$9.999
0.007
0.085
$10.000–$12.499
0.015
0.120
$12.500–14.999
0.018
0.134
$15.000–$19.999
0.050
0.217
$20.000–$24.999
0.084
0.278
$25.000–$29.999
0.068
0.252
$30.000–$34.999
0.083
0.275
$35.000–$39.999
0.073
0.261
$40.000 –$49.999
0.134
0.341
$50.000–$59.999
0.119
0.324
$60.000–$74.999
0.116
0.320
$75.000–$84.999
0.061
0.239
$85.000–$99.999
0.051
0.221
$100.000–$124.999
0.055
0.228
$125.000–$149.999
0.015
0.120
$150.000–$174.999
0.013
0.113
$175.000 or more
0.015
0.120
Note: N=545.
Table B2: Joint significance tests of age groups, education groups, and gender.
Change in choice outcome satisfaction
Change in choice process satisfaction
Change in perceived benefits
Change in perceived costs
Change in number of plans
0.129
0.032
0.032
0.089
[0.017, 0.240]*
[–0.082, 0.146]
[–0.095, 0.160]
[–0.021, 0.199]
Change in number of plans squared
–0.006
–0.002
–0.001
–0.002
[–0.012, –0.000]*
[–0.008, 0.004]
[–0.007, 0.006]
[–0.008, 0.003]
Change in perceived variety
0.835
1.042
1.118
–0.796
[0.419, 1.250]**
[0.580, 1.504]**
[0.565, –1.672]**
[–1.345, –0.248]**
Change in perceived variety squared
–0.095
–0.132
–0.113
0.102
[–0.141, –0.049]**
[–0.184, –0.079]**
[–0.175, –0.052]**
[0.042, 0.161]**
Constant
0.099
0.183
–0.096
–0.195
[–0.066, 0.264]
[0.006, 0.360]*
[–0.329, 0.137]
[–0.400, 0.010]
N
251
251
251
251
R2
0.14
0.14
0.12
0.11
F
8.19
7.26
6.39
7.93
Root MSE
1.32
1.4
1.79
1.64
Note: Regressions use two responses per individual and estimate the change in the dependent variable, regressing it on changes in the main independent variables. Other independent measures are constant within the individual and are not included in the model. * p<0.05; ** p<0.01
Centre for Economics and Finance, Faculty
of Economics, Rua Dr. Roberto Frias 4200–001, Porto, Portugal; and
Porto Business School, University of Porto, Avenida Fabril do Norte
425, 4460–312 Matosinhos, Portugal. Email:
hszrek@wharton.upenn.edu.
The author would like to thank Kate Bundorf with whom she designed the
experiment on which this study is based, the acting journal editor
Robin Hogarth, two anonymous reviewers, and several others who helped
at different points in the research process: Jon Baron, Abby King,
Claudio Lucarelli, and Kosali Simon for help when designing,
programming, or pilot testing the experiment and Monica Costa Dias, Rui
Leite, Elena Reutskaja, and Nuno Sousa Pereira for feed-back on early
drafts of the paper.
The intent
of dividing the participants into two conditions with different
levels of differentiation of characteristics was to experimentally
create conditions with higher and lower perceived variety. However,
the manipulation did not work - participants did not distinguish
between the two experimental conditions. For this reason I do not
distinguish between experimental condition in the analysis, nor
discuss this further. See Appendix A for more detail.
We showed that numeracy moderated the choice
overload effect and that increases in decision costs mediated it:
more numerate adults made better decisions than less numerate adults
when choosing among a small number of alternatives but when choice
set size increased their advantage dissipated. Here I find
corroborating results for choice difficulty — escalations in
choice difficulty arising from increases in perceived variety are
most highly concentrated in the most numerate respondents.