Previous research has demonstrated that consumers’ decisions
regarding supplementary pensions could be affected by biases.
Bernatzi and Thaler’s experiment demonstrated that menu design can
influence pension fund enrollment decisions, in that participants
appear to adopt a naïve heuristic, i.e., “extremeness aversion”.
Using a database of 27 occupational pension funds from 2007 to 2011,
representing 1,732,530 employees, this study asked whether menu
design affected Italian workers’ choices regarding the supplementary
pension system as a result of the new rules enacted by the regulator
in 2007. Most enrolled workers opted for the median investment
line. I discuss the possible relevance of this result to public
policy, in particular the possibility of including these preferences
in the regulations, with the aim of benefiting employees.
On 1 January 2007, the Italian government introduced an important and
wide-ranging reform of the pension system, designed primarily with
employees in mind, having the aim of increasing and developing the
supplementary pension scheme.1 The
reform, which was explained to employees by means of flyers and
announcements in the mainstream mass media, basically presented
workers with three alternatives to choose from, two explicit and one
tacit. The two possible expressed alternative options are:
a) to indicate the name of the pension fund the employee wants to
enroll with. This pension fund will collect the employee’s and the
employer’s contributions and accumulated severance pay;
b) to declare his/her willingness to leave accumulated severance pay
with the employing company and therefore decide not to enroll with any
pension fund. In this case, if the company has more than fifty
employees, the employer must switch the accumulated severance pay to
the “Treasury fund” held by the National Social Security Institute
(INPS).2
If the employee does not express any choice (so called
“tacit-members”), the tacit option works by providing automatic
enrollment with, and depositing of accumulated severance pay in, one
of the following alternative options:
1) the pension fund identified by collective agreement or by company agreement;
2) if point 1 does not apply, the pension fund that has the highest number of company employees;
3) if points 1 and 2 do not apply, the INPS Fund3, created and managed by
INPS.
Table 1: Number of Italian occupational pension funds related to
number of investment lines (2007-2011), drawn from the Covip Annual
Report (2007-2011) and Italian occupational pension funds’ balance
sheets (2007-2011)
Number of investment lines
2
3
4
5
Number of occupational pension fund plans examined
6
13
6
2
After choosing the pension fund in which to enroll, either
explicitly or tacitly, the worker is asked to choose one or more
investment lines4. Again, on the one hand, if the
employee decides not to decide (“tacit-member”), the
law5 identifies as the
default option the guaranteed line without any risk (no-risk
investment line). On the other hand, the members who make an explicit
choice (“explicit member”) decide which line to enroll in from those
available in each Italian occupational pension fund.
Past literature includes many studies by authors who have considered
how people made decisions in financial settings (Kahneman and Tversky,
1984; Kahneman and Knetsch, 1992; Levin et al., 2002; Kahneman, 2003)
and how people decide portfolio asset allocation, including that for
their supplementary pension. Bernatzi and Thaler (2002) in particular
found “extremeness aversion” in pension fund asset allocation
choices. Benartzi and Thaler found that menu design can influence
pension fund enrollment decisions. They asked UCLA plan participants
to select an investment from three different menus. The investment
lines offered ranged from A (low risk) to D (high risk). The first
menu included options A, B, and C; the second one, just options B and
C; the last one, options B, C, and D. Comparing options B and C, which
appeared in all three menus, 29% of participants preferred C over B
in the first menu; 39% in the second menu and 54% in the third
menu. This result shows that, in the first menu, where option C was an
extreme, it was the least popular; in the third menu, where option C
was the middle choice, it was the most popular. Thus Benartzi and
Thaler’s (2001) experiment demonstrates that participants appear to
use a naïve heuristic (i.e., “avoid extremeness”) rather than
maintaining a consistent set of well-ordered risk preferences. Bearing
in mind these results, the present paper aims to test whether the
explicit members in Italian occupational pension funds asset
allocation choices have been influenced by the menu design in order to
identify a middle option predominance.
The results presented in this paper expand the existing literature on
the topic of pension fund enrollment decisions considering a new
unexplored market, Italy, and at the same time, they could be taken
into consideration by the regulators, with the aim of benefiting
employees.
The paper is organized as follows: Section 2 presents the sample;
Section 3 presents the methodology and the results; Section 4 comments
on the main results obtained and concludes.
2 Data sample
The sample used in this paper was created from the list of
occupational pension funds identified and recognized by the Pension
Funds Supervision Commission (COVIP) (a total of 35) at the end of
2007, the year of the introduction of Italian pension reform . Those
no longer operating at the end of 20116 (two) were eliminated. The occupational pension funds
existing before 2007 which did not provide a guaranteed investment
line had to introduce one in order to be able to enroll the tacit
members, as provided for by law.7 For
this reason 2007 represents a year of strong discontinuity with the
past.
For each occupational pension fund, we analyzed the balance sheets
from the years 2007–2011 in order to gather information about: a) the
number and the types of investment lines offered in each fund; b) the
total number of subscribers at the end of each year examined; c) the
number of new subscribers enrolled during each year; d) the total
number of tacit members at the end of each year examined; and e) the
number of new tacit members enrolled during each year
examined. Therefore the occupational pension fund whose balance sheets
did not show the distinction between tacit and explicit members as
well as the total number of tacit members at year-end or the number of
tacit members acquired during the years examined were
eliminated. After this selection, of the original 33 Italian
occupational pension funds representing 1,988,639 members, our final
sample comprised 27 occupational pension funds (that is to say
81.82%), representing 1,732,530 members (87.12%) at the end of
2007. In order to assess the presence of predominant behavior in
Italian occupational pension fund asset allocation choices, only
expressed choices can be considered, given that the tacit members do
not express any choice but simply accept the default option determined
by law. For this reason, the total number of guaranteed-line members
was reduced by the number of tacit members. In addition, we consider
the Italian occupational pension funds based on the number of
investment lines offered by each one, as shown in Table 1.
In each occupational pension fund, investment lines are presented to
workers sorted by the level of risk, from no-risk (also called
“guaranteed line”) to higher risk, with increasing order. In fact,
according to the Pension Funds Supervision Commission (COVIP)
guidelines, the guaranteed line is the investment line without any
risk, so the expected loss by members is zero; the “very low risk
line” is the investment line for which the expected annual loss by
its members is maximum 10%; the “low risk line” considers the
possibility of maximum 30% expected loss per year; “balanced” is
the investment line for which the expected loss by its members is
(maximum) from 30% and 50%; “growth” is the investment line for
which the expected loss could be even higher than 50% per
year.8
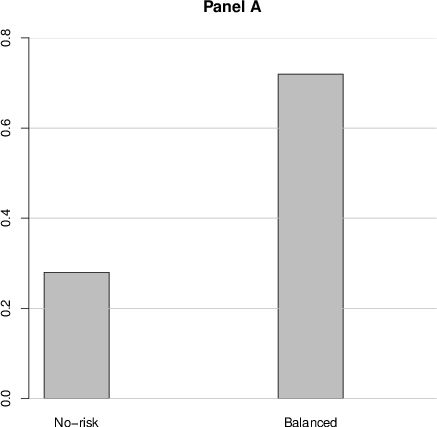
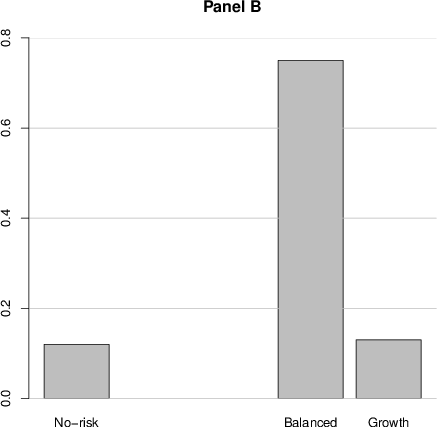
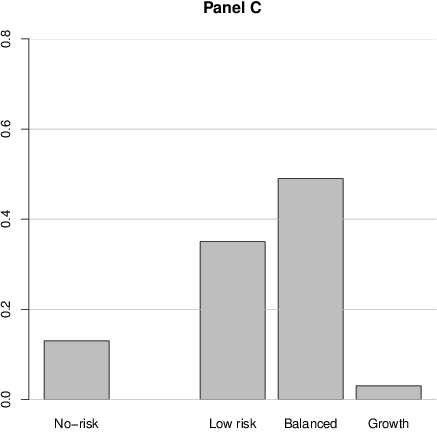
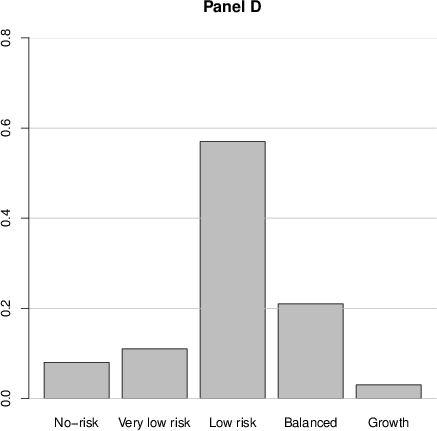
Figure 1: Subscribers distribution of the Italian occupational
pension funds investment line at year-end 2007–2011, elaborated by
the author based on the number of explicit members enrolled in
each investment line per Italian occupational pension fund
(year-end 2007-2011).
3 Methodology
The methodology used in this paper comprises two steps: Step 1
is designed to show the graphic evidence of the subscribers
distribution in investment line choices made by explicit members in
Italian occupational pension funds from 2007 to 2011; Step2
involves the econometric analysis of the graphic evidence identified
in Step1.
3.1 Step 1
Each Italian occupational pension fund is reserved for a defined
category of workers; if new workers join this category they can also
join the pension fund. In 2007, Italian workers were asked to choose
between the two, three, four and five investment lines respectively
offered by their occupational pension fund. Graph 1 shows subscriber
distribution over investment lines and years (2007–2011) for Italian
occupational pension fund enrollment. Initial consideration of panels
B, C, and D reveals graphic evidence of a strong middle option
predominance in Italian occupational pension fund asset allocation
choices.
Table 2: The middle choice predominance in Italian occupational pension funds
calculated by the HHI, calculated on the basis of the number
of subscribed members (year-end 2007-2011) taken from the balance
sheet of each Italian occupational pension fund.
Investment lines:
2
3
4
5
No-risk
805.93
134.47
169.15
36.44
Very low risk
117.84
Low risk
1218.32^*
2735.13^**
Medium risk
5128.14^**
5691.39^**
2378.31^**
695.17
High risk
168.02
11.03
19.74
Notes: * indicates medium concentration; ** indicates high concentration.
However, on the one hand, faced with an even number of choices menu,
panels A and C, in which there is a non-dominant choice, employees
tend to opt for an intermediate or compromise alternative (Tversky &
Simonson, 1993). In panel A only two alternative options are available
so a middle choice is not identifiable. In general, in a binary choice
polarization could occur (Chernev, 2004). In fact, as shown in panel
A, the medium risk alternative tends to attract most employees’
choices. However, in panel C there are two middle choices, not only
one; in this case employees tend to choose this two middle
alternatives. On the other hand, faced with an odd number of choices
menu, panels B and D, there is a strong middle choice predominance.
The graphic evidence is also confirmed by statistical analysis. In
particular, choice of the Balanced fund is significantly greater when
it is the middle option, in Panel B, than when it is one of two
options, in Panel A, for each of the 5 years, despite the fact that
some of those who choose the Balance fund in Panel A would have chosen
the Growth fund in B. Overall the difference was 75.8% vs. 71.4%,
again a small difference, but enough to be significant every year by a
χ2 test at p<10−10, because of the large number of
members.
Choice of the Low-risk fund was much greater when it was the middle
option, in Panel D (67.0% overall) than when it was not, in Panel C
(34.9%). Again this difference was highly significant in each of the
5 years. Preference for the middle option might be especially strong
when members have more options to choose from.
3.2 Step 2
Table 3: Description of variables, for data collected from each
Italian occupational pension fund’s balance sheet (year end
2007-2011).
Variable
Description
Dependent variable:
type
Investment line type, from 0 to 4. The investment
line risk increases from the guaranteed line (0)
to very high risk (4).
Independent variables:
sub
Total number explicit members at year end
sub2
Total number explicit members squared at year end
performance
Yearly performance for each line
t1, t2, t3, t4, t5
Time dummies (t1=2007; t2=2008; t3=2009; t4=2010; t5=2011)
Note: Other independent variables—such as:
the Total Expensive Ratio (TER) per investment line obtained from the
Covip web site; and the worker macro-categories obtained according to each Italian
occupational pension fund’s status—were included in the analysis,
but these variables (individually or included together) did not give
any results. For this reason they were eliminated.
To test in another way the appeal of the middle choice in Italian
occupational pension fund asset allocation choices, the Herfindahl
Hirschman Index (HHI)9 was calculated using the following equation:
HHI =
n
∑
i=0
(100 si)2
(1)
Table 4: Panel regression analysis of extremeness aversion(2007-2011)
In Equation 1, si, is the single investment line proportion per
different menu design, i is the investment line type from 0
(guaranteed line—no risk) to 4 (very high risk investment
line—growth). The use of HHI is the most appropriate. In fact each
Italian occupational pension fund is reserved for a defined category
of workers (if new workers join this category they can also join the
pension fund) representing its potential market; the investment line
opportunities offered in each fund are therefore in competition with
each other and they are presented to workers in order of increasing
risk; if the middle investment line/s is more attractive, a
predominance for the central choice is identifiable. The HHI results,
shown in Table 2, indicate a strong concentration in the middle
investment line/s in each occupational pension fund, except for the
two investment lines in which there is “polarization”.
The middle investment line is generally the most popular; this
situation is anomalous and can be explained by factors including the
influence of menu design on decision making and the inconsistent set
of well-ordered risk preferences (Simonson, 1989).
To test the existence of the middle option predominance, so as to
confirm the HHI results, an ordered logistic regression
(OLOGIT)10 is used as follows:
type = α sub + β sub2 + γ
performance +
d1t1 + d2t2 + d3t3 + d4t4 + d5t5 + ε
(2)
The dependent variable “type” assumes values from 0 to 4 according
to the investment line risk level. The OLOGIT model is justified to
test the presence of the predominant central investment line choice
bearing in mind that the menu design presents the investment lines
with a specific increasing risk level order. The variables used in the
model are shown and described in Table 3.
Considering the two-investment-line choice, the meaning of the
sub-squared coefficient indicates a growing trend of hyperbole to
confirm the polarization phenomenon. With reference to the other lines
(3, 4 and 5) the sub-squared coefficient is negative and statistically
significant, and the sub coefficient is positive and statistically
significant; this identifies a parabola with a peak, with the
confirmation of the concentration of explicit members’ choices in the
middle. Table 4 shows that investment line performance is not
statistically significant, that is to say that subscribers’ choices
are not influenced by it. This factor is important because it leads us
to the conclusion that the impact of investment menu design on
participant investment choices in Italian occupational pension funds
has a more powerful influence on the decision-making process than the
underlying risk and performance characteristics of the investment
lines offered (Benartzi and Thaler, 2002; Agnew and Szykman, 2005).
4 Conclusions
Bearing in mind the wide gap between the moment in which the choice is
made and the future time of “enjoyment”, a wrong or unsuitable asset
allocation choice in terms of pension funds could seriously compromise
the maintenance of living standards after retirement. The results
presented here show that many Italian occupational pension fund
subscribers opt for the middle option. Choices influenced by menu
design could often be contrary to rationality, not being dictated by
an awareness of risk profiles. In this context, the dilemma arises as
to which would be the optimal number of investment lines to make
available in occupational pension funds. A solution could be the
introduction of a life-cycle investment line, independently followed
by a manager who would change asset allocation depending on the
member’s age. The regulator could adopt this kind of investment line
for tacit members; at the same time it could consider standardizing
the number of investment lines in each occupational pension fund, for
example, five, the life-cycle line being in the middle. Further
research in this area could be a source of inspiration for Italian
(and other) regulators, exploiting these specific middle-favoring
biases to the subscribers’ benefit.
References
Agnew, J., & Szykman, L. (2005). Asset allocation and information overload: the
influence of information display, asset choice, and investor experience,
Journal of behavioral finance, 6, 57–70.
Benartzi, S., & Thaler, R. (2001). Naïve diversification strategies in defined
contribution saving plans, American Economic Review, 91, March,
79–98.
Benartzi, S., & Thaler, R. (2002) How much is investor autonomy worth?,
Journal of finance, 57, August, 1593–1616.
Chernev, A. (2004). Extremeness aversion and attribute-balance effects in
choice, Journal of consumer research, 31, 249–263.
Festinger, L. (1957). A theory of cognitive dissonance, Stanford C.A.:
Stanford University Press.
Gourville, J., & Soman, D. (2007). Extremeness seeking: when and why
consumers prefer the extremeness, HBS-working paper n. 07–092, May.
Kahneman, D. (2000a). A psychological point of view: violations of rational
rules as a diagnostic of mental processes, (Commentary on Stanovich and West),
Behavioral and brain science, 23, October, 681–683.
Kahneman, D. (2000b). Experienced utility and objective happiness: A
moment-based approach. In D. Kahneman and A. Tversky, Choice, values,
and frames. New York: Cambridge University Press.
Kahneman, D. (2003). Maps of bounded rationality: psychology for behavioral
economics. The American economic review, 93, 1449–1475.
Kahneman, D., & Knetsch, J. (1992).Valuing public goods. The purchase of moral
satisfaction, Journal of environmental economics and management,
57–70.
Kahneman, D., & Tversky, A. (1979). Prospect theory: an analysis of decision
under risk. Econometrica, 263–291.
Kahneman, D., & Tversky, A. (1994). Choices, values and frames, American
psychologist(39).
Kahneman, D., Knetsch, J., & Thaler, R. (1991). The endowment effect, loss
aversion, and status quo bias, Journal of economic perspectives, 5
, 193–206.
Levin, P., Gaeth, G., & Schreiber, J. (2002). A new look at framing effects:
distribution of effect sizes, individual differences, and independence of types
of effects, Organizational Behavior and Human Decision Processes,
88, 411–429.
Simonson, I. (1989). Choice based on reasons: the case of attraction and
compromise effects, Journal of consumer research, 16,
158–174.
Tversky, A., & Kahneman, D. (1981). The framing of decisions and the psychology
of choice, Science (211).
Tversky, A., & Kahneman, D. (1992). Advances in prospect theory. Cumulative
representation under uncertainty, Journal of risk and uncertainty, 5,
297–323.
Tversky, A., & Simonson, I. (1993). Context-dependent preferences,
Management science, 39, 1179–1189.
Department of Business Administration,
Faculty of Economics, Università Cattolica del Sacro Cuore
(Piacenza Site), Italy, Via Emilia Parmense 84, 29122 Piacenza
(Italy). Email: andrea.lippi@unicatt.it.
All pension fund statutes establish the
number and the types of lines in which the workers can
invest. Moreover, the statute stipulates whether it is possible to
diversify across lines or not.
In panel D, workers were removed not only when their
assignment was tacit according to government rules but also when
they were assigned to new lines as the result of a merger of two
companies. Many of these workers were assigned to the low-risk and
growth lines, which would have higher numbers if they were
included.
The HHI is designed to measure industry
concentration. The US Department of Justice associates the following
threshold values with the HHI for particular use: an HHI below 1,000
signals a low concentration, while one above 1,800 signals a high
concentration; an index between 1,000 and 1,800 shows a moderate
concentration.
Ologit fits ordered logit models of ordinal variable
on the independent variables. For example, to test if “health”
(0=bad; 1= not so good; 2=good; 3=very good) is depending by gender,
skin color and/or age an ologit regression can be used as follows:
ologit health female black white age.