Judgment and Decision Making, Vol. 8, No. 5, September 2013, pp. 577-588
Choice blindness in financial decision makingOwen McLaughlin * Jason Somerville # |
Choice Blindness is an experimental paradigm that examines the interplay between individuals’ preferences, decisions, and expectations by manipulating the relationship between intention and choice. This paper expands upon the existing Choice Blindness framework by investigating the presence of the effect in an economically significant decision context, specifically that of pension choice. In addition, it investigates a number of secondary factors hypothesized to modulate Choice Blindness, including reaction time, risk preference, and decision complexity, as well as analysing the verbal reports of non-detecting participants. The experiment was administered to 100 participants of mixed age and educational attainment. The principal finding was that no more than 37.2% of manipulated trials were detected over all conditions, a result consistent with previous Choice Blindness research. Analysis of secondary factors found that reaction time, financial sophistication and decision complexity were significant predictors of Choice Blindness detection, while content analysis of non-detecting participant responses found that 20% implied significant preference changes and 62% adhered to initial preferences. Implications of the Choice Blindness effect in the context of behavioural economics are discussed, and an agenda for further investigation of the paradigm in this context is outlined.
Keywords: choice blindness, investment, pensions.
The Choice Blindness paradigm is a novel experimental method which uses misdirection or sleight-of-hand to manipulate the relationship between intention and choice, by presenting decision-makers with outcomes they did not actually choose and eliciting a response (Johansson, Hall and Sikström, 2008).
The principle findings in the Choice Blindness literature are that many participants do not notice when their stated preferences are manipulated, even when factors such as attention, task engagement and social effects are taken into account (Johansson, Hall and Chater 2011). First demonstrated in a study examining preferences for female faces (Johansson, Hall, Sikström and Olsson 2005), Choice Blindness experiments have since been extended into various other domains, including naturalistic consumer choices (Hall et al. 2010), attitude formation and moral sentiment (Hall, Johansson and Strandberg 2012), polling and political preferences (Hall et al. 2013), symptomatology and psychiatric self-diagnoses (Merckelbach, Jelicic and Pieters 2010), and to other sensory modalities (Steenfeldt-Kristensen and Thornton, 2013). Choice Blindness studies to date have consistently found that only 20-35% of participants detect the manipulation of their preferences (Johansson, Hall and Chater, 2011).
The significance of Choice Blindness can be extended beyond the simple question of whether participants detect a manipulation. In their original study, Johansson et al. (2005) demonstrated not only that many participants failed to notice manipulation of their preferences but also that they could be induced to defend these altered preferences when asked to motivate their choice. These “confabulated” explanations were not qualitatively different from explanations of unaltered preferences, and in some cases, participants would confabulate explanations contradicting their original choices—mentioning details entirely absent from the images initially chosen.
The purpose of the present study was to devise a Choice Blindness experiment involving a significant and realistically framed economic decision. In addition, we examine the factors that underlie and modulate it. This is an area which the existing literature has had some difficulty addressing (Johansson, Hall, and Sikström, 2008). Therefore the design was also intended to isolate a variety of factors intuited to underlie the Choice Blindness effect.
An economically significant class of decision was examined through a design featuring decisions about personal finance, specifically the choice of a pension. Pensions are a very familiar topic in behavioural economics (e.g., Madrian and Shea 2001, Thaler & Benartzi 2004, Tapia & Yermo 2007) in part because they represent a class of decision with important ramifications for both individual welfare and the future stability of an economy. Moreover it is an area in which traditional economic theorising has failed to adequately anticipate the financial decisions of agents, as evidenced by the abundance of chronically underfunded pension schemes (Thaler & Benartzi, 2004).
Pension decisions are also relatively accessible (if not familiar) because most individuals will make at least one such decision in their lifetime. Pensions also represented a topic of particular local relevance both before and during the time the study was conducted, as Ireland was then preparing to implement wide-ranging pension reforms and introduce an autoenrollment program (National Pensions Framework, 2010).
Furthermore, a pension paradigm requires participants to construct a portfolio of options, a task of greater complexity than the binary choices presented in most previous Choice Blindness studies. This has the potential to elicit richer and more nuanced responses from participants, and this added granularity is of crucial importance in evaluating confabulatory responses, and so distinguishing instances of significant preference change from responses motivated by inattention to specific choice characteristics or lack of engagement.
The design was intended to replicate the conditions, materials and appearance of actual personal finance decisions with maximum accuracy, so as to elicit as great a degree of participant engagement as possible within the confines of a hypothetical scenario. The presence of a Choice Blindness effect consistent with previous findings was thus the study’s primary hypothesis.
Additionally, the design built on previous Choice Blindness experiments by including a variety of auxiliary measures, enabling the investigation of a range of factors with the potential to influence the prevalence of Choice Blindness, represented by participant detection rates. Measures were included to evaluate participant reaction time, memory and task recall, risk preferences, and financial sophistication. The design also included cheater-detection priming for some participants. Reaction time was recorded as the time taken (in seconds) for a participant to complete each trial.
Reaction time was intended as a proxy measure for the degree of care and attention participants applied to the task. It was hypothesized that participants who spent longer on the task would be more likely to detect manipulations.
A brief memory task was administered to participants at the end of the experiment, just prior to debriefing. The task involved answering five simple questions about the task, of increasing sophistication and “difficulty”, and recorded as a score out of five. This instrument was intended primarily to address the theory that Choice Blindness represents a memory effect, in which participants appear to reverse their preferences because they do not recall their initial choices clearly (Johansson, Hall and Sikström 2008). A positive relationship between detection rate and recall accuracy would be expected in this case.
The experiment also included a brief risk profile (adapted from Holt & Laury, 2002) as well as a self-report measure of participants’ preferences for risk. We hypothesized that participants with a lower risk preference would be more cautious and reflective, and therefore more likely to detect a manipulation. Additionally, findings from an initial pilot study suggested that familiarity with the subject matter would provide a strong influence on detection rates, in accordance with previous findings on biases in financial decision-making (e.g., Feng and Seasholes, 2005).
The design therefore included a brief financial sophistication instrument (Lusardi & Mitchell, 2006), which has proven to be a robust proxy for general knowledge of financial issues such as personal finance. It was hypothesized that greater financial knowledge would increase detection rates. Half of the participants were assigned to a condition in which a subtle cheater detection prime was inserted into the experiment’s introductory literature, and it was hypothesized that this group would be more likely to detect manipulations.
A total of 100 participants (53 female) were recruited for the study, ranging in age from 18 to 60 years (mean = 24.69, SD = 7.33). 41 were undergraduate students, with the remainder being graduate students and professionals ranging from basic degree to Ph.D. level of educational attainment. Participants were recruited through various forms of public advertising on university campuses. The study was advertised as an investigation into the factors affecting decisions about personal finance, and all participants were initially naive as to the experiment’s true purpose.
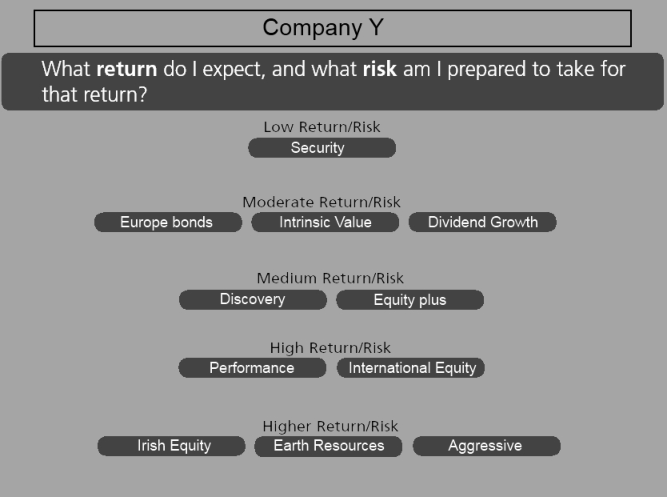
The primary materials consisted of two pages outlining the investment options (which numbered between ten and twelve) offered by one of six fictional pension companies. One page depicted the options graphically in a tiered format, from low risk to high risk. The other briefly explained each option in relatively simple language consistent with the vocabulary observed in actual financial prospectuses. The overall presentation was modelled closely on the explanatory materials provided by actual pension funds in the Republic of Ireland to new and prospective clients. An example of the experimental stimuli can be found in Appendix A.
Additional materials consisted of an information and briefing sheet, a short six-question financial literacy survey (adapted from Lusardi and Mitchell, 2006), a basic demographic questionnaire, and a one-question risk preference instrument (adapted from Holt and Laury, 2002). Participants in the cheater-detection condition were given a slightly different briefing sheet, in which the paragraph regarding auto-enrolment in Ireland in 2014 contained the following additional sentence as a cheater-detecting prime:
However, concerns have been raised in some quarters about the security and fairness of an auto-enrolment system for pensions, particularly the possibility that they may afford employers greater opportunity to cheat their employees by changing their preferences or opting them out of the system without their consent.
During the experiment proper, participants indicated their choices using a simple response sheet instructing them to choose between three and six options and allocate a percentage of their hypothetical investment to each one. All experimental materials are reproduced in Appendix B.
The experimenters themselves made use of a two-monitor computer system, with one display facing the participant. Participant responses were entered by an experimenter into a specialized interface which was designed to facilitate data entry, presentation and manipulation as quickly as possible, so as to minimize both memory degradation effects and participant suspicion.
Following the general pattern of previous studies (e.g. Johansson et al. 2005, Hall et al. 2010) the experiment was administered by two experimenters, one who interacted directly with the participant and presented the physical materials and another responsible for notation and computerized data entry.
At the beginning of the experiment, participants were shown an information sheet explaining the ostensible purpose of the study (“to investigate some of the different factors which affect people’s choice of a pension plan”) and providing some simple background information on what pensions are, how they work, and how proposed auto-enrolment schemes in the future make them relevant to everyday life. Each participant was also allocated to a cheater-detection (CD) or non-CD condition, and given the explanation with or without the CD priming paragraph as appropriate. The brief demographic questionnaire, risk preference profile, and financial sophistication survey were then administered before the actual experiment began. The experimenters also recorded each participant’s responses on a hand-held recording device, for the purpose of qualitative analysis.
The experiment featured five trials, each featuring the materials for one of the six simulated companies. The first, third and fifth of the five trials were standard: The participants chose a portfolio, which was then presented to them on-screen for comment, just as they had chosen it. The second and fourth trials were manipulated—participants were shown a portfolio in which one item differed from the one they actually chosen at the beginning of the trial. The second trial was a manipulation of the similar condition, and involved the second experimenter replacing one of their selections, chosen at random, with another fund on the list of similar type and risk return profile, and differing primarily in investment type and name. The fourth trial represented the dissimilar condition: here the experimenter randomly replaced one of the participant’s choices with another fund from the list of significantly different character and risk profile—that is, an option significantly more (or less) risky than the original choice.
The order in which the trials themselves were presented was not varied, as the design assumes (following the findings of previous Choice Blindness experiments, e.g., Johansson et al,. 2005; Hall et al. 2010) that the detection threshold for the similar condition is lower than for the dissimilar condition. Therefore it is implicitly assumed that any participant who detects a manipulation in the similar condition (i.e., the one more difficult to detect) would also detect a dissimilar manipulation, and the experiment was concluded once any detection was observed. Proceeding with this assumption was also deemed more efficient as it maximized the number of trials per participant.
On each trial, participants were given the pension fund materials for one of the six fictional companies, chosen at random by the experimenter. Participants were instructed to allocate their hypothetical pension contribution between these fund options, selecting a portfolio of between three and six different funds, and attributing a percentage to each one. Participants were encouraged to take as much time as they needed to make a decision, and indicated their choices by filling in a response sheet. On completion of each portfolio, the participant returned this sheet to the experimenter, and the explanatory materials were also withdrawn.
The first experimenter then explained that the selected portfolio would be displayed on the monitor facing the participant, who would then be asked to explain the selection of each fund in the portfolio, while the second experimenter quickly entered her chosen portfolio into the computer. At this point in the second and fourth trials, the experimenter also made the appropriate similar or dissimilar manipulation. The result, with or without manipulation, was then displayed in a simple graphical format on the monitor facing the participant. The average time between participants handing over a response sheet and their portfolio being displayed back to them was approximately 5 seconds. In order to control for possible primacy or recency effects, all selected portfolios (manipulated or not) were presented to participants in a randomized order. Participants were then invited to comment on their portfolio, and were free to do so at their leisure.
The experimenter’s responses were limited to simple verbal prompting of the participant for more detail when required, and participants were not specifically asked if the pension portfolio shown was the same one they chose. During the explanation of fund choices, if a participant pointed out or otherwise expressed notice of a mismatch, the experiment ended and the participant was debriefed at the end of that trial. Following the established paradigm, such a result was recorded as concurrent detection. Debriefing involved explaining the actual purpose of the experiment and the deception/manipulation which it involved. Immediately before debriefing, all participants, detected or not, were asked a series of 5 memory questions designed to evaluate their recollection of and attention to the task.
If the participant finished explaining fund choices without any such evidence of detection, the trial was concluded and the next trial began, featuring a different set of stimuli (i.e. a different company’s brochure). Participants who proceeded through all trials without detecting a mismatch were told that the experiment was almost over and would conclude after a few brief questions. Consistent with previous studies, participants who had not detected any mismatch were then asked a series of increasingly specific questions designed to elicit how confident they were of their choices and whether they had noticed anything suspicious or unusual during the experiment. The questions were as follows:
Any affirmative answer to the these question was recorded as retrospective detection. Finally, participants who showed no retrospective detection were explicitly asked whether they believed they would notice any hypothetical manipulation of their choices. Once these questions had been asked, all participants were fully debriefed.
Table 1: Raw correlation matrix.
(1) (2) (3) (4) (5) (6) (7) (8) (9) (10) (11) (12) Detection (1) 1.00 . . . . . . . . . . . Memory task (2) 0.09 1.00 . . . . . . . . . . Cheater detection (3) -0.08 -0.10 1.00 . . . . . . . . . Risk [self report] (4) 0.02 0.10 -0.08 1.00 . . . . . . . . Risk [survey] (5) -0.01 0.04 -0.05 0.55 1.00 . . . . . . . Financial sophistication (6) 0.09 0.00 0.01 -0.07 -0.14 1.00 . . . . . . Pension (7) -0.18 -0.12 0.03 0.07 -0.16 0.38 1.00 . . . . . Education (8) -0.08 -0.02 0.15 -0.05 -0.07 0.22 0.40 1.00 . . . . Gender (9) 0.06 -0.08 0.21 0.00 -0.01 0.21 0.01 -0.07 1.00 . . . Age (10) 0.00 -0.21 -0.12 0.14 0.03 0.18 0.38 0.23 -0.09 1.00 . . No. Funds picked (11) -0.12 0.04 0.06 0.08 0.00 0.01 0.09 -0.04 0.07 0.03 1.00 . Reaction time (12) 0.13 -0.03 0.05 0.00 -0.06 -0.02 -0.02 -0.09 0.04 -0.01 0.18 1.00
The experiment produced 100 sets of individual data across all experimental conditions, in addition to demographic and instrumental information. The data for two participants who withdrew before completing the experiment were discarded, leaving a final total of 98.
The principle descriptive data in this study were the number of detections (both concurrent and retrospective) registered in both the Similar and Dissimilar manipulated conditions. In the Similar condition, only 24.5% of responses feature detection of portfolio manipulation. In the Dissimilar condition, 33.8% of responses detect the manipulation. However, if we assume that the 24 participants who detected the Similar mismatch would have also detected the Dissimilar mismatch, this figure increases to 50%. We can thus view a 33.8% detection rate as a lower bound estimate in the dissimilar condition and 50% as an upper bound estimate. Combining the Similar and Dissimilar figures, we find an overall detection rate across all conditions ranging from 28.5% to 37.2%, depending on the bound.
The difference in detection rates between Similar and Dissimilar manipulations was statistically significant when compared using a simple t-test (p<0.01). This result is driven largely by our assumption that participants who detected Similar manipulations would have also detect Dissimilar manipulations. If this assumption is not made, these 24 participants could be removed from the sample and the groups compared; however it is highly unlikely that the propensity to detect for these individuals is equal to the sample mean detection rate. Nonetheless, caution is required when interpreting this result.
It should also be noted that retrospective detection (in which participants register a complaint that would qualify as detection after the fact or during debriefing) was very rarely observed in this study, occurring in only six instances overall. The overall detection rates thus closely resemble those for concurrent detection alone.
The second empirical goal was to assess the factors that mediate detection rates. Inspection of the raw correlations provides a number of suggestive results (Table 1). Detection (defined here as either concurrent of retrospective) exhibited a positive association with reaction time, level of financial sophistication, and the memory task. Conversely, having a pension and the number of funds selected were negatively associated with detection rates. Several other correlations are of note. First, the degree of co-movement between our two risk preference measures was very high (55%). Second, the magnitude of the relationship between being enrolled in a pension and financial sophistication was relatively high (38%). While speculating on any causal association is beyond the scope of this paper, omitting either variable from the regression analysis is likely to bias the results.
To isolate the effects of the main independent variables of interest on Choice Blindness detection, a random effects logistic regression model was estimated. The dependent variable was a binary variable indicating whether detection (either concurrent or retrospective) occurred. Both Similar and Dissimilar conditions were included in the analysis. The main explanatory variables of interest were memory task performance, the presence of the cheater detection prime, risk preference (survey), financial sophistication (a proxy for familiarity effects), the number of funds selected (a proxy for decision complexity) and reaction time (which is taken as a indicator of task engagement). Control variables were also included for age, gender, education and pension enrolment. The results are presented in Table 2.
Table 2: Random effects logit model. Dependent variable is Detection (1=yes; 0=no). [flushleft] † p-values correspond to one-tailed hypotheses (with the exception of the control variables—gender, age and pension—which are computed using a two-tailed hypothesis.) * p <.05 ‡ Marginal effects computed at the mean. Variable key: Gender (1=female, 0=male); Pension (1=yes 0=No); Cheater detection (1=yes 0=No); Reaction time (in minutes); Financial sophistication (0 (lowest) – 5 (highest)); Memory task (0 (lowest) to 5 (highest)); Risk survey (1 (risk averse) – 5 (risk seeker)); Education (1 (lowest) to 10 (highest); Number of funds picked min 3 – max 6.
Age 0.031 0.250 0.006 Gender 0.307 0.428 0.059 Pension -1.780* 0.010 -0.249* Cheater detection -0.308 0.207 -0.059 Reaction time 0.210* 0.021 0.04* Financial sophistication 0.421* 0.029 0.08* Memory task 0.254 0.114 0.048 Risk survey -0.061 0.355 -0.012 Education -0.038 0.378 -0.007 No. of funds picked -0.315* 0.046 -0.060*
A number of intuitive results emerge from these data. Firstly, reaction time was positively related to detection rates (p<0.05), suggesting that the more engaged a participant was in the task, the more likely they were to detect a manipulation. Financial sophistication, which can be interpreted as a proxy for familiarity, exhibited a positive relationship with detection rates (p<0.05). Finally, the number of funds selected for each portfolio was negatively associated with detection (p<0.05), implying that manipulations were less likely to be perceived as portfolios became more complex. Memory task performance and the cheater detection prime did not affect detection statistically (p>0.05).
The marginal effects, presented in the third column of table 2, provide a more intuitive interpretation of these results. For each additional minute spent constructing portfolios, participants were 4 percentage points more likely to detect a manipulation. Each additional question answered correctly on the financial sophistication questionnaire corresponded to 8 percentage point increase in detection. For portfolio complexity, adding one extra fund reduced the probability of detection by 6 percentage points. Finally there was a large (and statistically significant) discrete effect for the pension dummy variable—those enrolled in a pension were 25 percentage points less likely to detect a manipulation. Possibly they were less interested in the task.
The experiment featured a total of 398 experimental trials over its 98 participants, each with an associated audio recording of the participant’s response. Participants spent an average of 4.7 minutes constructing each portfolio, and described each choice with an average of 11 words. 174 trials involved a preference manipulation. Of these, 43 trials were detected by the participant concurrently, and 10 more in retrospect. A further 6 responses were dropped due to recording errors. The remaining 115 responses represent instances where the original choice was manipulated, but not detected by the participant. Responses in this “choice blind” group contained 13.2 words on average, but these participants spent slightly less time contemplating each choice, at 4.4 minutes on average. Given that the average participant selected approximately 4 funds per portfolio, this amounts to a very rich data source and reflects the degree of involvement demanded by the task.
Analysis of these responses identified 6 categories into which the responses fell: (1) Major confabulations; (2) minor confabulations; (3) descriptions of original choice; (4) bunched or undifferentiated responses; (5) spurious explanations; and (6) no explanation. To confirm reliability, the response data ratings were then submitted to three independent raters, who categorized the responses separately. Inter-rater reliability was assessed and was found to be consistently high, with 71% agreement, and a Fleiss kappa value of 0.52. Furthermore, when the categories are grouped into confabulatory responses (1 and 2), descriptions of original choice (3), and no clear explanation (4, 5 and 6), we observe 76.1% agreement and a Fleiss’ kappa of 0.58. Both of the reported kappa values were significant at the 1% level. The results of this analysis are presented in Table 3.
Table 3: transcripts of verbal reports.
N % Examples Original Choice Major 7 6.10% "The same with the Asia-100 Tiger, they’ve got a big boom Fortis Bond (Low risk, US and confabulation (1) going on there and it does seem sustainable." European bonds) "I liked the fact that the Quadrivium fund had a real Finesse (Moderate risk, balance between lots of different risky instruments." actively managed fund) "Asia-Pacific Equity I liked because I like the idea of Cautious Bond Fund (Low investment of there." risk, no specific locality) Minor 16 13.90% “It said there wasn’t as great risk as others, but wasn’t Prudence (Low risk, explicitly confabulation (2) government based which I liked." government bond based) "Accelerated Equity, kind of like Corporate Bond, it looked Blue Chip (Low risk, stable good. There was a good balance between risk and yield." intrinsic value fund.) "Medium risk level." Cautiously Managed (Low to Moderate risk (Medium is explicitly a higher category) Description of 71 61.70% "I picked the Futura Biotech because it was based with Fortis Bond (Low risk, US and original choice (3) European government bonds. It wasn’t the safest but it was European bonds) still very safe and only invested in developed countries." "The Accelerated Equity fund was a sure-fire thing, and I Assurance (Low risk, risk- wanted some money to balance against the Infinity which minimal stability fund) was very high-risk." "Performance Equity... well property is never really loss, Global Property (Property- and there was a guaranteed return." based investments) Bunched 6 5.20% "The other 65% went into medium risk options, where there Resolution explanation (4) was a decent chance of reward." "I invested the two lowest-risk assets because I didn’t really Cautious Bond fund trust this market." Spurious 10 8.70% "I put down a third one to meet the minimum of three." Long Bond fund explanation (5) “I had on safe one as usual... I’m trying to recall the name... Balanced fund Yeah, Trilogy." No explanation (6) 5 4.30% …
The study’s principal finding was that across all conditions 28.5% to 37.2% of manipulated trials were detected by participants. Even with the most detection-favourable conditions and sampling assumptions, only 50% of manipulations were detected. This is in line with the main hypothesis, and also consistent with the findings of previous Choice Blindness experiments (Johansson et al., 2005, Hall et al., 2010), suggesting that the Choice Blindness effect does indeed extend into the domain of personal finance choices. Such findings offer further support for the proposition that Choice Blindness is a general cognitive effect, which can exist irrespective of the specific nature of the decision.
The study also considered a number of auxiliary measures intended to isolate some of the factors which might predict the presence of Choice Blindness—reaction time, recall accuracy, risk preference, financial sophistication and the presence or absence of cheater detection primes. Given that the design offered participants some freedom to choose portfolios of greater or lesser complexity, the number of funds chosen in each portfolio was also considered.
Regression analysis of these factors found both reaction time and the number of funds picked to be significant predictors of detection, and the magnitude of these effects is relatively large. The Ordinary Least Squares (OLS) specification perhaps gives the most intuitive interpretation of the results, implying that for each additional minute a person spends contemplating their initial decision, they are 4.0 percentage points more likely to detect a subsequent manipulation. Similarly for each additional fund selected, a person is 6.8 percentage points less likely to notice a manipulation of their portfolio. Recall accuracy, risk preference, and cheater detection were not found to be significant predictors.
The significance of reaction time (i.e., the time a participant took to select a portfolio) is an encouraging result. It makes sense that participants who take longer to choose are attending more carefully to the decision, and that reaction time can be interpreted as at least a partial proxy measure of that degree of care.
In their original study, Johansson et al. (2005) controlled reaction time across three conditions (participants were either given two seconds to make a choice, five seconds, or as long as they wished) and found detection rates to increase when unlimited time was allowed (Johansson et al., 2005). It is heartening to see this finding still holds in the present study’s more complex and naturalistic decision environment. More importantly, such a finding is consistent with general observations that cognitive attention and engagement can ameliorate the effects of bias (Kahneman, 2011), and Choice Blindness functions similarly to other cognitive biases of decision-making in this regard.
The significance of the number of funds selected by the participant is again intuitive. A manipulation of one of three options is more conspicuous that one of six. Earlier Choice Blindness studies have generally limited themselves to experiments involving straightforward, binary choices (Johansson, Hall & Chater, 2011). In designing this study, however, it soon became apparent that such a format was not consistent with the goal of a plausible, naturalistic experiment in the context of personal finance, and that a multi-attribute, free-choice environment—itself an extension of the paradigm—would be required.
The significance of a financial sophistication effect (i.e., a familiarity effect) is likewise a highly intuitive finding, suggesting that Choice Blindness can be ameliorated by familiarity with a particular domain.
The null results for the other auxiliary measures also merit brief consideration. The absence of a recall or memory effect (a correlation between better recall of task details and detection, for example) is of note in light one of the most straightforward objections to the Choice Blindness phenomenon, namely that it represents a simple failure of memory or confusion effect and that no real confabulation or preference change occurs. The link between choices and recollection is not always straightforward (Henkel & Mather, 2007), and the instrument used to measure task recall in this instance was admittedly imperfect, but some relationship would nevertheless be expected if this explanation were accurate (Johansson, Hall & Sikström 2008).
The absence of any risk-preference effect is similarly interesting, given that the experiment provided participants with choices along a risk-and-return spectrum. It may be that the relationship intuited between (financial) risk aversion and general cautiousness and care-taking was overestimated here. The inclusion of a cheater-detection condition was a somewhat speculative inclusion, and the null finding here may be due to insufficient priming, or the lack of any overtly suspicious behaviour by the experimenters (the relative rarity of retrospective detection, in which participants admit to being suspicious only at the end of the experiment, would support this interpretation).
Following previous studies (Johansson et al., 2005, 2006) qualitative analysis was conducted by transcribing the verbal explanations provided by participants, isolating those involving undetected manipulations (i.e., those that were choice blind), classifying them into categories, and ensuring the reliability of such classification through a panel of independent raters. Such an approach is particularly important in gauging the strength of the Choice Blindness effect—statistically, participants are said to be “choice blind” if they fail to either explicitly or implicitly detect a manipulation when asked to explain their preferences, regardless of what (if any) alternative explanation they provide. By analysing the responses of participants in greater detail, the finding of the statistical presence of Choice Blindness can be given much greater texture and substance, something that is crucial if we are to distinguish instances of significant preference reversal from inattention, lack of well-established preferences, or disengagement with the experimental task.
The 115 non-detecting responses were categorized as major confabulations, in which the participant provides significant details only relevant to the manipulated choice (for example, expressing a preference for investing in Asian markets when their original choice had been explicitly European or US-only), minor confabulations, in which the participant provides at least some detail contradicting their original choice (e.g., expressing a preference for risky options when their original choice was explicitly low-risk) or descriptions of original choice, in which the explanation is clearly applicable to their original decision. The other, miscellaneous categories were bunched explanations (in which the participant’s explanation is too general to yield any specific details about the particular option manipulated), spurious explanations (in which the participant does not give any coherent or relevant information) and no explanation (in which the participant is silent, trails off, or is otherwise unable to respond).
Aggregate ratings of these responses (of choice–blind participants on manipulated trials) found that 20% of responses were notable confabulations displaying some degree of preference change, while 62% were descriptions of the participant’s original choice. Generic, incoherent or empty explanations accounted for the remaining 18%. It should be noted here that raters were instructed to err on the side of caution in case of any ambiguity (e.g., detail which could conceivably apply to either the original or manipulated choice), so the estimates of confabulation and preference change are necessarily conservative.
Taken together with our quantitative findings, these results suggest a multitude of factors underpinning the Choice Blindness effect in this context. 20% of responses show evidence of genuinely unstable preferences, to the extent that they can be induced to take ownership of choices completely inconsistent with their original preference. Conversely, 18% of responses were clearly results of lack of engagement with the task, and whether this is an artefact of the experimental context, the specific subject matter (i.e. pensions) or other factors is unclear. The most contentious interpretation concerns those responses which consistently explain manipulated choices with details of the original choice, but which are not consistent with the makeup of the portfolio actually received. These participants appear to be attending to the task (as evidenced by the amount of time spent and number of words used to describe the decision), but also appear inattentive to the specific characteristics of individual choices. This may appear inconsequential in instances where the overall risk profile remains unchanged. However, in other circumstances participants appear indifferent in the face of profiles with dramatically altered risk levels, highly inconsistent with their original preferences—a finding of some practical concern. Overall, the qualitative evidence presented here suggests that the observed Choice Blindness is a pervasive cognitive bias driven by a combination of weak or unstable preferences and inattention to specific choice characteristics.
We now consider a number of issues these results raise for the existing literature. Firstly, from a practical standpoint, these findings emphasise the importance of ensuring that choices and options in important contexts are as clear and unambiguous as possible. The materials featured both distinct, immediately memorable and more generic or vague-sounding options, all closely based on extracts from actual pension plans, and it is evident from the results that larger numbers of the latter serve to reduce detection rates. In a more general sense, the finding that a majority of people can fail to detect portfolio manipulations underscores the importance of an optimal default option in any auto-enrolment pension system.
We have also previously discussed the possible theoretical implications of Choice Blindness for economic theories of preference, from a behavioural perspective in particular. Previous Choice Blindness researchers have similarly noted that the effect raises questions for economists “to ponder in their modelling” (Hall et al., 2010). However, great care must be taken when drawing even mild conclusions from such tentative results, and a full discussion of these issues is beyond the scope of this paper in any case. These findings do, however, suggest several important directions in which Choice Blindness could profitably be extended into the economic domain. Three areas are worth discussing in particular.
Firstly, it would prove valuable to examine this effect in a variety of different decision domains. Decisions about pensions are certainly among the most significant economic choices most individuals will ever make, but they are hardly the most familiar or salient to most people in any general sense. If agents have “stronger” and more defined preferences for some decisions relative to others, it would be important to investigate the extent to which Choice Blindness holds in different contexts—does someone who easily detects manipulations in one context perform similarly in others? Choice Blindness has potential to be a valuable instrument for drawing out “preference maps” and differentiating areas in which preferences are strongly or weakly held—and by extension the contexts in which they are most malleable.
Secondly, more research is needed to establish the longevity of Choice Blindness effects, particularly in situations in which significant confabulations or preference reversals arise. For example, do confabulated preferences persist when tested over the longer term?
Finally, and most importantly, we believe there is a particular need for Choice Blindness studies which effectively incentivize their participants. Incentivisation is a difficult issue to navigate, and often a challenge in behavioural economic research (see discussion in Read, 2005), but in our view it is absolutely critical that this challenge be taken up. No matter how realistic its premise or context, a hypothetical decision will always be a hypothetical decision, and choice data from participants who know that their decision has no real consequences can tell us only so much, particularly in a field that values monetized decisions so highly. Well-constructed field experiments such as (Hall et al., 2010) go some considerable way towards addressing this issue, but still fall short of the critical point of material consequences.
An experiment with “real” decisions of true significance might be impossible, but it should be possible to devise designs with even rudimentary monetary consequences for participants. Until this situation is examined, there will remain significant limits on what can be said about Choice Blindness and economic ideas of preference and choice.
Feng, L., & Seasholes, M. (2005). Do investor sophistication and trading experience eliminate behavioral biases in financial markets? Review of Finance, 9, 305–351.
Hall, L., Johansson, P., & Strandberg, T. (2012). Lifting the veil of morality: Choice blindness and attitude reversals on a self-transforming survey. PLoSONE, 7, e45457.
Hall, L., Johansson, P., Tärning, B., Sikström, S. & Deutgen, T. (2010). Magic at the marketplace: Choice blindness for the taste of jam and the smell of tea. Cognition, 117, 54–61.
Hall, L., Strandberg, T., Pärnamets, P., Lind, A., Tärning, B., & Johansson, P. (2013). How the polls can be both spot on and dead wrong: Using choice blindness to shift political attitudes and voter intentions. PLoSONE, 8, e60554.
Henkel, L. & Mather, M. (2007). Memory attributions for choices: How beliefs shape our memories. Journal of Memory and Language, 57, 163–176.
Holt, C., & Laury, S. (2002). Risk aversion and incentive effects. American Economic Review, 92, 1644–1655.
Johansson, P., Hall, L., & Chater, N. (2011). Preference change through choice. In R. Dolan, & T. Sharot (Eds.), Neuroscience of preference and choice: Cognitive and neural mechanisms. New York: Academic Press.
Johansson, P., Hall, L. & Sikström, S. (2008). From Change Blindness to Choice Blindness. Psychologia, 51, 142–155.
Johansson, P., Hall, L., Sikström, S. & Olsson, A. (2005). Failure to detect mismatches between intention and outcome in a simple decision task. Science, 310, 116–119.
Johansson, P., Hall, L., Sikström, S., Tärning, B., & Lind, A. (2006). How something can be said about telling more than we can know: on choice blindness and introspection. Consciousness and Cognition, 15, 673–692.
Kahneman, D. (2011). Thinking fast and slow. Allen Lane.
Lusardi, A. & Mitchell, O. (2006). Financial literacy and planning: Implications for retirement wellbeing. MRRC Working Paper, n. 2006–144.
Madrian, B. & Shea, D. (2001). The power of suggestion: Inertia in 401(k) participation and savings behavior.Quarterly Journal of Economics, 116, 1149–1187.
Merckelbach, H., Jelicic, M., & Pieters, M. (2010). The residual effect of feigning: How intentional faking may evolve into a less conscious form of symptom reporting. Journal of Clinical and Experimental Neuropsychology, 33, 130–139.
National Pensions Framework (2010). Irish Government Publications Office, Dublin.
Read, D. (2005) Monetary incentives: What are they good for? Journal of Economic Methodology, 12, 265–276.
Steenfeldt-Kristensen, C. & Thornton, I. (2013). Haptic choice blindness. i-Perception, 4, 207–210.
Tapia, W. & Yermo, J. (2007). Implications of behavioural economics for mandatory individual account pension systems. OECD Working Papers on Insurance and Private Pensions, 11. OECD.
Thaler, R. & Benartzi, S. (2004) Save more tomorrow: Using behavioral economics to increase employee saving. Journal of Political Economy, 112, S164–S187.
Security fund - This fund offers peace of mind by providing a guaranteed stream of low, but stable, returns. Funds are invested in deposit schemes at financial institutions and various short-term debt instruments.
Europe bond fund - This fund invests in investment grade European sovereign bonds with maturities between 1 and 30 years. This provides steady returns with a minimal degree of risk. As these are denominated in Euros, currency risk is eliminated.
Intrinsic value fund - This fund investments in equities based on strong fundamentals. All stocks are supported by a strong brand name and/or product range; each company has a sustainable business model; companies demonstrate strong return on invested capital; a strong management record exists and there is intrinsic value in current share prices.
Dividend growth fund - Indicative equity range is 80% to 100% of the value of the fund. This fund invests in international equities, the dividend yields of which tend to be higher than their markets’ dividend yield. The fund, which is well diversified, seeks to invest in high calibre equities and suitable dividend payments.
Discovery fund - The Discovery fund invests in a diversified portfolio of medium sized European and US companies to achieve long-term capital growth. The fund objective is to identify quality companies that have established profitability early in their life cycle and to stick with them through their core growth phase.
Equity plus - Indicative equity exposure: 50% of the value of the fund. The objective is to achieve capital growth through investment in equities issued by companies worldwide, while protecting capital through purchases of sovereign debt. This allows investors exposure to potentially higher returns of equity markets, while protecting against losses.
Performance - Indicative equity range: 65% - 90% of the value of the fund. The performance fund is a high risk/return fund holding a wide range of global equities and equity-based financial instruments offering real growth opportunities.
International equity - Indicative equity range is 80% to 100% of the value of the fund. This fund seeks to maximise growth through capital gains and income from a portfolio of international equities and equity-based financial instruments
Irish equity - This actively managed equity fund which seeks to maximise growth through capital gain and income from a diversified portfolio of Irish equities and equity based financial instruments
Earth resources - Indicative allocation to each commodity: 20% to 30% of the value of the fund. This is a unit-linked fund that invests in a range of diverse assets: oil, alternative energy, precious metals and agriculture. This fund has been designed to offer investors exposure to the world’s physical resources. The increasing demand for physical resources, resulting from an expanding population and economic growth in emerging markets, underpins the potential for strong investment returns.
Aggressive fund - This fund selects an asset allocation that attempts to achieve maximum return through equity investments. This investment strategy attempts to grow an investment at an above-average rate compared to its industry or the overall market, and so usually takes on additional risk.
This study aims to investigate some of the different factors which affect people’s choice of a pension plan. It involves participants viewing a range of different possible plans and ways of allocating their pension contribution, thinking hypothetically about this kind of decision in their own lives, and making decisions about a hypothetical pension subscription.
A pension is essentially an investment which provides you with money once you retire from working. A working person arranges to set aside a portion of their income every year, called a pension subscription, to invest. This investment, properly managed, gains significantly in value over time, leaving the person with a substantial amount of saved money to support themselves when they retire and are no longer able to earn a living directly.
Investment, however, is a trade-off between the return, or profit, which you receive and the amount of risk you wish to undertake: Generally speaking, the higher the potential return from an investment, the greater the risk. In order to achieve the best results possible, financial companies design various pension plans to offer their clients the benefit of professional guidance in managing their investment effectively. But even though all of the day-to-day management of your investment is done for you, you are still asked to make some basic decisions about how to allocate your money, depending on your attitude towards risk and return. This is what happens when you select a pension plan with a financial advisor.
In 2014 Ireland will become one of the first countries to move toward a national automatic enrolment pension system for the private sector. All private sector workers not already covered will be automatically enrolled into a default privately provided pension scheme, further incentivised by mandatory employer co-contributions and tax incentives. However, it is possible that an auto-enrolment system for pensions could raise questions about fairness and security, such as the possibility that it may afford employers greater opportunity to cheat their employees by changing their preferences or opting them out of the system without their consent. Automatic enrolment will begin in 2014 for those above 22 years of age and in employment. The total contribution from auto-enrolled employees will be in the region 8% of gross earnings: 4 per cent will come from the employee, 2 per cent will come from the employer, and the government will contribute 2 per cent in tax relief.
Employees will be offered an assortment of funds under the auto-enrolment scheme, ranging from low risk and return, to very high risk and return. They will be asked to allocate their funds accordingly across this range of options.
We want you to think about a scenario where you are being asked to choose the fund that will make up your pension. There are 10 different funds that can be chosen and you must choose what percentage of your portfolio you would like to invest in each. Please study the options and their descriptions carefully, read over each one and indicate what proportion of your pension contribution you would like to allocate to each fund. Please note that you must put some proportion of your money into at least 2 options, and no more than 6.
The following brief questionnaire contains 5 questions referring to different financial situations. Please take a moment to answer each one, circling the correct answer. If you do not know or are not certain what the answer is, please choose “Unsure”, do not attempt to guess the answer.
1) Suppose you had $100 in a savings account and the interest rate was 2% per year. After 5 years, how much do you think you would have in the account if you left the money to grow?
2) Imagine that the interest rate on your savings account was 1% per year and inflation was 2% per year. After 1 year, how much would you be able to buy with the money in this account?
3) If interest rates rise, what will typically happen to bond prices?
4) A 15-year mortgage typically requires higher monthly payments than a 30-year mortgage, but the total interest paid over the life of the loan will be less.
5) Buying a single company’s stock usually provides a safer return than a stock mutual fund.
You will be making choices between two lotteries, such as those represented as "Option A" and "Option B" below. The money prizes are determined by the computer equivalent of throwing a ten-sided die. Each outcome, 1, 2, 3, 4, 5, 6, 7, 8, 9, 10, is equally likely.
Caption A Option B $6.00 if the die is 1 $11.55 if the die is 1 $4.80 if the die is 2 – 10 $0.30 if the die is 2 – 10
Thus if you choose Option A, you will have a 1 in 10 chance of earning $6.00 and a 9 in 10 chance of earning $4.80. Similarly, Option B offers a 1 in 10 chance of earning $11.55 and a 9 in 10 chance of earning $0.30. Please indicate your choice by ticking in the right side of the box for each of the four scenarios in the table below.
Option A Option B Receive $6.00 if die Receive $11.55 if die throw is 1 – 3; throw is 1 – 3; Receive $4.80 if die Receive $0.30 if die throw is 4 – 10; throw is 4 – 10; Receive $6.00 if die Receive $11.55 if die throw is 1 – 4; throw is 1 – 4; Receive $4.80 if die Receive $0.30 if die throw is 5 – 10; throw is 5 – 10; Receive $6.00 if die Receive $11.55 if die throw is 1 – 5; throw is 1 – 5; Receive $4.80 if die Receive $0.30 if die throw is 6 – 10; throw is 6 – 10; Receive $6.00 if die Receive $11.55 if die throw is 1 – 6; throw is 1 – 6; Receive $4.80 if die Receive $0.30 if die throw is 7 – 10; throw is 7 – 10;
Introduction:
“You will now be given sheets containing information on a number of different funds offered by a single pension provider, as well as a graphical illustration of these options. The pension provider wants you to construct a personalized pension plan by choosing which funds you want to put your money in, and in what proportion. Each fund has different characteristics and involves a different balance of risk and return. Please read the explanations of each fund carefully and consult the illustration to be sure you understand these. When you are ready, please use the response sheet to indicate what percentage of your subscription you wish to allocate to each fund, so that your total adds up to 100. Remember, you must allocate some money to a minimum of 2 options, and a maximum of 6. If you are unsure of any of the terms in the description of the funds, please inform the experimenter. Take as much time as you need.”
Return:
“The pension plan you have chosen will now be displayed on the screen. Please review your choices and try to explain to us, as clearly as you can, what it was that made you choose each particular option and why it appealed to you. Remember that there is no wrong answer, we are interested in what you took into consideration when making the decision.”
Subsequent trial:
“Thank you. The next trial will now begin. You will be shown another range of funds from a different provider and once again, we need you to choose a personalized plan from among those options.”
Memory questions:
Next you will be asked a series of questions relating to the previous task.
Retrospective questions:
The authors gratefully acknowledge the support and guidance of Professor Liam Delaney and the Geary Institute, University College Dublin, and thank Róisín White, Clare Delargy and Áine Ní Choisdealbha for their insightful comments and assistance.
Copyright: © 2013. The authors license this article under the terms of the Creative Commons Attribution 3.0 License.
This document was translated from LATEX by HEVEA.