| Figure 1: Medical subscale item distributions - risk-taking task |

Judgment and Decision Making, Vol. 8, No. 4, July 2013, pp. 470-481
DOSPERT+M: A survey of medical risk attitudes in the United StatesAdam Rosman* Maggie Garcia* Sam Lee* Shoshana Butler* Alan Schwartz# |
Background: The Domain-Specific Risk Taking scale (DOSPERT) has been recommended as a tool for measuring risk attitudes in medical studies, but does not contain items specific to health care. Butler, et al. (2012) developed a medical risk domain subscale for DOSPERT.
Objective: To characterize medical risk attitudes in a nationally-representative U.S. sample using the full DOSPERT scale with the medical risk domain add-on (DOSPERT+M), and examine associations with other risk domains.
Methods: Members of a nationally-representative online panel (KnowledgePanel®) were randomized to complete pairs of DOSPERT+M tasks (risk attitude, risk perception, expected benefits). We explored relationships among domains through correlational and factor analysis; we tested the hypothesis that the medical risk domain and DOSPERT’s health/safety domains were not highly correlated.
Participants: Three hundred forty-four panelists.
Results: The medical risk domain subscale had low inter-item reliability in the risk-taking task and moderate inter-item reliability in the other tasks. Medical risk domain scores were poorly correlated with the DOSPERT health/safety domain. Exploratory factor analysis largely recovered the expected DOSPERT domain structure.
Conclusion: Attitudes toward risky medical activities may constitute a distinct domain from those measured by the standard DOSPERT items. Additional work is required to develop a medical risk subscale with higher inter-item reliability.
Keywords: DOSPERT, DOSPERT+M, risk attitude, risk perception, medical decision making
The Domain-Specific Risk Taking scale (DOSPERT) (Blais & Weber, 2006; Blais & Weber, 2009; Weber, Blais, & Betz, 2002) is a widely used instrument that measures risk attitudes (willingness to engage), risk perceptions, and expected benefits for a set of potentially risky activities organized into five domains: ethical, financial, health/safety, recreational, and social risk taking. DOSPERT is one of a small number of instruments recommended in Harrison, et al.’s (2005) review of instruments for assessing health-related or clinical risks. However, DOSPERT does not include a domain that focuses on health care activities; the health/safety scale is limited to preventive behaviors.
In recognition of this limitation and other concerns with the health/safety subscale (Blais & Weber, 2009; Young et al., 2008), Butler, et al. (2012) developed and provided initial psychometric evidence for an add-on medical risk domain consisting of six activities, modeled after the other DOSPERT domains. Adding the new domain’s items to the standard DOSPERT items produces a 36-item instrument that we refer to as DOSPERT+M. Table 1 lists the medical risk domain items.
Table 1: DOSPERT+M medical risk domain subscale items.
The goal of this study was to characterize risk attitudes, including medical risk attitudes, in a nationally-representative U.S. sample using DOSPERT+M, and to examine the associations among domains. We specifically hypothesized that the DOSPERT health/safety scale would not be strongly associated with the DOSPERT medical scale.
The 36 DOSPERT+M items, each describing a risky activity, can be presented in any of the three standard DOSPERT tasks (risk-taking, risk perception, or expected benefit). In the risk-taking task, participants indicate their likelihood of participating in the activity on a 1-7 scale from "extremely unlikely" to "extremely likely". In the risk perception task, participants indicate how risky they believe the activity is on a 1-7 scale from "not at all risky" to "extremely risky". In the expected benefit task, participants indicate the benefits they believe they would receive from each activity on a 1-7 scale from "no benefits at all" to "great benefits". To reduce respondent fatigue, each participant was randomized to receive two of these three tasks presented in a randomized order.
DOSPERT+M was administered using the web-enabled KnowledgePanel®, a probability-based panel designed to be representative of the United States population. KnowledgePanel®consists of approximately 50,000 members aged 18 and older and includes persons living in cell phone only households as well as non-internet households. All participants completed the DOSPERT+M survey online; participants without computers or internet access complete the survey using computers provided by Knowledge Networks (now GfK). Prior to taking the survey each participant was asked a series of demographic questions related to age, gender, education level, geographic location, marital status, and socioeconomic status. Data collection took place between December 2, 2011 and December 18, 2011.
We examined the relationship among risk-taking, risk perception, and expected benefits in each domain by computing correlations among domain subscale scores in each task. Because participants were randomized to complete two of three tasks, each intra-domain (inter-task) correlation is based on a different group of participants.
To explore the hypothesis that the medical domain subscale measures a different construct than the health/safety domain subscale, we tested the correlation between subscale scores on the two domains in each task. In addition, we fit three confirmatory factor analysis models to the 12 items of the two scales in each task. The first model ("one factor") assumed all items loaded onto a single "health and medical" factor. The second model ("two distinct factors") assumed the health/safety items loaded onto a health factor and the medical items loaded onto a medical factor, with the possibility of correlation between the factors. The third model ("two entangled factors") also assumed two factors, but allowed all of the items but one in each domain to potentially load onto either factor (one item in each domain was fixed to each factor to make the model identifiable). The goal of the confirmatory factor analysis was to compare the goodness of fit of these three models; if the medical domain subscale and health/safety domain subscales are distinct constructs, we expect to see better fit of the "two distinct factors" model than the (nested) "one factor" model, but little additional fit improvement from the (non-nested) "two entangled factors" model. We examined RMSEA and AIC for each model and compared nested models using chi-squared tests of the difference in likelihood ratios (MacCallum, Browne, & Sugawara, 1996; Schreiber, et al., 2006).
Finally, we conducted exploratory factor analyses for each task using all 36 DOSPERT+M items, extracting six or seven factors by maximum likelihood methods and using an oblimin rotation, and examined the factor pattern matrix and inter-factor correlations (Fabrigar, et al., 1999). The goal of the exploratory factor analyses was to further investigate how the medical risk items were related to other DOSPERT items.
We also conducted three multiple linear regressions to determine whether variance in the medical domain task scores (risk-taking, risk perception, and expected benefits) was associated with demographic factors. Age, gender, ethnicity (dummy coded to compare White non-Hispanic, Black non-Hispanic, Hispanic, and Multiracial/Other non-Hispanic), cohabitation (married/living with partner or not), and education (some college or no college) were included as predictors.
Analyses were conducted using R 2.15 for factor analyses with the sem, semPlot, psych, and GPArotation packages (R Core Team, 2013; Fox, Nie, & Byrnes, 2013; Epskamp, 2013; Bernaards & Jennrich, 2005; Revelle, 2013)
The overall within-survey response rate for KnowledgePanel®is 65% with some minor variation depending on survey length and topic. The DOSPERT+M study sampled 538 participants of which 350 completed the survey for a response of 65%. Of those 350 completed surveys, 344 were considered sufficiently complete for inclusion. The six removed were excluded due to the fact that they refused to answer a majority (19 or more) of the substantive survey questions. The median time for completing the survey was nine minutes. Table 2 presents the demographic characteristics of study participants.
Table 2: Demographic characteristics.
Figure 1: Medical subscale item distributions - risk-taking task
Figure 2: Medical subscale item distributions - risk perception task 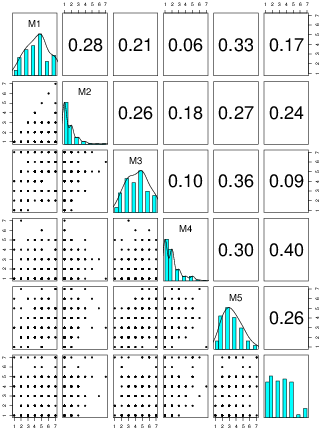
Figure 3: Medical subscale item distributions - expected benefits task 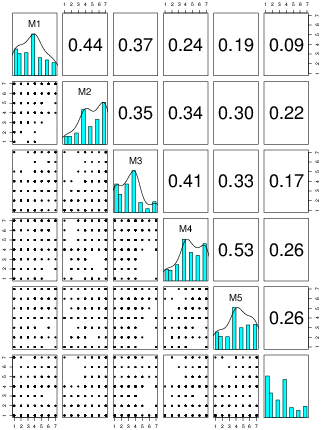
Twenty-five respondents were excluded from analysis based on response patterns: 11 respondents indicated that giving blood was riskier than donating a kidney, and 14 (different) respondents gave the same response to every item in at least one task. Repeating the analyses with these respondents included did not result in substantial differences except where the inclusion of respondents with no variance interfered with model fitting.
Table 3 presents the range, median, mean, and standard deviation of responses for each of the medical risk subscale items in each task. There was considerable variance in the responses for each item in each task, with the exception of risk perceptions for giving blood (M2) which heavily clustered around the low end of the scale. Figures 1-3 show histograms of each item in each task on the main diagonals, with pairwise scatterplots (lower triangle) and correlations (upper triangle).
Within the medical subscale, risk-taking scores were not significantly correlated with risk perception scores (r=-.12) in the subsample that completed those two tasks. Risk taking was significantly positively correlated with expected benefits scores (r=.69, p<.01) in the subsample that completed those two tasks. Benefit and risk perception scores were negatively correlated (r=-.41, p<.01) in the subsample that completed those two tasks, which may suggest evaluation based on a common underlying feeling (Alhakami & Slovic, 1994). A similar pattern of associations was found for the financial and social subscales; for recreation, ethical, and health/safety subscales, risk-taking and risk perception were also significantly negatively correlated (r=-.28, r=-.49, and r=-.46, respectively).
Table 3: Medical risk subscale item-level statistics.
Table 4 presents the correlations among domain subscale scores in each task. Medical domain scores were least strongly correlated with the health/safety and ethics domain scores, and most strongly correlated with social domain scores.
Table 4: Correlations among domains and Cronbach’s α for each domain.
Risk-taking task Medical Ethical Financial Health/Safety Recreational Social Medical .49 .16* .33** .12 .28** .41** Ethical .60 .41** .63** .30** .21** Financial .66 .30** .41** .28** Health/Safety .71 .45** .25** Recreational .77 .33** Social .69 Risk perception task Medical Ethical Financial Health/Safety Recreational Social Medical .63 .27** .24** .25** .38** .46** Ethical .75 .54** .72** .54** .26** Financial .76 .53** .45** .18** Health/Safety .78 .61** .26** Recreational .80 .29** Social .71 Expected benefit task Medical Ethical Financial Health/Safety Recreational Social Medical .72 .07 .34** .00 .25** .53** Ethical .61 .41** .63** .31** .20** Financial .79 .32** .43** .43** Health/Safety .66 .40** .21** Recreational .80 .44** Social .72 * p < .05, ** p < .01 Note: Cronbach’s α on main diagonals, correlations on off-diagonals.
In each task, the "two distinct factors" model provided a significantly better fit than the "one factor" model (likelihood ratio difference test χ2(1)=56, 103, and 146, for risk-taking, risk perception, and expected benefits, respectively, p<.001 in all cases; AIC=157, 162, 145, respectively). The "two entangled factors" model did not improve significantly on the "two distinct factors" model (AIC=159 vs. 157 for risk-taking, AIC=174 vs. 162 for risk perception, and AIC=156 vs. 145 for expected benefits). Figure 4 shows the standardized path coefficients (factor loadings) for the "two distinct factors" model for each task. The RMSEA for the "two distinct factors" models varies from 0.06 to 0.08 across the tasks, representing acceptable but not excellent fit of the models to the data (risk-taking RMSEA=0.07, 95% CI [0.05-0.09], risk perception RMSEA=0.08 [0.06-0.10], expected benefit RMSEA=0.06 [0.04-0.08]). Item M6 (general rather than local anesthesia for wisdom tooth removal) contributed most to misfit of the model, particularly in the risk-taking task. Correlations among the latent factors for the medical and health/safety items were low.
Tables 5-7 present the pattern matrices from exploratory factor analyses of each task extracting 6 factors; similar tables for 7-factor extraction appear in the Appendix. RMSEA values for the 6-factor solutions (with 95% confidence intervals) were: risk-taking 0.04 [0.03-0.05], risk perception 0.04 [0.03-0.05], expected benefits 0.05 [0.04-0.06]. RMSEAs for the 7-factor solution were not significantly lower (risk-taking 0.04 [0.03-0.05], risk perception 0.04 [0.03-0.05], expected benefits 0.04 [0.03-0.05]).
In the risk-taking task (Table 5), each DOSPERT+M domain’s items largely loaded together on different factors, with the ethics domain items spread across two factors, one of which also included most of the financial domain items. Medical and health/safety domain items did not load onto the same factor. Item M6 (general rather than local anesthesia) did not load onto any factor.
Table 5: Exploratory factor analysis of the risk-taking task.
Factor 1 2 3 4 5 6 R1 0.47 R2 0.41 R3 0.59 R4 0.81 R5 0.76 R6 0.50 -0.24 0.25 E1 0.36 E2 0.55 E3 0.48 0.33 E4 0.28 0.22 0.28 0.25 E5 0.22 0.27 E6 0.24 0.27 F1 0.72 F2 0.24 0.46 -0.23 F3 0.65 F4 0.46 0.30 F5 0.53 F6 0.23 0.31 0.48 -0.21 S1 0.57 S2 0.50 S3 0.58 S4 0.66 S5 0.24 0.27 S6 0.31 H1 0.24 0.28 H2 0.56 H3 0.55 H4 0.32 0.47 H5 0.27 0.21 0.47 H6 0.70 M1 -0.32 0.26 M2 0.21 0.23 0.21 M3 0.29 0.36 M4 -0.24 0.42 M5 0.64 M6 Note: Loadings ≥0.2 shown; loadings ≥0.35 shaded.
Table 6: Exploratory factor analysis of the risk perception task.
Factor 1 2 3 4 5 6 E1 0.60 E2 0.35 0.26 E3 0.62 E4 0.57 E5 0.24 0.30 E6 0.60 R1 0.48 R2 0.42 R3 0.33 0.49 R4 0.67 R5 0.67 R6 0.63 H1 0.64 H2 0.43 H3 0.22 0.20 0.28 -0.21 H4 0.35 0.21 -0.20 H5 0.29 0.27 0.23 H6 0.27 0.29 F1 0.86 F2 0.62 F3 0.82 F4 0.49 F5 0.85 F6 0.68 S1 0.65 S2 0.49 S3 -0.25 0.45 S4 0.63 S5 0.33 0.21 S6 0.53 M1 0.39 M2 0.38 M3 0.36 M4 0.33 M5 0.65 M6 0.23 0.21 0.33 Note: Loadings ≥0.2 shown; loadings ≥0.35 shaded.
Table 7: Exploratory factor analysis of the expected benefit task.
Factor 1 2 3 4 5 6 M1 0.47 M2 0.46 M3 0.52 M4 0.52 M5 0.58 M6 0.35 R1 0.53 R2 0.40 R3 0.77 R4 0.25 0.65 R5 0.72 R6 0.56 F1 0.84 F2 0.53 F3 0.85 F4 0.45 F5 0.80 F6 0.52 0.22 H1 0.60 H2 0.50 H3 0.61 H4 0.29 0.22 H5 0.42 H6 0.55 E1 0.23 0.26 E2 0.58 E3 0.68 E4 0.75 E5 0.38 E6 0.22 0.31 -0.21 S1 0.44 S2 0.68 S3 0.37 -0.20 0.29 S4 0.74 S5 0.31 0.30 S6 0.57 Note: Loadings ≥0.2 shown; loadings ≥0.35 shaded.
Figure 4: Confirmatory factor analysis model for risk-taking 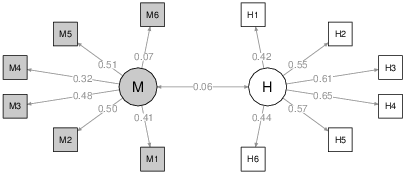
Figure 5: Confirmatory factor analysis model for risk perception 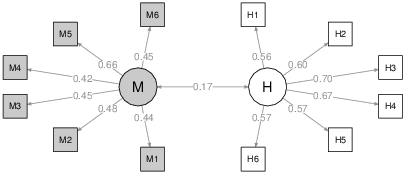
Figure 6: Confirmatory factor analysis model for expected benefit 
In the risk perception task (Table 6), the health domain items shared variance with the ethics and recreational items, and the financial items were spread across two factors representing gambling vs. investing items. Medical and health/safety domain items did not load onto the same factor; the correlation between one health/safety factor (factor 1, with ethics items) and the medical factor was 0.48; the correlation between the other health/safety factor (factor 2, with recreational items) and the medical factor was -0.29. Item M6 (general rather than local anesthesia) had weaker loadings.
In the expected benefit task (Table 7), the medical domain items shared variance with the financial and social items, and the financial and ethical items were spread across two factors (with financial representing investing vs. gambling). Medical and health/safety domain items did not load onto the same factor; the correlation between the medical and health/safety factors was 0.29.
The regression models for medical risk-taking and medical risk perception scores did not account for significant variance in the scores (F(7,213)=0.89, p=0.5, and F(7,199)=1.5, p=0.2, respectively). For expected benefit of medical activities, the regression model reached significance (F(7,223)=2.6, p=0.014), and three demographic predictors were associated with expected benefit scores. Black non-Hispanic respondents had higher scores for expected benefit (B=0.60, SE=0.27, p=.028), as did female respondents (B=0.32, SE=0.15, p=.039). Older respondents also reported higher expected benefit (B=0.010 per year of age, SE=0.004, p=.026), contrary to the findings in the development study (Butler, et al., 2012). Table 8 compares the demographic predictors of medical domain scores with those for the other DOSPERT domains in each task, and suggests that associations between demographic predictors and the medical risk subscale are different than those for other subscales.
In this study using a U.S-representative panel sample, the DOSPERT+M items largely (although not perfectly) cluster into the expected domains, providing additional evidence of DOSPERT’s fundamental assumption of domain specificity in risk attitude. The pattern is similar to that reported in factor analyses of the original DOSPERT scale (Blais & Weber, 2009).
DOSPERT+M medical domain scores were not associated with health/safety domain scores. The items in these two domains did not load onto a common factor in either confirmatory or exploratory factor analysis of any task. DOSPERT+M risk-taking and risk perception scores were not associated with demographic factors; DOSPERT+M expected benefit scores were higher for women, Black respondents, and older respondents, on average.
The internal consistency of the medical domain subscale for the risk-taking task was unacceptably low for practical use as a measure of willingness to engage in medical risks. Although the consistency was acceptable in the risk perception and expected benefits tasks, a feature of DOSPERT is the use of the same items in all three tasks, and items in the subscale should be replaced or revised before it is applied as a risk measure in practice. The dental anesthesia item (M6) appears to be a clear candidate for replacement.
Table 8: Demographic predictors of domain scores.
Risk-taking task Medical Health/safety Financial Ethical Recreational Social Age (-) (-) (-) (-) Female (-) (-) Cohabitating College (+) (+) Ethnicity (vs. White, Non-Hispanic) Black, Non-Hispanic Other, Non-Hispanic (+) Hispanic (-) Multiracial, Non-Hispanic Risk perception task Medical Health/safety Financial Ethical Recreational Social Age (+) (+) (+) Female (+) (+) (+) (+) Cohabitating College Ethnicity (vs. White, Non-Hispanic) Black, Non-Hispanic (+) (+) Other, Non-Hispanic Hispanic (+) Multiracial, Non-Hispanic Expected benefit task Medical Health/safety Financial Ethical Recreational Social Age (+) (-) (-) (-) Female (+) (-) (-) Cohabitating (-) College (+) (+) Ethnicity (vs. White, Non-Hispanic) Black, Non-Hispanic (+) (+) Other, Non-Hispanic Hispanic Multiracial, Non-Hispanic (+) = significant (p < .05) positive association, (-) = significant negative association
We did not measure actual decision behavior, and we cannot conclude whether medical domain subscale scores are associated with behavior by patients facing actual medical decisions. This remains an area for future investigation.
Out of concern for survey fatigue, we did not present all three DOSPERT tasks to each participant, limiting our ability to conduct within-subject comparisons of responses to each task. Past studies using DOSPERT have often omitted the expected benefits scale for similar reasons, but we preferred to collect information on benefit perception.
DOSPERT, and the health/safety domain in particular, have been recommended as measures of risk attitude for use in studies of medical decisions. As responses to the health/safety domain do not appear to be related to responses to the DOSPERT+M medical domain, we recommend that studies seeking to measure risk attitudes in medical decisions include medical domain items as well as the health/safety items and assess their value in explaining or informing medical decisions.
Alhakami, A. S., & Slovic, P. (1994). A psychological study of the inverse relationship between perceived risk and perceived benefit. Risk Analysis, 14, 1085–1096.
Bernaards, C. A. & Jennrich, R. I. (2005) Gradient projection algorithms and software for arbitrary rotation criteria in factor analysis. Educational and Psychological Measurement, 65, 676-696.
Blais, A., & Weber, E. (2006). A Domain-Specific Risk-Taking (DOSPERT) scale for adult populations. Judgment and Decision Making, 1, 33–47.
Blais, A., & Weber, E. U. (2009). The Domain-Specific Risk Taking (DOSPERT) scale for adult populations: Item selection and preliminary psychometric properties. Toronto, Ontario: Defence R & D.
Butler, S., Rosman, A., Seleski, S., Garcia, M., Lee, S., Barnes, J., & Schwartz, A. (2012). A medical risk attitude subscale for DOSPERT. Judgment and Decision Making, 7, 189–195.
Epskamp, S. (2013). semPlot: Path diagrams and visual analysis of various SEM packages’ output. R package version 0.3.2. http://CRAN.R-project.org/package=semPlot.
Fabrigar, L., Wegener, D., MacCallum, R., & Strahan, E. (1999). Evaluating the use of exploratory factor analysis in psychological research. Psychological Methods, 4, 272–299.
Fox, J., Nie, Z., & Byrnes, J. (2013). sem: Structural equation models. R package version 3.1-3. http://CRAN.R-project.org/package=sem.
Harrison, J. D., Young, J. M., Butow, P., Salkeld, G., & Solomon, M. J. (2005). Is it worth the risk? A systematic review of instruments that measure risk propensity for use in the health setting. Social science & medicine, 60, 1385–1396.
MacCallum, R. C., Browne, M. W., & Sugawara, H. M. (1996). Power analysis and determination of sample size for covariance structure modeling. Psychological Methods, 1, 130.
R Core Team (2013). R: A language and environment for statistical computing. R Foundation for Statistical Computing, Vienna, Austria. http://www.R-project.org/.
Revelle, W. (2013) psych: Procedures for personality and psychological research, Northwestern University, Evanston, Illinois, USA, http://CRAN.R-project.org/package=psych, Version = 1.3.2.
Schreiber, J. B., Nora, A., Stage, F. K., Barlow, E. A., & King, J. (2006). Reporting structural equation modeling and confirmatory factor analysis results: A review. The Journal of Educational Research, 99, 323–338.
Weber, E. U., Blais, A. R., & Betz, N. E. (2002). A Domain-specific Risk-attitude Scale: Measuring risk perceptions and risk behaviors. Journal of Behavioral Decision Making, 15, 263–290.
Young, A., Karpinski, M., Treleaven, D., Waterman, A., Parikh, C. R., Thiessen-Philbrook, H., …Garg, A. X. (2008). Differences in tolerance for health risk to the living donor among potential donors, recipients, and transplant professionals. Kidney International, 73, 1159–1166.
Table A1. 7-Factor exploratory factor analysis pattern matrix in the
risk-taking task.
| Factor | |||||||
| 1 | 2 | 3 | 4 | 5 | 6 | 7 | |
| R1 | 0.37 | 0.25 | |||||
| R2 | 0.39 | ||||||
| R3 | 0.54 | ||||||
| R4 | 0.82 | ||||||
| R5 | 0.75 | ||||||
| R6 | 0.49 | -0.21 | 0.25 | ||||
| F1 | 0.70 | ||||||
| F2 | 0.26 | 0.49 | |||||
| F3 | 0.66 | ||||||
| F4 | 0.43 | 0.36 | -0.23 | ||||
| F5 | 0.55 | ||||||
| F6 | 0.28 | 0.53 | |||||
| S1 | -0.22 | 0.54 | |||||
| S2 | 0.45 | 0.29 | |||||
| S3 | 0.58 | ||||||
| S4 | -0.21 | 0.61 | 0.23 | ||||
| S5 | 0.22 | 0.34 | 0.21 | ||||
| S6 | 0.29 | ||||||
| H1 | 0.22 | 0.28 | |||||
| H2 | 0.54 | 0.20 | |||||
| H3 | 0.63 | ||||||
| H4 | 0.25 | 0.53 | |||||
| H5 | 0.57 | ||||||
| H6 | 0.68 | ||||||
| E1 | 0.34 | ||||||
| E2 | 0.65 | ||||||
| E3 | 0.46 | 0.29 | |||||
| E4 | 0.28 | 0.33 | 0.26 | ||||
| E5 | 0.23 | ||||||
| E6 | 0.22 | 0.27 | |||||
| M1 | 0.68 | ||||||
| M2 | 0.26 | 0.51 | |||||
| M3 | 0.27 | 0.29 | |||||
| M4 | 0.54 | ||||||
| M5 | 0.21 | 0.56 | 0.21 | ||||
| M6 | |||||||
| Note: Loadings ≥0.2 shown; loadings ≥0.35 shaded. | |||||||
Table A2. 7-Factor exploratory factor analysis pattern matrix in the
risk perception task.
| Factor | |||||||
| 1 | 2 | 3 | 4 | 5 | 6 | 7 | |
| E1 | 0.59 | ||||||
| E2 | 0.33 | 0.26 | |||||
| E3 | 0.59 | ||||||
| E4 | 0.52 | ||||||
| E5 | 0.21 | ||||||
| E6 | 0.62 | ||||||
| F1 | 0.85 | ||||||
| F2 | 0.62 | ||||||
| F3 | 0.82 | ||||||
| F4 | 0.50 | ||||||
| F5 | 0.84 | ||||||
| F6 | 0.67 | ||||||
| R1 | 0.44 | ||||||
| R2 | 0.43 | ||||||
| R3 | 0.31 | 0.49 | |||||
| R4 | 0.66 | ||||||
| R5 | 0.66 | ||||||
| R6 | 0.62 | ||||||
| S1 | 0.61 | ||||||
| S2 | 0.54 | ||||||
| S3 | -0.21 | 0.50 | |||||
| S4 | 0.60 | ||||||
| S5 | 0.34 | ||||||
| S6 | 0.53 | ||||||
| H1 | 0.59 | ||||||
| H2 | 0.39 | ||||||
| H3 | 1.00 | ||||||
| H4 | 0.23 | 0.51 | |||||
| H5 | 0.27 | 0.25 | |||||
| H6 | 0.28 | 0.22 | 0.29 | ||||
| M1 | 0.44 | ||||||
| M2 | 0.40 | ||||||
| M3 | 0.39 | ||||||
| M4 | 0.32 | ||||||
| M5 | 0.72 | ||||||
| M6 | 0.25 | 0.24 | 0.28 | ||||
| Note: Loadings ≥0.2 shown; loadings ≥0.35 shaded. | |||||||
Table A3. 7-Factor exploratory factor analysis pattern matrix in the
expected benefit task.
| Factor | |||||||
| 1 | 2 | 3 | 4 | 5 | 6 | 7 | |
| R1 | 0.50 | 0.21 | |||||
| R2 | 0.35 | 0.21 | |||||
| R3 | 0.73 | ||||||
| R4 | 0.66 | ||||||
| R5 | 0.78 | ||||||
| R6 | 0.53 | ||||||
| F1 | 0.84 | ||||||
| F2 | 0.62 | ||||||
| F3 | 0.81 | ||||||
| F4 | 0.62 | ||||||
| F5 | 0.80 | ||||||
| F6 | 0.83 | ||||||
| M1 | 0.41 | ||||||
| M2 | 0.55 | ||||||
| M3 | 0.53 | ||||||
| M4 | 0.69 | ||||||
| M5 | 0.59 | ||||||
| M6 | 0.33 | ||||||
| E1 | 0.22 | 0.24 | |||||
| E2 | 0.56 | ||||||
| E3 | 0.70 | ||||||
| E4 | 0.71 | ||||||
| E5 | 0.21 | 0.34 | |||||
| E6 | 0.26 | 0.34 | -0.20 | ||||
| H1 | 0.59 | ||||||
| H2 | 0.51 | ||||||
| H3 | 0.65 | ||||||
| H4 | 0.31 | 0.27 | |||||
| H5 | 0.46 | ||||||
| H6 | 0.52 | ||||||
| S1 | 0.44 | ||||||
| S2 | 0.69 | ||||||
| S3 | 0.21 | 0.22 | -0.22 | 0.31 | |||
| S4 | 0.73 | ||||||
| S5 | 0.24 | 0.31 | |||||
| S06 | 0.35 | 0.31 | |||||
| Note: Loadings ≥0.2 shown; loadings ≥0.35 shaded. | |||||||
The work reported here was funded by U.S. National Science Foundation grant SES-1023831 to Alan Schwartz.
Copyright: © 2013. The authors license this article under the terms of the Creative Commons Attribution 3.0 License.
This document was translated from LATEX by HEVEA.