Learning affects top down and bottom up modulation of eye movements in decision making
Jacob L. Orquin* Martin P. Bagger* Simone Mueller Loose*#
Repeated decision making is subject to changes over time such as
decreases in decision time and information use and increases in
decision accuracy. We show that a traditional strategy selection
view of decision making cannot account for these temporal dynamics
without relaxing main assumptions about what defines a decision
strategy. As an alternative view we suggest that temporal dynamics
in decision making are driven by attentional and perceptual
processes and that this view has been expressed in the information
reduction hypothesis. We test the information reduction hypothesis
by integrating it in a broader framework of top down and bottom up
processes and derive the predictions that repeated decisions
increase top down control of attention capture which in turn leads
to a reduction in bottom up attention capture. To test our
hypotheses we conducted a repeated discrete choice experiment with
three different information presentation formats. We thereby
operationalized top down and bottom up control as the effect of
individual utility levels and presentation formats on attention
capture on a trial-by-trial basis. The experiment revealed an
increase in top down control of eye movements over time and that
decision makers learn to attend to high utility stimuli and ignore
low utility stimuli. We furthermore find that the influence of
presentation format on attention capture reduces over time
indicating diminishing bottom up control.
Keywords: eye tracking, top down, bottom up, learning, information reduction, decision strategy.
1 Introduction
Human decision behavior is consistently inconsistent in its tendency
to change over time and over repeated decisions, yet these changes are
mostly seen as a nuisance factor or even treated as a theoretical
anomaly. In economics the static view of decision making is reflected
in the assumption about stability of preferences (McFadden, 2001)
while in psychology a similar assumption is often made about the
stability of decision strategies over time (Riedl, Brandstätter,
& Roithmayr, 2008). While both assumptions have been challenged on
different occasions (Kahneman, 2003; Svenson, 1979) many studies
implement them implicitly by aggregating choice and process data over
time. In this paper we propose that temporal dynamics in decision
making are more than a nuisance factor. Rather, they are informative
to decision research for two reasons. First, temporal dynamics in
decision making pose a theoretical challenge to strategy selection
models of decision making. This challenge makes these dynamics a
topic worthy of study. Second, understanding temporal dynamics calls
for a previously neglected perspectives on decision making. We
recently argued that decision research to a large extent has ignored
attention processes and that a better integration of visual cognition
into decision research could help account for a large number of
observations (Orquin & Mueller Loose, 2013). Here we expand our
argument by examining temporal dynamics in decision making, more
particularly how decision making changes over the course of repeated
decisions. We explore two competing explanations of temporal dynamics
in decision making, one derived from strategy selection theory and one
derived from vision research.
1.1 Can strategy selection account for temporal dynamics?
Among the many findings on temporal dynamics three have emerged as
particularly robust: Over time decision makers become faster in making
decisions (Meißner & Decker, 2010; Mueller Loose & Orquin,
2012), use less information in making their decisions (Payne, Bettman,
& Johnson, 1988), and at the same time increase the accuracy of their
decisions (Carlsson, Mørkbak, & Olsen, 2011; Hess, Hensher, &
Daly, 2012; Payne et al., 1988). The simultaneous reduction in
decision time and information use with an increase in decision
accuracy seems counter-intuitive at first, but can mean only that
decision makers become better or more efficient at making decisions
over time. According to a strategy selection view of decision making,
which in general terms posits that decision makers first select a
decision strategy and then implement it in a given decisions task
(Glöckner & Betsch, 2008), the increased efficiency could result
either from a more efficient application of one particular decision
strategy or from selecting a decision strategy that is more efficient
in the given decision environment.
If decision makers become more efficient in applying a decision
strategy, we would expect a decrease in decision time and perhaps also
a reduction in the amount of information that is re-fixated. One
could, for instance, imagine that decision makers become faster in
reading and remembering information which would lead to shorter
fixation durations and fewer re-fixations. On the other hand, we would
not expect any changes as to what or how the information is searched,
since the decision strategy itself specifies what information is
needed and the order in which it should be acquired (Costa-Gomes,
Crawford, & Broseta, 2001). However, this account of decision
efficiency conflicts with studies showing that decision makers often
change their search pattern over the course of repeated decisions
(Meißner & Decker, 2010; Patalano, Juhasz, & Dicke, 2010). Even
though decision makers may become more efficient over time in applying
one particular decision strategy, this change merely accounts for some
of the observations on temporal dynamics. The change in search pattern
could, on the other hand, indicate that decision makers are likely to
change their decision strategy over time.
If decision makers learn over repeated decisions to select strategies
that are more efficient to the decision environment we would expect a
reduction in decision time, an increase in decision accuracy, and a
change in the information search pattern because each decision
strategy predicts qualitatively different search patterns (Riedl et
al., 2008). Although this view seems promising, as it could
potentially explain the general observations from studies using
repeated decision trials, it has one major problem: There is most
likely no order for which decision makers could select their decision
strategies, for each decision, so that over time they would decrease
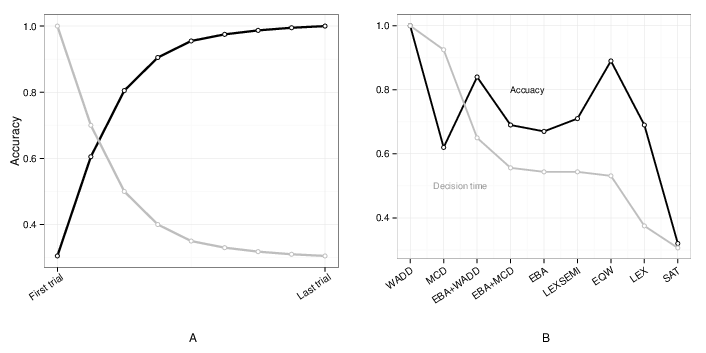
in information use, decision time and increase in accuracy. In Figure
1 we compare a typical pattern of observed decision time and accuracy
(compare this to Appendix 2) with the predicted decision time and
accuracy of nine different decision strategies. The predicted decision
times and accuracies are borrowed from Payne and colleagues (Payne et
al., 1988, Table 1 column 4) who simulated the performance of nine
decision strategies under different environments. The simulation
reports the number of operations which we use as a proxy for decision
time following (Johnson & Payne, 1985). The decision time and
accuracy measures are fitted to the same scale for the sake of
comparison.
The figure illustrates that there is no ordering of decision
strategies that can produce or approximate the observed pattern. The
predicted decision times and accuracies are positively correlated
across decision strategies while the observed pattern indicates a
negative correlation. Although the comparison is neither a
mathematical nor empirical proof, it does point us to a theoretical
challenge to the strategy selection view of decision making: It seems
impossible to account for the development of decision time and
accuracy in repeated decisions by switching between decision
strategies. To account for temporal dynamics through strategy
selection one could, for instance, relax the assumptions about what
defines a decision strategy or about how decision strategies are
mapped to process measures such as information acquisition, decision
time and choice accuracy (see the discussion). In the following
section we pursue an alternative view of temporal dynamics which
accounts for the behavioral observations mainly through attentional
and perceptual processes.
Figure 1: A: Typical pattern of observed decision time and accuracy in a repeated choice task. B: Ordering of decision strategies in accordance with their predicted decision times and accuracies (Payne et al., 1988). The y-axis represents normalized values for both decision time and accuracy. WADD = weighted additive, EQW = equal weight, EBA = Elimination by aspects, MCD = majority of confirming dimensions, SAT = satisficing, LEX = lexicographic, LEXSEMI = lexicographic semi-order, EBA + WADD elimination-by-aspects plus weighted additive, EBA + MCD = elimination-by-aspects plus majority of confirming dimensions.
1.2 Temporal dynamics and perceptual efficiency
In the previous section we examined whether the strategy selection
paradigm could account for temporal dynamics in decision making, such
as the development in decision time, information search patterns, and
decision accuracy. The comparison between observed and predicted
decision time and accuracy suggested that the strategy selection
paradigm cannot account for temporal dynamics except by relaxing the
assumptions about what defines a decision strategy or by introducing
new strategies. As an alternative account, we propose that at least
part of the change in decision time, information search, and decision
accuracy could be driven by increased efficiency in attentional and
perceptual processes. Such a view has previously been expressed in the
information reduction hypothesis (Haider & Frensch, 1999), which
accounts for expertise across different domains in terms of perceptual
efficiency. The theory posits that experts are more efficient than
novices because they have learned to fixate task relevant information
and ignore task redundant information—hence the term “information
reduction”. Information reduction effects has been demonstrated in
various domains, and a recent meta-analysis of the effect of expertise
on attention to visualizations (Gegenfurtner, Lehtinen, &
Säljö, 2011) concludes that experts have more fixations to
task-relevant areas and fewer fixations to task-irrelevant
areas. Information reduction has also been demonstrated in repeated-trial
experiments showing that practice increases fixation likelihood and
fixation duration to important stimuli, and reduces fixation
likelihood and duration for irrelevant stimuli (Droll, Gigone, &
Hayhoe, 2007; Hegarty, Canham, & Fabrikant, 2010; Jovancevic-Misic &
Hayhoe, 2009; Lee & Anderson, 2001). In decision making, similar
observations have emerged, indicating that decision makers become more
likely to fixate high utility attributes over the course of repeated
decision trials (Meißner & Decker, 2010; Mueller Loose & Orquin,
2012). Decision makers also reduce the number of fixations per trial
over the course of repeated-measures experiments (Fiedler &
Glöckner, 2012; Knoepfle, Wang, & Camerer, 2009; Toubia,
de Jong, Stieger, & Füller, 2012). Although none of these studies
address information reduction directly, the increased attention to
high utility information and the overall reduction in information
search indicates that information reduction is likely to happen in
repeated decision making.
If decision makers reduce information in a manner predicted by the
information reduction hypothesis this could potentially explain the
development in decision time, information search, and
accuracy. Whereas the strategy selection theory shows a positive
correlation between decision time, information search, and accuracy
across decision strategies the information reduction hypothesis posits
a negative correlation, i.e., the more accurate you are the less
information you look at, and the faster you are.
However, even if decision makers reduce information as suggested
above, one problem remains; the information reduction hypothesis does
not account for the underlying cognitive mechanism that leads to
information reduction. Accounting for temporal dynamics by information
reduction is therefore no different than giving the problem a new
name. To avoid this logical loop the following section attempts to
integrate information reduction into a broader theoretical framework
and derive hypotheses concerning the development of visual attention
in repeated decision tasks.
1.3 Top down and bottom up control of attention
An alternative way of viewing information reduction/perceptual
efficiency is to see it as a consequence of top down and bottom up
processes, i.e., goal and stimulus driven processes (Corbetta &
Shulman, 2002; Theeuwes, 2010). According to this terminology, the
findings above strongly suggest that practice, whether in the form of
years of expertise in a particular field or as practice in repeated-trial
experiments, increases top down control of attention. The claim
follows logically from the propositions that top down control is
defined as attention to task relevant stimuli, and that practice in
multi-trial experiments increases attention to task relevant
stimuli. However, the process through which practice increases top
down modulation is by no means clear.
One possible explanation is that increasing top down control is a
consequence of perceptual learning, i.e., an improved ability to
identify and discriminate between sensory inputs. It has, for
instance, been demonstrated that playing certain video games can
improve spatial resolution (Green & Bavelier, 2007) and target
detection (Green & Bavelier, 2006) so that experienced video game
players become better at identifying objects in visually cluttered
environments. This may lead to enhanced top down control of eye
movements (West, Al-Aidroos, & Pratt, 2013), and reduced bottom up
attention capture by distractors (Chisholm, Hickey, Theeuwes, &
Kingstone, 2010). Perceptual learning could therefore explain
perceptual efficiency in situations where the target stimulus is
difficult to identify or categorize, such as in comprehending
visualizations (e.g., Gegenfurtner et al., 2011) or when performing
tasks under time pressure (e.g., Chisholm et al., 2010; West et al.,
2013). However, in the walking experiment by Jovancevic-Misic and
Hayhoe (2009) and in the choice experiment by Meißner and Decker
(2010), the stimuli were easy to discriminate and categorize, and the
participants were not under time pressure, which questions the role of
perceptual learning.
Another perspective on increasing top down control would be the
reward-based model of gaze allocation advocated by Hayhoe and
colleagues (Hayhoe & Rothkopf, 2011; Tatler, Hayhoe, Land, &
Ballard, 2011). According to their theory, gaze allocation is
crucially dependent on reward systems so that eye movements are guided
by the reward value of gazing at a particular stimulus. Reward value
is understood here as consisting of both primary reinforcers such as
foods and secondary reinforcers such as money. It
has, for instance, been demonstrated that monkeys are willing to
trade-off food rewards for visual information about members of their
social group (Deaner, Khera, & Platt, 2005), and studies on humans
indicate similar trade-off patterns (Dai, Brendl, & Ariely,
2010). Trommershäuser and colleagues have also noted
that most brain areas dedicated to the control of eye movements are
sensitive to rewards, and that neural computations during visual
search in humans and primates are similar to those activated when eye
movements are extrinsically rewarded (Trommershäuser, Glimcher, &
Gegenfurtner, 2009). According to this view, top down control develops
in a feedback loop between the agent and the environment. Certain gaze
behaviors are selected because they lead to rewarding outcomes, such as
avoiding collisions with other pedestrians or completing a decision
task successfully.
The question is, of course, what type of feedback decision makers can
rely on in a repeated decision task in which no explicit feedback is
given? One possibility is that decision makers monitor their own
decision process in terms of how effortful the decision is and how
confident they feel about it (Anzai & Simon, 1979; Payne et al.,
1988). Such process feedback could potentially serve to guide learning
of top down control both within and across decision trials. Given that
decision makers generate some form of process feedback we therefore
hypothesize the following, in accordance with the reward-based model
of gaze allocation (Hayhoe & Rothkopf, 2011; Tatler et al., 2011),
and the information-reduction hypothesis (Haider & Frensch, 1999):
H1 Learning during repeated decision trials increases top down
modulation of attention, leading to higher fixation likelihood for
important attributes and lower fixation likelihood for unimportant
attributes.
The hypothesis poses another question: What is the role of bottom up
modulation during the development of top down modulation? In line with
the biased competition theory of selective attention (Desimone &
Duncan, 1995) we suggest that, in a situation with weak top down
modulation, the competition between stimuli will be based on bottom up
processes. A similar view is proposed by Theeuwes (2010), who argues
that selective attention is initially completely driven by bottom up
processes and only later (a few hundred msec after stimulus onset) by
top down processes. Both theories suggest that in the absence of top
down control we should expect a stronger influence of bottom up
control. If H1 is correct and top down control increases over repeated
decisions we would expect that bottom up control has a relatively
larger influence in the beginning of the experiment when top down
control is still relatively weak.
However, the important question is what will happen later in the
learning process when top down modulation becomes relatively stronger?
One possibility is that increasing top down modulation will diminish
bottom up control. It has, for instance, been shown that top down
factors, such as semantic or contextual cues about a visual scene,
feature based attention, object representations, task demands, and
rewards for task performance, all override the effect of visual
saliency (Kowler, 2011). Alternatively, it has been suggested that
changes in the balance between the two processes over time will favor
the process that makes more efficient use of cognitive resources
(Nyamsuren & Taatgen, 2013; Salvucci & Taatgen, 2008). According to
this view, both top down and bottom up modulation could in fact
increase over time if both processes contributed to higher perceptual
efficiency. Such interaction effects between top down and bottom up
processes have been demonstrated on attention capture (Nyamsuren &
Taatgen, 2013) and encoding to short term memory (Nordfang, Dyrholm,
& Bundesen, 2013). Although interactions between top down and bottom
up control are theoretically possible in laboratory experiments,
studies on naturalistic tasks often show a limited role of bottom up
and interaction processes in gaze allocation.
According to our previous proposition, strong top down modulation
should reduce bottom up modulation except in the special case in which
an interaction between the two processes leads to higher perceptual
efficiency (Nyamsuren & Taatgen, 2013). Given that there is no
interaction or that the interaction between top down and bottom up
processes remains constant, we therefore hypothesize the following:
H2: Bottom up modulation of attention is stronger in the
beginning of the experiment and diminishes over time as a
consequence of increasing top down modulation.
1.4 Experimental approach
In order to examine Hypotheses 1 and 2, we decided for an experimental
approach combining measured within-subjects and manipulated
between-subjects independent variables. Top down factors were
operationalized as individual level attribute importance, while bottom
up factors were operationalized through information presentation
formats. Combining measured and manipulated independent variables has
the main advantage that it disentangles top down and bottom up
modulation. Earlier studies have shown that important attributes gain
higher fixation likelihood over time (Meißner & Decker, 2010),
but it is in principle impossible to rule out that the effect could
have been caused by bottom up factors or interactions between top down
and bottom up factors, i.e., the important attributes could have been
more salient than the less important attributes.
The importance of attributes can also be directly manipulated through
task instructions, which, for instance, increases the utility of the
attribute in one situation but lowers it in another (Bialkova & van
Trijp, 2011; van Herpen & van Trijp, 2011; Visschers, Hess, & Siegrist,
2010), however, a more subtle approach is to derive it from individual
level estimates of part-worth utilities. By taking a measurement
approach to attribute importance it should be possible to show that
participants who assign a higher level of importance to an attribute
will increase their fixation likelihood for that attribute, compared
with participants who assign a lower importance.
Regarding bottom up factors, one common approach in decision research
has been to manipulate the format in which the information is
presented using, for instance, verbal matrices or more naturalistic
product representations (Huang & Kuo, 2011; Smead, Wilcox, & Wilkes,
1981; Söllner, Bröder, & Hilbig, 2013; van Raaij,
1977). Although this method involves less control over individual
bottom up factors, such as saliency, size and position of information
elements, one can think of all these factors as captured across
presentation formats. In this experiment, the product representation
format varies in, for instance, the saliency and size of attributes
relative to a verbal or visual matrix presentation. Using this
approach, the strength of bottom up modulation on gaze allocation is
observable as the differences among attributes in fixation likelihood
between the presentation formats as well as in the effect size of the
presentation format model terms. If an increasing top down modulation
competes with bottom up modulation, we therefore expect that attribute
differences in fixation likelihood across presentation formats
diminish over the course of repeated decisions.
In line with H1, we expect that learning over the course of the
experiment will increase top down modulation, leading to a larger
effect size of attribute importance over time and to increasing
fixation likelihood when attributes are high, rather than low, in
importance. We also expect, in line with H2, that increasing top down
modulation will diminish the effect of bottom up modulation, leading
to diminishing differences in fixation likelihood between the
presentation formats and a smaller effect size of presentation format
over time.
2 Method
2.1 Participants
Sixty eight participants were recruited on campus (62% male, mean age
25.6 years). To qualify, participants had to have normal vision and
had to buy and eat fruit yoghurt at least once a month.
2.2 Experimental design
We conducted a discrete choice experiment in which participants made
choices between four alternative fruit yoghurts and a no-choice
alternative. Each participant saw 48 choice sets in which six product
attributes varied on four levels according to a D-optimal design,
which maximizes the differences in attribute levels between choice
alternatives (Street & Burgess, 2007). Accordingly, all four choice
alternatives in a set differed in those attributes with four levels
(brand, flavor, fat percentage, and price), while attributes with two
levels (organic and health claim) were present twice in each choice
set. The presentation order of the choice sets was randomized across
participants. As an additional between-subjects factor, the choice set
presentation format varied between a verbal information matrix ( N =
22 ), a visual information matrix ( N = 24 ), and a realistic
product representation ( N = 22 ) (Mueller, Lockshin, & Louviere,
2010).
2.3 Materials and measures
The three stimulus presentation formats were operationalized as
follows: For the verbal and visual matrix formats the attributes were
presented in six rows and the alternatives as four columns within the
rows. The attributes were, from top to bottom: brand, flavor, fat
percentage, organic claim, health claim, and price. The product
representation format was operationalized as individual products
presented next to each other. The attributes were inserted on the
products with the brand at the top of the product followed by the
flavor, fat percentage, organic claim in the lower right and health
claim in the lower left of each product, and price at the very bottom
below each product. The verbal information matrix was based on written
descriptions of the attribute levels. Each attribute description was
kept to a minimum number of letters stating only the name of the
attribute level, such as “strawberry” or “peach” for the flavor
attribute or “Arla” or “Cultura” for the brand attribute.
The position of the attributes remained constant throughout the
experiment. Two of the attributes, organic and health claim, had two
levels (absent or present). The absence of either the organic or
health claim on an alternative was operationalized as an empty cell in
the verbal and visual matrices or as empty space in the product
representation format. A pre-test ensured that all attribute levels
were sufficiently large to be easily readable in all three
presentation formats at a distance of 60 cm from the screen (the
optimal distance for the Tobii 2150 eye-tracker system used in the
study).
Assuming a distance of 60 cm from the screen, individual attributes
were separated by an average angle of 2.3∘ for the verbal and
visual matrices and 2∘ for the product representation
format. The spacing of attributes was chosen so that it would be
impossible for participants to foveate more than one attribute at the
time.
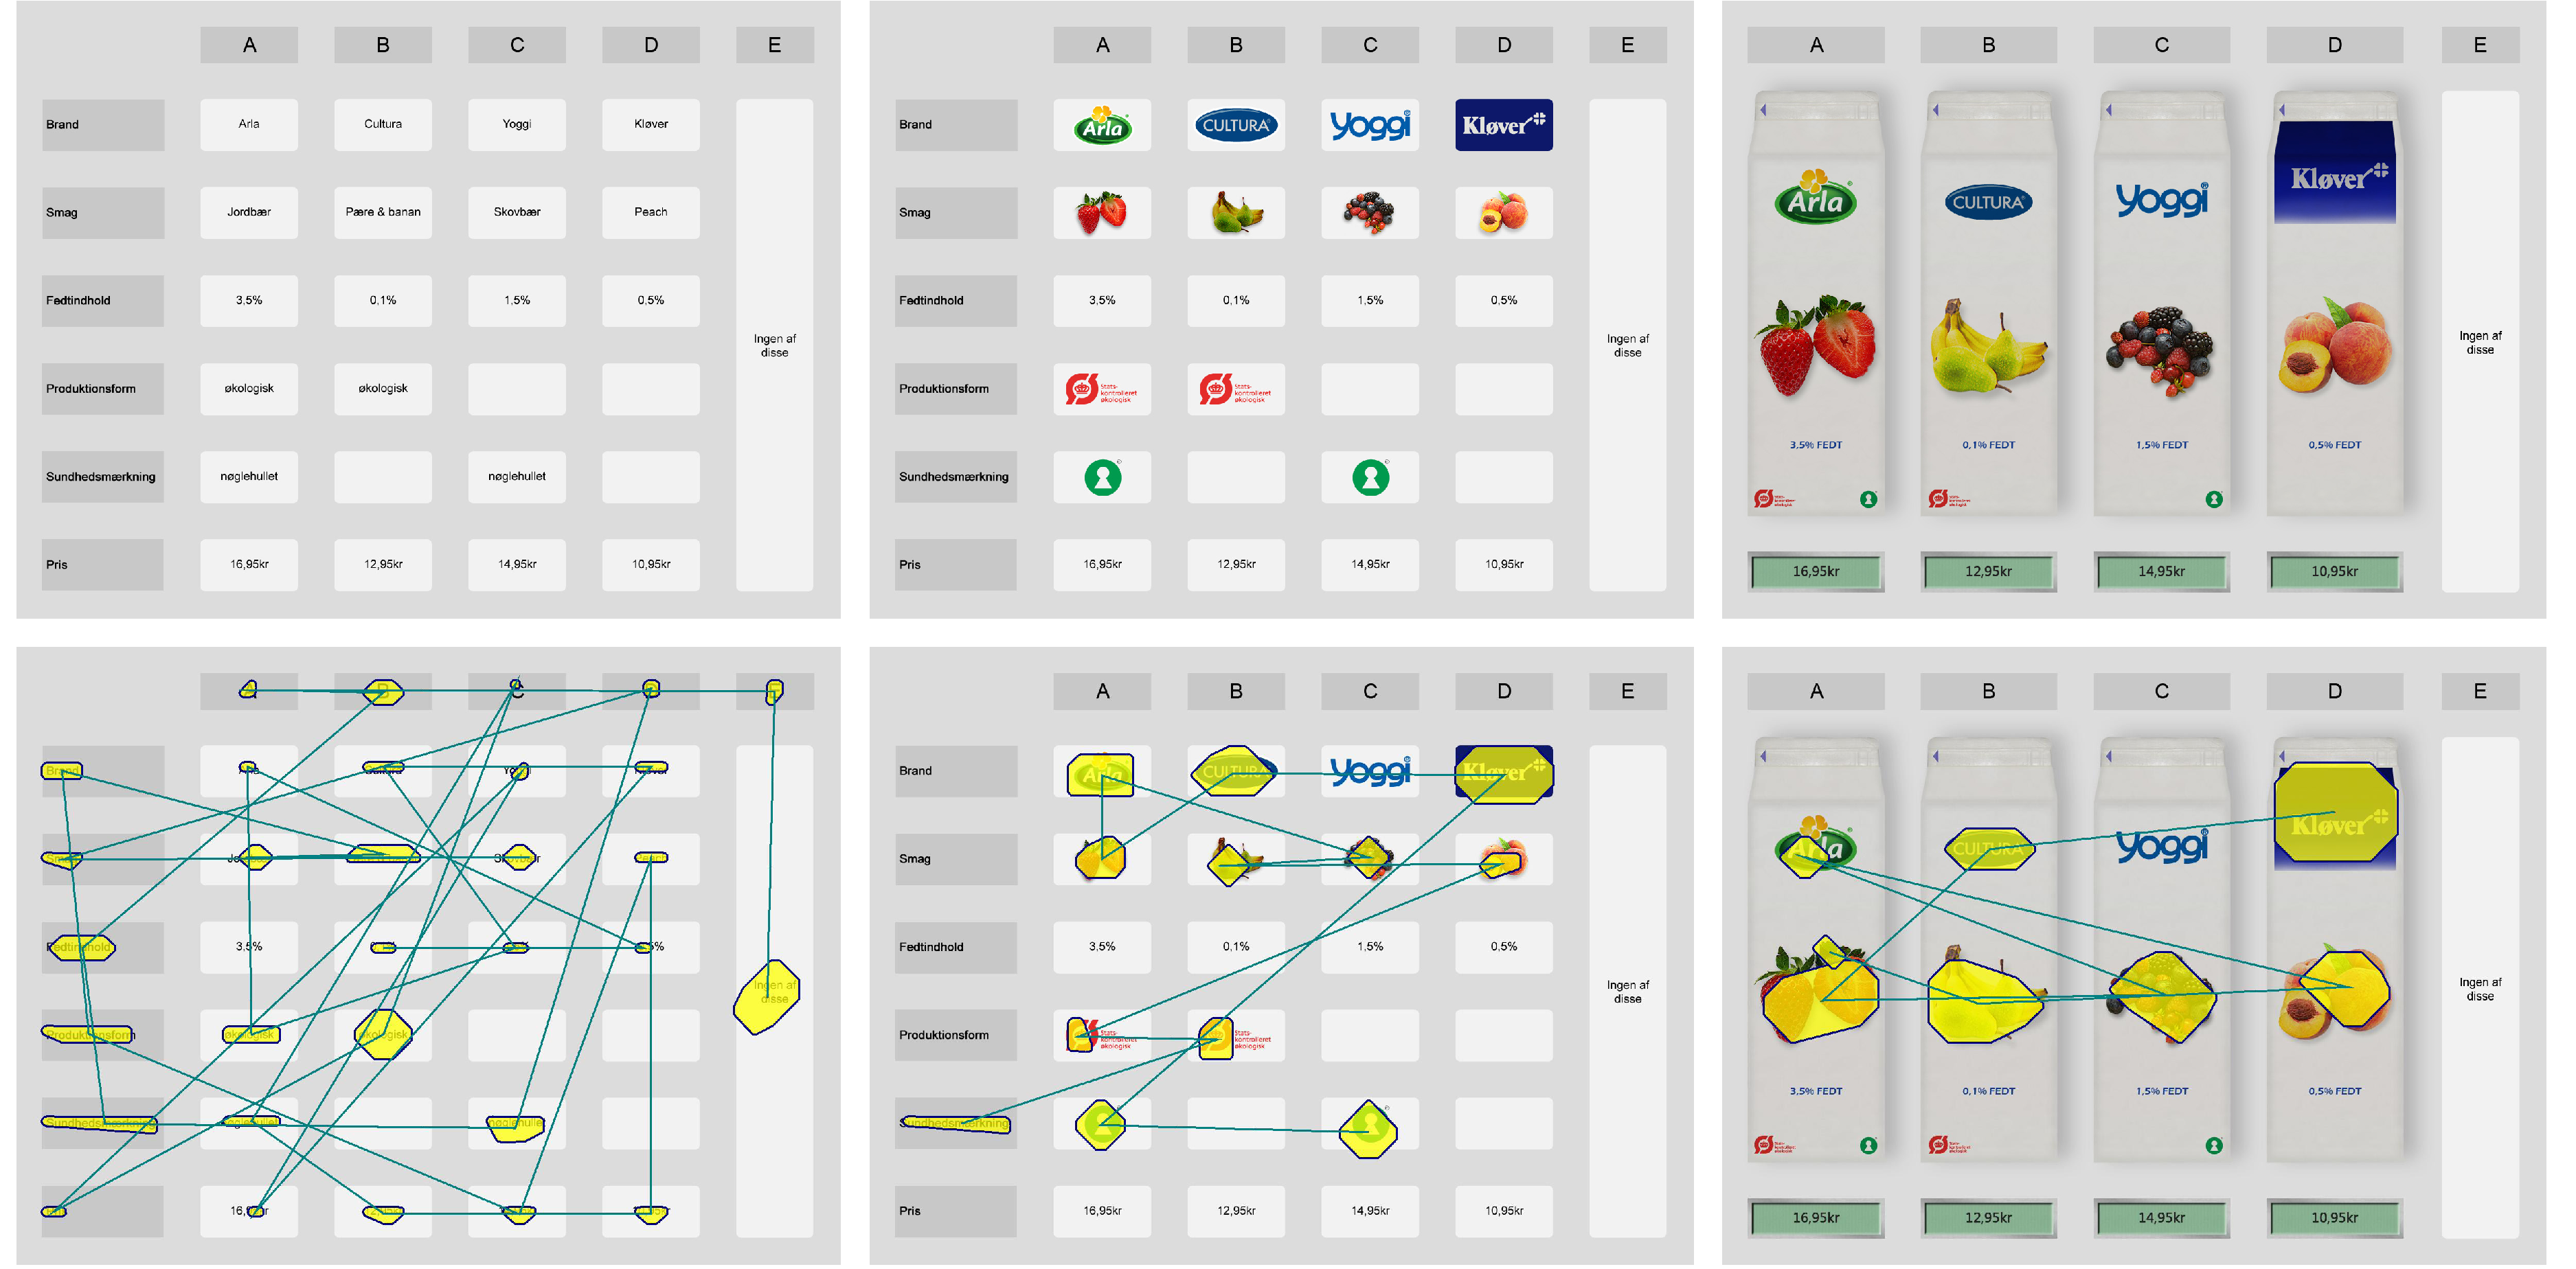
The yellow highlighted areas in Figure 2 represent the rank of product
attributes by visual saliency as assessed by the Itti-Koch algorithm
(Itti & Koch, 2001). The algorithm predicts a visual scanpath based
on a computation of visual saliency, i.e., the color, intensity, and
orientation of stimuli, and gives an impression of how attention would
be distributed in the absence of top down modulation. There were no
systematic differences in visual saliency between product attributes
in the verbal information matrix (lower left of Figure 2). In the
visual information matrix (lower middle of Figure 2), the health claim
had the highest visual saliency followed by brand (top row), flavor
(second row), and organic claim. In the product representation format,
the attribute flavor had the highest visual saliency followed by
brand. The relative size of the attributes also differed between the
product representation and the two information matrices.
Eye movements were recorded using a Tobii 2150 eye-tracker (21 in, 50
frames per sec). Respondents’ choices were recorded as mouse clicks on
the chosen product.
Figure 2: Top row from left to right: Examples of experimental stimuli for the verbal information matrix, visual information matrix and product representation format. Bottom row: Examples of the visual saliency of attributes for the three presentation formats.
2.4 Procedure
Upon entering the laboratory, participants were seated in front of the
eye tracker and randomly assigned to one of the three presentation
format conditions. After calibration, each participant completed 48
choice sets. Before each choice set, respondents had to click on a
calibration cross that centered their gaze between the two middle
choice alternatives. The first fixation of each choice set was
discarded from further analysis as this fixation is a direct
consequence of having fixated on the fixation cross immediately before
stimulus onset. The first fixation is therefore driven neither by top
down nor bottom up processes which makes it of little interest to the
analysis.
2.5 Analytical plan
The analysis unfolded in four steps: First we assessed the stability
of preferences over time. This is an important prerequisite, as any
conclusion regarding learning effects on attention would be valid only
if the participants did not change their preferences during the
experiment. The first step was carried out by splitting the choice
sets into three bins of 16 choice sets, separately estimating
individual level choice models for each of the bins and checking for
any differences within participants across the three bins. In the
second step we modelled choices across all 48 choice sets for each
participant at a time, thus providing individual level estimates of
part-worth utilities and attribute importance. In the third step we
merged the individual level choice data with the attention data and
analysed attention selection as a function of trial order, attribute
importance, and presentation format. To assess changes in top-down
modulation we computed the correlation between fixation likelihood and
attribute importance for each trial. To assess bottom-up modulation we
plotted the fixation likelihood for all six attributes across the
presentation formats. In the fourth step, we calculated effect sizes
for top down, bottom up, and interaction components separately for
each of the 48 trials to assess changes in modulatory strength over
time.
3 Results
3.1 Step 1. Analysis of stability of preferences
In the first step of the analysis, participants’ choices were analyzed
individually for three consecutive bins of 16 choice sets based on
random utility theory (Louviere, Hensher, & Swait, 2000), according
to which subjects choose the alternative that maximizes their
subjective utility. Utility is defined as:
Ui = Vi + εi
(1)
where Ui is the utility of the choice alternative i , Vi
is the observable or systematic utility component, which is a function
of its attributes, and εi is the random utility
component. The systematic component Vi is assumed to be an
additive and linear function in the attributes X . The systematic
component is defined as:
Vi =
∑
s
βsXis
(2)
where Xis is the value of alternative i with attributes s
(s = 1, … , 6) , and βs are part-worth utilities to be
estimated. Under the assumption that the random error terms
εi are independently and identically extreme value
distributed, the choice probability of alternative i being chosen
from all the alternatives in choice set T follows the closed form
expression of the multinomial logit (MNL) model
P(i) =
exp(Vi)
∑
i′ ∈ T
exp(Vi′)
(3)
Parameters are estimated with maximum likelihood where likelihood is given by:
L =
N
∏
n=1
∏
i ∈ Cn
Pn(i)fin
(4)
where N represents the number of choice observations and fin
is a dummy variable such that fin = 1 if alternative i is
chosen and fin = 0 if an alternative is not chosen from the
choice set.
Attribute importance was approximated for each participant and each
choice set bin with the share of variance explained by each attribute,
assuming that the presented attributes determine 100% of the choice
process (Lancsar, Louviere, & Flynn, 2007; Louviere & Islam,
2008). All choice models were run in Latent Gold Syntax 4.5
(Statistical Innovations Corp.).
Differences in attribute importance were calculated on an individual
level between the first and second as well as the second and third
bin. T-tests were performed to test if these changes in attribute
importance differed significantly from zero. Only brand differed
significantly between the first and second choice set bin ( t =
−3.038, p = 0.003 ), while all other attributes were not
significantly different from zero. Accordingly, results overall
suggested that participants did not change preferences over the course
of the experiment.
3.2 Step 2. Analysis of choice data
Because preferences were confirmed to be stable during the experiment,
participants' choices were analyzed individually for all 48 choice
sets according to equations (1) to (4), resulting in individual level
importances [0;100] for all six product attributes. A summary of
average attribute importance is provided in Table 1.
Table 1: Average attribute importance in percent ( N = 68 ).
Attribute
Mean
SD
Flavor
36.63
26.83
Price
19.48
19.20
Fat
14.54
14.19
Organic claim
9.93
11.04
Brand
9.90
10.42
Health claim
5.58
7.94
Note: Attributes are sorted by decreasing average importance.
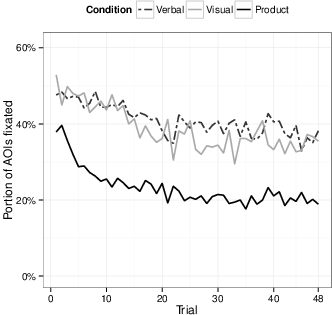
Figure 3: Proportion of AOI’s fixated across presentation formats.
3.3 Step 3. Analysis of fixation likelihood
Before analyzing fixation likelihood we first inspected the proportion
of attributes fixated per trial as a complete or very high degree of
fixation or non-fixation would go against the purpose of the
analysis. The inspection revealed that roughly 50% of the attributes
are fixated in the beginning of the experiment for the verbal and
visual information matrices and less than 40% are fixated in the
product representation format. The proportion of attributes fixated
furthermore declines throughout the experiment (see Figure 3).
In the third step of the analysis, individual level attribute
importances were merged with the eye tracking data. We estimated
fixation likelihood by means of a generalized linear mixed model
(GLMM), using fixation selection as the dependent variable ( 0
indicating no fixation to the attribute and 1 indicating that the
attribute was fixated at least once during a trial). Four independent
variables were included in the model: presentation format (verbal
information matrix, visual information matrix, and product
representation), attribute (flavor, price, brand, fat percentage,
organic claim, and health claim), attribute importance derived from
individual level estimates, and experimental trial order.
Data from all 68 participants and 48 choice sets were used to estimate
the model. The GLMM assumed a binomial distribution for the dependent
variable with a log link function and a random intercept for
participants to capture individual differences in fixation
likelihood. The model was estimated by means of maximum likelihood
estimation with quadrature approximation. This approximation was used
to obtain log likelihood values for model comparison and effect size
measurement (Schabenberger, 2007; Stroup, 2013).
We estimated a full factorial model and compared it to reduced
models. Model comparison (LR tests) revealed that the full factorial
model provided the best fit, and that model was therefore used for
interpretation. Table 2 shows the type III test of fixed effects.
All effects in the final model were significant indicating that trial
order, presentation format, attribute importance, and attribute type
as well as their interactions contribute to explain fixation
likelihood. In relation to the hypotheses we were mainly interested in
the interaction terms between trial and importance and between trial
and presentation format which would indicate changes in top down and
bottom up attention capture over time.
Table 2: Fixation likelihood as a function of presentation format (format), attribute, trial, and importance.
Table 2 shows that the model terms trial×importance and
trial×importance×attribute are significant which means
that the influence of attribute importance on fixation likelihood
changes over time. Similarly, the significance of the interaction
terms trial×format and trial×format×attribute
means that the influence of presentation format on fixation likelihood
changes over time. It is important to observe that the interpretation
of the interaction terms between importance and format is limited
because the two main effects might not be causally independent.
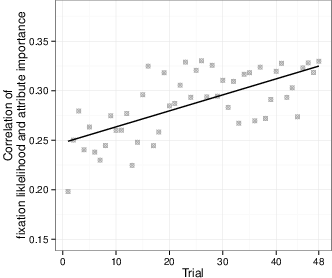
In order to interpret the changes in top down processes over time we
computed the observed correlation between fixation likelihood and
attribute importance for each trial across participants, attributes,
and presentation formats. The correlations are plotted in Figure 4. We
also fitted a linear function across the correlation values showing
that the development was significantly different from zero ( t =
6.212, p < 0.001 ). The figure shows that the observed correlation
between fixation likelihood and importance increases over time, which
in relative terms means that important attributes are more likely and
unimportant attributes are less likely to be fixated in the end,
rather than in the beginning, of the experiment in accordance with the
information-reduction hypothesis. The predicted fixation likelihood as
a function of attribute importance is shown in the Appendix 1.
Figure 4: Observed correlation between fixation likelihood and attribute importance over time.
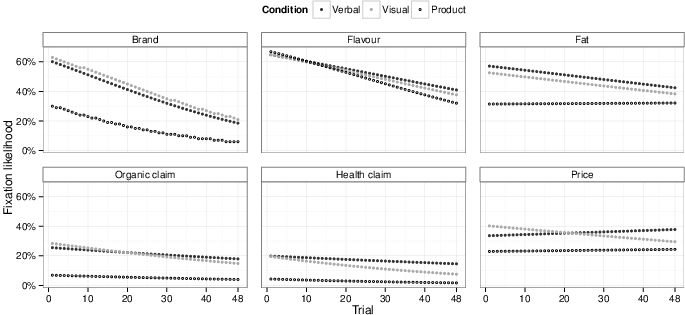
To interpret the change in bottom up processes over time we plotted
the predicted fixation likelihood for each attribute per presentation
format across trials (see Figure 5). The plots revealed that, for the
attributes brand, fat percentage, organic claim, and health claim the
slopes are fanning in over the course of the experiment, while for
flavor the slopes fan out and for price there is no clear
development. One way to interpret the plots is that the fanning in of
slopes means that the presentation formats become more similar over
time with regards to fixation likelihood while slopes fanning out
means that the presentation formats become more dissimilar. With the
exception of flavor and price, the plots suggest that the three
presentation formats become more similar over time. The diminishing
difference between the presentation formats could indicate a reduced
modulatory influence of bottom up control over time.
Figure 5: Fixation likelihood for the six attributes across presentation formats.
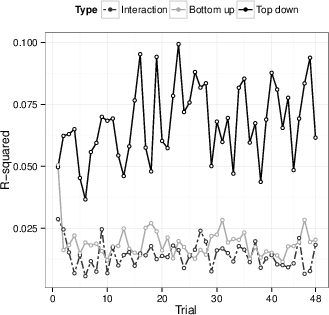
3.4 Step 4. Analysis of top down and bottom up modulatory strength over time
To determine how the modulatory strength of top down and bottom up
processes change over time we computed the effect sizes of top down
and bottom up components across trials. The idea is that if top down
and bottom up modulation changes over time this would be reflected in
the effect size of the model terms corresponding to the two cognitive
processes. Separate models were estimated for each of the 48 trials
and effect sizes were determined with partial generalized R-Squares by
stepwise integration of parameters into the model (Aerni, Scholderer,
& Ermen, 2011). An example of the computation is provided in Table 3.
Table 3: Example for goodness-of-fit and effect size statistics (Trial 1). No. indicates the model number.
Goodness-of-fit statistics
Model comparison statistics
No.
Effects entered
Effect type
lnL
LR χ2
df
p
R2
LR Δχ2
Δ df
p
Δ R2
0
None
−1028.56
1
Format
Bottom up
−1026.44
4.24
2
.120
.002
4.24
2
.120
.002
2
Attribute
−756.77
543.57
7
.000
.264
539.33
5
.000
.263
3
Importance
Top down
−728.66
599.79
8
.000
.292
56.22
1
.000
.037
4
Format×Attribute
Bottom up
−693.40
670.31
18
.000
.326
70.52
10
.000
.048
5
Attribute×Importance
Top down
−684.72
687.68
23
.000
.334
17.37
5
.004
.013
6
Importance×Format
Interaction
−682.44
692.24
25
.000
.337
4.56
2
.102
.003
7
Importance×Format×Attribute
Interaction
−665.13
726.86
35
.000
.353
34.62
10
.000
.025
The model terms were divided into top down factors (importance and
attribute×importance), bottom up factors (format and
format×attribute), and interaction factors
(importance×format and
importance×format×attribute). By adding up the partial
effect sizes for the top down, bottom up, and interaction factors,
total effect size components were calculated for the top down, bottom
up, and interaction components in each trial. The total effect size
components were analyzed by regressing trial order on each
component. The slope of the top down component was significantly
different from zero ( t = 2.212, p = .032 ), meaning that over time
the effect of top down modulation on fixation likelihood
increases. The slope of the bottom up component was not significantly
different from zero ( t = −1.192, p = .239 ), which suggests that
the modulatory strength did not change over time.1
The slope of the interaction component between top down and bottom up
factors was not significantly different from zero ( t = −1.040, p =
0.304 ). As for step 3 of the analysis, it is important to observe
that the interpretation of the interaction component is limited since
we cannot assume that the two main effects are causally independent.
Figure 6: Bottom up, top down and interaction effect sizes over time.
4 Discussion
4.1 Summary of results
In line with the reward-based model of gaze allocation (Hayhoe &
Rothkopf, 2011; Tatler et al., 2011) we hypothesized that top down
modulation is learned through interaction with the environment and
that modulatory strength increases as participants become more
experienced with a task or situation. The modulatory increase will
lead to higher fixation likelihood for task relevant stimuli and lower
fixation likelihood for task redundant stimuli consistent with the
information reduction hypothesis (Haider & Frensch, 1999). This
prediction was expressed in H1. Furthermore, we hypothesized that an
increase in top down modulatory strength would reduce bottom up
attention capture as the two processes have been shown to compete for
control over eye movements (Desimone & Duncan, 1995; Theeuwes,
2010). This prediction was expressed in H2.
In order to examine the hypotheses we conducted a repeated-choice
experiment manipulating three different presentation formats. In the
first step of the analysis we compared the choice models based on bins
of the first, middle and last groups of choice sets. The analysis
revealed that participants were largely stable in their preferences
throughout the experiment, supporting an assumption required for
conclusions about learning effects. In the second step of the analysis
we modeled individual level estimates of attribute importance. In the
third step we merged the individual level estimates with the attention
data to model and analyze the effect of top down and bottom up factors
over time. The analysis revealed significant interaction effects
between trial order and attribute importance and trial order and
presentation format, indicating a change over time in top down and
bottom up processes. To interpret the direction of effects, we
computed the correlation across trials between fixation likelihood and
importance. Plotting the correlations revealed a positive slope
demonstrating that fixation likelihood increases over time when an
attribute is of high importance to the decision maker relative to when
the attribute is of low importance to the decision maker. In order to
interpret the direction of effects for bottom up processes, we plotted
the predicted fixation likelihood for all six attributes across the
three presentation formats. The plots revealed that, for the most
part, the slopes were fanning in, indicating that the fixation
likelihoods became more similar across presentation formats over time.
In the fourth step of the analysis we tested the modulatory strength
of top down and bottom up processes over time. In order to do so, we
estimated the effects sizes of importance and presentation format
factors for each trial separately. The analysis revealed an increase
in the effect size of importance over time, suggesting that top down
modulation increases over time, thus confirming H1. The results for
bottom up modulation were less clear, as the effect size of
presentation format factors did decrease over time but not
significantly. Future experiments with more observations are required
to further test changes in effect sizes in order to test H2.
4.2 Alternative interpretations of our data
So far, we have mainly focused on one interpretation of our data in
accordance with the information reduction hypothesis (Haider &
Frensch, 1999) and the reward based model of gaze allocation (Hayhoe
& Rothkopf, 2011; Tatler et al., 2011). However, it is worth
considering at least a few alternative interpretations of the
data. Although the information reduction hypothesis considers
developments in perceptual efficiency, it is worthwhile to consider
whether developments in cognitive efficiency could help to explain the
results. If we think of cognitive efficiency in terms of cognitive
skill acquisition, there are at least four possible interpretations
(Lee & Anderson, 2001): The decrements in fixation proportions and
fixation likelihood could have been driven by cognitive skill
acquisition through a) transforming or collapsing the individual
components of the procedure, b) strengthening the components of the
procedure, or c) changing the procedure altogether. Finally we can
also conceive of cognitive skill acquisition as a process of becoming
familiar with the task requirements thereby reducing initial task
confusion.
The first view of cognitive skill acquisition is to see it as a result
of transforming or collapsing a multi-step procedure into one or more
macro procedures (Newell & Rosenbloom, 1981). One could, for
instance, hypothesize that the decrease in proportion of fixations
would stem from participants collapsing smaller process steps such as
scanning alternatives for an overview, comparing alternatives or
attributes, checking chosen alternative and so forth into larger
process steps. One possibility could, for instance, be to collapse two
binary comparison steps into one trinary comparison (on binary and
trinary comparisons see Russo & Leclerc, 1994) thereby decreasing
the time and number of fixations needed to complete the decision
task. Based on our class of analysis we cannot exclude the possibility
that participants were collapsing process steps and thereby decreasing
the number of fixations and decision times. Future studies might
address this question using different classes of scanpath analyses
(Holmqvist et al., 2011). It would, for instance, be interesting to
ask whether there is a shift in binary to trinary comparisons over time
or whether other steps in the decision process are being transformed
over time.
A second view of cognitive skill acquisition is to see it as resulting
from increased efficiency in performing the individual task components
(Anderson, 1982). Although this particular view is strongly associated
with the notion of “strengthening” in Anderson’s ACT theory, we
could also think of efficiency in terms of automaticity. It seems
plausible that individual process steps will require more deliberation
in the early trials, while the later trials might be characterized by a
more automatic execution. Another possibility is that participants
will rely increasingly on memory retrieval, for instance, when
searching for acceptable attribute levels. Because of the D-optimal
design all attribute levels were present in every choice set which
would allow participants to retrieve the last attribute level from
memory after having fixated the first three levels. Such a mixed
visual search and memory retrieval approach would lead to a decrease
in the number of fixations needed to complete the decision task and
perhaps also a reduction in decision time. Based on our analyses,
we cannot exclude the possibility that participants became more
efficient in terms of automaticity, nor can we do so by simply
inspecting individual fixation durations over time, as fixation
durations might not be closely related to deliberate versus automatic
decisions (Horstmann, Ahlgrimm, & Glöckner, 2009). Future studies
might examine such processes by analyzing changes to the
scanpath over time or by examining multiple process measures
(Glöckner, 2009).
A third view of cognitive skill acquisition is to see it as resulting
from selecting a faster method or strategy (Crossman, 1959). In a
decision task this could mean that participants change from one
decision strategy to another that is faster, such as going from a
weighted additive strategy to a lexicographic or satisficing strategy
(see the Introduction). If we qualitatively compare individual
participants’ scanpaths from the first and the last trials it does, in
fact, seem like the participants are changing their decision strategy
dramatically. While the first few trials are characterized by
participants fixating many or most of the attributes, the last trials
are often characterized by the participants fixating only one or two
rows of attributes. Such a simple inspection suggests that
participants over time go from a slower strategy involving more
fixations to a faster strategy involving fewer fixations. The only
problem with this claim is that the change in strategy would have to
occur gradually, which is in conflict with the way decision strategies
are currently specified. If we adhere to the view that decision
strategies are qualitatively different and discrete processes then the
gradual change in fixation patterns can suggest two things: a) either
participants use the same decision strategy throughout the experiment
but the way it is implemented in a search process changes (concerning
instability of search patterns (Costa-Gomes et al., 2001; Svenson,
1979) or b) participants simply do not use decision strategies in the
form or to the extent they have been specified in the decision
literature (for a related discussion see Orquin & Mueller Loose,
2013). In the case of participants maintaining a stable decision
strategy but changing their fixation pattern over time, it is unlikely
that we can either confirm or reject the hypothesis based on the
choice and fixation data alone, but future studies might look into
this question using other techniques. Regarding the second
implication, one can either reach the conclusion that decision makers
do not rely on decision strategies or that decision strategies are not
discrete entities. Future studies might wish to relax the assumption
about discrete and deterministic decision strategies and look into
probabilistic or stochastic specifications instead (Bergert &
Nosofsky, 2007). Given a relaxed assumption about discrete decision
strategies, we cannot exclude the possibility that participants
changed their strategy during the experiment and that this strategy
change explains the development in proportion of fixations and
fixation likelihood. However, we can exclude the possibility that
participants made discrete changes in their decision strategies,
since our data reveal a gradual change in fixation patterns.
Another possible view of our data is to see the decline in fixation
proportions and fixation likelihood as a consequence of task-level
familiarization, or in other words a reduction in task-confusion. This
hypothesis suggests that participants during the first few trials are
uncertain about the task requirements, and this uncertainty would
increase the number of fixations because additional time and effort is
spent on becoming familiar with the task. If participants are confused
about the task requirements during the first few trials, we should
also expect them to be less consistent in their choices. Inspecting
the development in choice consistency over time indicates that
participants are, in fact, less consistent in the beginning of the
experiment. However, two aspects speak against participants being
confused: First of all, choice consistency increases gradually
throughout the experiment, albeit with the strongest increase in
consistency in the beginning of the experiment (see Appendix
2). Second, even in the first trial participants are highly
consistent, with more that 70% choosing the highest utility
alternative. The high degree of consistency suggests that participants
cannot be confused about the task requirements. Although it is
plausible that participants experienced a certain degree of confusion
in the first couple of trials it is difficult to say whether this
could explain the development in proportion of fixations or in top
down and bottom up control. Future studies could look into this
process by more directly manipulating task confusion and test whether
it amplifies, for instance, bottom up control of attention.
5 Implications and future research
The study has several implications for research on decision making, as
well as research on eye movements and attention. Firstly, we replicate
findings from prior studies on top down and bottom up effects in
decision making (Orquin & Mueller Loose, 2013), and extend these
findings by showing that the modulatory processes change over
time. The study lends support to the reward-based model of gaze
allocation (Hayhoe & Rothkopf, 2011; Tatler et al., 2011) by showing
that learning increases top down modulation of attention. Furthermore,
we present evidence suggesting that top down and bottom up processes
compete for influence over eye movements, and that increases in top
down modulation could diminish bottom up modulation. However, based on
this experiment alone, we cannot say whether the likely reduction in
bottom up modulation is caused by the increase in top down
modulation. Another possibility could be that bottom up modulation
decreases over time even when top down modulation remains equal. On
the other hand, both theoretical reasons (Desimone & Duncan, 1995)
and empirical findings (Kowler, 2011) suggesting that the two
processes influence each other in what could be a competition for
control over eye movements. Future studies should address this issue
and examine the circumstances under which top down and bottom up
processes compete, and when they interact to amplify attention capture
(e.g., Folk, Remington, & Johnston, 1992).
Furthermore, due to the experimental approach, several bottom up
factors were manipulated simultaneously across the three presentation
formats. Although we could demonstrate separate effects of top down
and bottom up processes with this approach, it leaves open the
question of what particular bottom up processes were acting on
attention capture. Future studies could take advantage of a more
structured approach in which bottom up factors, such as visual
saliency, size, and position, are manipulated separately.
The study also lends support to the information reduction hypothesis
(Haider & Frensch, 1999), by showing that participants learn over
time to fixate important information and ignore less important
information. The results imply that participants in choice experiments
become more efficient at a perceptual level over time, which could
explain how decision time decreases and accuracy increases over the
course of repeated-trial experiments. We do not wish to say that no
gains occur at a cognitive skill level, which most likely is the case,
however our findings suggest that increased perceptual efficiency
plays an important role in the observed reduction in decision time and
increase in accuracy. An interesting question for future research is,
therefore, to examine the degree to which faster decision time and
higher accuracy are explained by gains in perceptual efficiency and
cognitive skill level.
Another implication from our findings relates to process tracing
studies, particularly studies measuring eye movements. The fact that
attention processes change with learning should matter to most
experimenters, since the vast majority of eye tracking studies in
judgment and decision making are based on repeated-trials experiments,
which must lead to learning effects of the sort we have
demonstrated. Our data show that learning occurs rapidly right from
the beginning of the experiment. Particularly the effect of bottom up
modulation is subject to a steep decline in the first 3–4 trials (see
Figure 6). It could be problematic to aggregate process measures over
time, particularly if the goal is to improve choice models based on
process measures (Balcombe, Fraser, & McSorley, 2011; Hensher, Rose,
& Greene, 2005; Meißner, Musalem, & Huber, 2012; Scarpa, Zanoli,
Bruschi, & Naspetti, 2013). Assuming that temporal changes in
top-down and bottom-up processes is problematic for the estimation of
choice models, one could possibly counteract or at least diminish this
change by randomizing the position of attributes within-subjects. It
has, for instance, been shown that randomizing the position of
information elements from trial to trial diminishes information
reduction (Haider & Frensch, 1999). However, randomizing the
attribute position within-subjects may lead to other effects besides
diminishing information reduction, and more studies would be needed to
examine the effects of such a manipulation on top-down and bottom-up
processes.
Last but not least, throughout the study we have argued that temporal
dynamics constitute a theoretical challenge to the strategy selection
view of decision making. In the introduction we demonstrated that no
plausible ordering of decision strategies leads to a decrease in
decision time and increase in accuracy. In the previous section we
discussed different possibilities for relaxing the assumptions about
decision strategies and whether this could explain our
observations. Although relaxing the assumptions about strategy
selection and what defines a decision strategy would fit the theory
better, we suggest that a more promising approach would be to
reconsider the role of visual processes in decision making.
References
Aerni, P., Scholderer, J., & Ermen, D. (2011). How would Swiss consumers decide if they had freedom of choice? Evidence from a field study with organic, conventional and GM corn bread. Food Policy, 36, 830–838. http://dx.doi.org/10.1016/j.foodpol.2011.08.002.
Balcombe, K., Fraser, I., & McSorley, E. (2011). Visual attention and attribute attendance in multi-attribute choice experiments. Department of Agricultural Food Economics, University of Reading. Reading.
Bergert, F. B., & Nosofsky, R. M. (2007). A response-time approach to comparing generalized rational and take-the-best models of decision making. Journal of Experimental Psychology: Learning, Memory, and Cognition, 33, 107–129. http://dx.doi.org/10.1037/0278-7393.33.1.107.
Bialkova, S., & van Trijp, H. C. M. (2011). An efficient methodology for assessing attention to and effect of nutrition information displayed front-of-pack. Food Quality and Preference, 22, 592–601. http://dx.doi.org/10.1016/j.foodqual.2011.03.010.
Carlsson, F., Mørkbak, M. R., & Olsen, S. B. (2011). The first time is the hardest: A test of ordering effects in choice experiments. Paper presented at the International Choice Modelling Conference, 4–6 July 2011, Leeds, UK.
Chisholm, J. D., Hickey, C., Theeuwes, J., & Kingstone, A. (2010). Reduced attentional capture in action video game players. Attention, Perception, & Psychophysics, 72, 667–671. http://dx.doi.org/10.3758/APP.72.3.667.
Corbetta, M., & Shulman, G. L. (2002). Control of goal-directed and stimulus-driven attention in the brain. Nature Review Neuroscience, 3, 201–215. http://dx.doi.org/10.1038/nrn755.
Costa-Gomes, M., Crawford, V. P., & Broseta, B. (2001). Cognition and Behavior in Normal-Form Games: An Experimental Study. Econometrica, 69, 1193–1235. http://dx.doi.org/10.1111/1468-0262.00239
Dai, X., Brendl, C. M., & Ariely, D. (2010). Wanting, liking, and preference construction. Emotion, 10, 324–334. http://dx.doi.org/10.1037/a0017987.
Deaner, R. O., Khera, A. V., & Platt, M. L. (2005). Monkeys pay per view: adaptive valuation of social images by rhesus macaques. Current Biology, 15, 543–548. http://dx.doi.org/10.1016/j.cub.2005.01.044.
Droll, J. A., Gigone, K., & Hayhoe, M. M. (2007). Learning where to direct gaze during change detection. Journal of Vision, 7, 1–12. http://dx.doi.org/10.1167/7.14.6.
Fiedler, S., & Glöckner, A. (2012). The dynamics of decision making in risky choice: An Eye-tracking analysis. Frontiers in Psychology, 3, 1–18. http://dx.doi.org/10.3389/fpsyg.2012.00335.
Folk, C. L., Remington, R. W., & Johnston, J. C. (1992). Involuntary covert orienting is contingent on attentional control settings. Journal of Experimental Psychology: Human Perception and Performance, 18, 1030–1044. http://dx.doi.org/10.1037//0096-1523.18.4.1030.
Gegenfurtner, A., Lehtinen, E., & Säljö, R. (2011). Expertise differences in the comprehension of visualizations: A meta-analysis of eye-tracking research in professional domains. Educational Psychology Review, 23, 523–552. http://dx.doi.org/10.1007/s10648-011-9174-7.
Glöckner, A. (2009). Investigating intuitive and deliberate processes statistically: The multiple-measure maximum likelihood strategy classification method. Judgment and Decision Making, 4, 186–199.
Glöckner, A., & Betsch, T. (2008). Modeling option and strategy choices with connectionist networks: Towards an integrative model of automatic and deliberate decision making. Judgment and Decision Making, 3, 215–228. http://dx.doi.org/10.2139/ssrn.1090866.
Green, C. S., & Bavelier, D. (2006). Effect of action video games on the spatial distribution of visuospatial attention. Journal of Experimental Psychology. Human Perception and Performance, 32, 1465–1478. http://dx.doi.org/10.1037/0096-1523.32.6.1465.
Haider, H., & Frensch, P. A. (1999). Eye movement during skill acquisition: More evidence for the information-reduction hypothesis. Journal of Experimental Psychology: Learning, Memory, and Cognition, 25, 172–190. http://dx.doi.org/10.1037//0278-7393.25.1.172.
Hayhoe, M. M., & Rothkopf, C. A. (2011). Vision in the natural world. Wiley Interdisciplinary Reviews: Cognitive Science, 2, 158–166. http://dx.doi.org/10.1002/wcs.113.
Hegarty, M., Canham, M. S., & Fabrikant, S. I. (2010). Thinking about the weather: How display salience and knowledge affect performance in a graphic inference task. Journal of Experimental Psychology: Learning, Memory, and Cognition, 36, 37–53. http://dx.doi.org/10.1037/a0017683.
Hensher, D. A., Rose, J., & Greene, W. H. (2005). The implications on willingness to pay of respondents ignoring specific attributes. Transportation, 32, 203–222. http://dx.doi.org/10.1007/s11116-004-7613-8.
Hess, S., Hensher, D., & Daly, A. (2012). Not bored yet - revisiting respondent fatigue in stated choice experiments. Transportation Research Part A, 46, 626–644. http://dx.doi.org/10.1016/j.tra.2011.11.008.
Holmqvist, K., Nyström, M., Andersson, R., Dewhurst, R., Jarodzka, H., & Van de Weijer, J. (2011). Eye tracking: A comprehensive guide to methods and measures. Oxford University Press.
Horstmann, N., Ahlgrimm, A., & Glöckner, A. (2009). How distinct are intuition and deliberation? An eye-tracking analysis of instruction-induced decision modes. Judgment and Decision Making, 4, 335–354. http://dx.doi.org/10.2139/ssrn.1393729.
Huang, M. Y., & Kuo, F. (2011). An eye-tracking investigation of internet consumers’ decision deliberateness. Internet Research, 21, 541–561. http://dx.doi.org/10.1108/10662241111176362.
Itti, L., & Koch, C. (2001). Computational modeling of visual attention. Nature Reviews Neuroscience, 2, 194–203.
Johnson, E. J., & Payne, J. W. (1985). Effort and accuracy in choice. Management Science, 31, 395–414.
Knoepfle, D. T., Wang, J. T., & Camerer, C. F. (2009). Studying learning in games using eye-tracking. Journal of the European Economic Association, 7, 388–398. http://dx.doi.org/10.1162/JEEA.2009.7.2-3.388.
Lancsar, E., Louviere, J. J., & Flynn, T. N. (2007). Several methods to investigate relative attribute impact in stated preference experiments. Social Science & Medicine, 64, 1738–1753.
Lee, F. J., & Anderson, J. R. (2001). Does learning a complex task have to be complex?: A study in learning decomposition. Cognitive Psychology, 42, 267–316. http://dx.doi.org/10.1006/cogp.2000.0747.
Louviere, J. J., Hensher, D. A., & Swait, J. D. (2000). Stated choice methods: Analysis and application. Cambridge: Cambridge University Press.
Louviere, J. J., & Islam, T. (2008). A comparison of importance weights/measures derived from choice-based conjoint, constant sum scales and best-worst scaling. Journal of Business Research, 61, 903–911. http://dx.doi.org/10.1016/j.jbusres.2006.11.010.
Meißner, M., & Decker, R. (2010). Eye-tracking information processing in choice-based conjoint analysis. International Journal of Market Research, 52, 591–610. http://dx.doi.org/10.2501/s147078531020151x.
Meißner, M., Musalem, A., & Huber, J. (2012). Gaze cascade effects in repeated conjoint choices. Paper presented at the Australian and New Zealand Marketing Academy (ANZMAC) Conference Adelaide.
Mueller Loose, S., & Orquin, J. (2012). How stimuli presentation format affects visual attention and choice outcomes in choice experiments. Paper presented at the Australian and New Zealand Marketing Academy Conference, Adelaide.
Mueller, S., Lockshin, L., & Louviere, J. J. (2010). What you see may not be what you get: Asking consumers what matters may not reflect what they choose. Marketing Letters, 21, 335–350. http://dx.doi.org/10.1007/s11002-009-9098-x.
Newell, A., & Rosenbloom, P. S. (1981). Mechanisms of skill acquisition and the law of practice. In J. R. Anderson (Ed.), Cognitive skills and their acquisition (pp. 1–55). Hillsdale, NJ: Erlbaum.
Nordfang, M., Dyrholm, M., & Bundesen, C. (2013). Identifying bottom-up and top-down components of attentional weight by experimental analysis and computational modeling. Journal of Experimental Psychology: General, 142, 510–535. http://dx.doi.org/10.1037/a0029631.
Nyamsuren, E., & Taatgen, N. A. (2013). Set as an instance of a real-world visual-cognitive task. Cognitive Science, 37, 146–175. http://dx.doi.org/10.1111/cogs.12001.
Orquin, J. L., & Mueller Loose, S. (2013). Attention and choice: A
review on eye movements in decision making. Acta Psychologica,
144, 190–206.
http://dx.doi.org/10.1016/j.actpsy.2013.06.003.
Patalano, A. L., Juhasz, B. J., & Dicke, J. (2010). The relationship between indecisiveness and eye movement patterns in a decision making informational search task. Journal of Behavioral Decision Making, 23, 353–368. http://dx.doi.org/10.1002/bdm.661.
Payne, J. W., Bettman, J. R., & Johnson, E. J. (1988). Adaptive strategy selection in decision-making. Journal of Experimental Psychology: Learning, Memory and Cognition, 14, 534–552. http://dx.doi.org/10.1037//0278-7393.14.3.534.
Riedl, R., Brandstätter, E., & Roithmayr, F. (2008). Identifying decision strategies: A process-and outcome-based classification method. Behavior Research Methods, 40, 795–807.
Russo, J. E., & Leclerc, F. (1994). An eye-fixation analysis of choice processes for consumer nondurables. Journal of Consumer Research, 21, 274–290. http://dx.doi.org/10.1086/209397.
Salvucci, D. D., & Taatgen, N. A. (2008). Threaded cognition: An integrated theory of concurrent multitasking. Psychological Review, 115, 101–130. http://dx.doi.org/10.1037/0033-295X.115.1.101.
Scarpa, R., Zanoli, R., Bruschi, V., & Naspetti, S. (2013). Inferred and stated attribute non-attendance in food choice experiments. American Journal of Agricultural Economics, 95, 165–180. http://dx.doi.org/10.1093/ajae/aas073.
Schabenberger, O. (2007). Growing up fast: SAS 9.2 enhancements to the GLIMMIX procedure. Paper presented at the SAS Global Forum.
Smead, R. J., Wilcox, J. B., & Wilkes, R. E. (1981). How valid are product descriptions and protocols in choice experiments? Journal of Consumer Research, 8, 37–42. http://dx.doi.org/10.1086/208838.
Street, D., & Burgess, L. (2007). The construction of optimal stated choice experiments: Theory and methods. Hoboken, New Jersey: John Wiley & Sons, Inc.
Stroup, W. W. (2013). Generalized Linear Mixed Models: Modern Concepts, Methods and Applications. CRC PressI Llc.
Söllner, A., Bröder, A., & Hilbig, B. E. (2013). Deliberation versus automaticity in decision making: Which presentation format features facilitate automatic decision making? Judgment and Decision Making, 8, 278–298.
Tatler, B. W., Hayhoe, M. M., Land, M. F., & Ballard, D. H. (2011). Eye guidance in
natural vision: Reinterpreting salience. Journal of Vision, 11, 1–23.
http://dx.doi.org/10.1167/11.5.5.
Toubia, O., de Jong, M. G., Stieger, D., & Füller, J. (2012). Measuring Consumer Preferences Using Conjoint Poker. Marketing Science, 31, 138–156. http://dx.doi.org/10.1287/mksc.1110.0672.
Trommershäuser, J., Glimcher, P. W., & Gegenfurtner, K. R. (2009). Visual processing, learning and feedback in the primate eye movement system. Trends in Neurosciences, 32, 583–590. http://dx.doi.org/10.1016/j.tins.2009.07.004.
van Herpen, E., & van Trijp, H. C. M. v. (2011). Front-of-pack nutrition labels. Their effect on attention and choices when consumers have varying goals and time constraints. Appetite, 57, 148–160. http://dx.doi.org/10.1016/j.appet.2011.04.011.
Van Raaij, W. F. (1977). Consumer information processing for different information structures and formats. Advances in Consumer Research, 4, 176–184.
Visschers, V. H. M., Hess, R., & Siegrist, M. (2010). Health motivation and product design determine consumers’ visual attention to nutrition information on food products. Public Health Nutrition, 13, 1099–1096. http://dx.doi.org/10.1017/S1368980009993235.
West, G. L., Al-Aidroos, N., & Pratt, J. (2013). Action video game experience affects oculomotor performance. Acta Psychologica, 142, 38–42. http://dx.doi.org/10.1016/j.actpsy.2011.08.005.
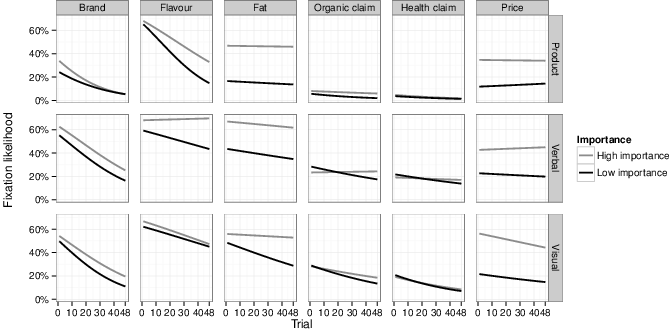
Appendix 1
Fixation likelihood for the six attributes across presentation formats
as a function of trial for high importance and low importance. The
upper and lower quartiles were used as measures of high and low
importance respectively.
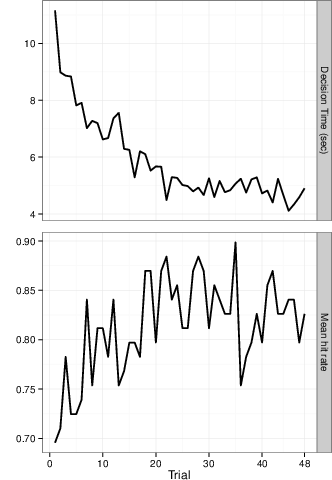
Appendix 2
Decision time a) and hit rate b) as function of trial. The hit rate is
the percentage of participants who choose the alternative with the
highest utility according to their own preferences. The hit rate
indicates the degree of choice consistency and is conceptually similar
to the measure of choice accuracy in Payne et al. 1988.
Aarhus University, Business and Social Sciences, MAPP - Department of Business Administration, Bartholins Allé 10, 8000 Aarhus C, Denmark. Email:
jalo@asb.dk.
In order to
test if the significance level could be due to low statistical power
(48 observations) we bootstrapped the data increasing the number of
observations to 200. By bootstrapping the slope became significantly
different from zero.