| Figure 1: The trust game. |
Judgment and Decision Making, Vol. 9, No. 2, March 2014, pp. 90-103
Outcomes and expectations in dilemmas of trustAnthony M. Evans* Joachim I. Krueger# |
Rational trust decisions depend on potential outcomes and expectations of reciprocity. In the trust game, outcomes and expectations correspond to the structural factors of risk and temptation. Two experiments investigated how risk and temptation influenced information search and final decisions in the trust game. The central finding was that trustors underemphasized temptation relative to its effects on the expected value of trust. Instead, trustors made decisions egocentrically, focusing on potential outcomes. In Experiment 1, information search data revealed that trustors often made decisions without learning about the payoffs related to temptation. Experiment 2 investigated whether trustors were able to use temptation to form accurate expectations of reciprocity. Trustors understood, but underestimated, the relationship between temptation and the probability of reciprocity. Moreover, they did not fully consider expectations in their final trust decisions. Changes in potential outcomes had larger effects on trust than comparable changes in expectations. These results suggest that levels of trust are too high when the probability of reciprocity is low and too low when that probability is high.
Keywords: trust, reciprocity, social dilemmas, egocentrism.
Trust plays a critical role in the lives of managers (Murnighan, 2012), consumers (Hoffman, Novak, & Peralta, 1999), and negotiators (Olekalns & Smith, 2005). The dominant view in economics and psychology is that acts of trust are based on expectations of reciprocity. Trustors are thought to form an educated guess about the other party’s intentions and then respond accordingly (Binmore, 2007; Mayer, Davis, & Schoorman, 1995; Rotter, 1967). Trust, in other words, is treated as a matter of strategic perspective-taking. However, a body of research on social cognition suggests that people often lack the will or the capacity to take the perspective of others (Alicke & Sedikides, 2010). Considering another person’s point-of-view requires time and cognitive effort (Lin, Keysar, & Epley, 2011), and, even when perspective-taking occurs, it is often inaccurate (Ekman & O’Sullivan, 1991).
In this report, we propose that decisions to trust arise from egocentric reasoning (Evans & Krueger, 2011). Trustors focus on self-relevant outcomes, that is, on their potential gains and losses, while neglecting the trustee’s incentives to reciprocate trust or to betray it (Malhotra, 2004; Snijders & Keren, 1999). We investigate this idea with process tracing methods that record how trustors search for information, and examine the accuracy of trustors’ expectations of reciprocity.
In a now classic definition, Rousseau, Sitkin, Burt, and Camerer (1998, p. 395) proposed that trust is “a psychological state comprising the intention to accept vulnerability based upon an expectation of reciprocity.” This definition has two key properties. Vulnerability refers to the possibility of a negative outcome, and the expectation of reciprocity refers to the trustor’s belief that a negative outcome can be avoided. These properties correspond to two distinctive judgments. The trustor needs to identify and evaluate the potential outcomes of trust, and to estimate the probabilities of those outcomes occurring.
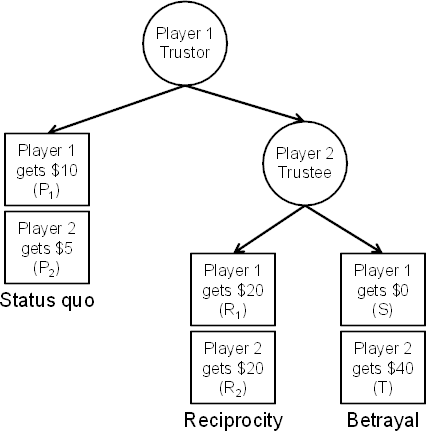
Figure 1: The trust game.
Most research studies on trust use an experimental game, which captures the basic dilemma (Camerer, 2003; Dasgupta, 1988). Two players act in sequence, as illustrated in Figure 1. The first player, or trustor, chooses between keeping the status quo by terminating the game with the payoffs of P1 and P2, and continuing the game by placing trust in the second player. This second player is the trustee, who now has a choice between reciprocity and betrayal. Reciprocity means that the two players receive similar payoffs (R1 ≈ R2), whereas betrayal means that the trustor receives less (S) than the trustee (T). To represent the idea that trust adds economic value, the initial act of trust multiplies the total wealth available to both players (R1 and R2 are better than P1 and P2, respectively).
In the trust game, the psychological element of vulnerability arises from differences among the trustor’s payoffs (P1, R1, and S). Snijders and Keren (1999) proposed that the term “risk” replace the term “vulnerability,” and to use the ratio of (P1−S)/(R1−S) as a quantitative index. Risk is high when there is much to lose and little to gain from trusting. The expectation of reciprocity depends on the trustee’s payoffs. Inasmuch as the payoff of betrayal (T) is greater than the payoff of reciprocity (R2), a self-interested trustee has incentive to defect. This difference is scaled by the value of the trustee’s largest possible payoff (T). This means that temptation is given by the ratio of (T−R2)/T.1 Temptation is large when betrayal produces a large bonus for the trustee.
A scientific explanation of trust must describe how people use outcomes and expectations to reach a decision. Game-theoretic models assume that trustors decide by predicting trustees’ responses, then comparing the utility of trust with the status quo (Binmore, 2007). According to orthodox game theory, trustors realize that trustees have no monetary incentives to reciprocate once they have been trusted. They will defect for any T > R2. A self-interested trustor maintains the status quo unless there is a prospect of repeated play, in which case trust and reciprocity may reach a positive equilibrium (Gintis, 2009). These pessimistic predictions for one-shot exchanges do not describe real-world behavior. Experiments around the world show intermediate levels of trust and reciprocity, even when there is no possibility of future interactions (Johnson & Mislin, 2011). These findings suggest that many individuals have positive expectations of reciprocity. Taking these expectations into account, a modified game-theoretic approach predicts that trust decisions are based on expected value, the product of the trustor’s potential outcomes weighted by the perceived probabilities with which they will occur.
Several influential psychologists have also emphasized the importance of positive expectations. Writing about trust in social institutions, Rotter (1967) proposes that expectations of teachers, politicians, and journalists are integral to the concept of trust. Yamagishi’s (1986) General Trust Scale defines trust as individual differences in positive expectations of people in general. Others further distinguish between the cognitive and affective types of trust (Chua, Ingram, & Morris, 2008; Johnson-Georges & Swap, 1982). Cognitive trust consists of the expectation of the trustee’s competence and reliability, whereas affective trust is the expectation of benevolence. Both dimensions characterize the perceptions of the other party.
As this brief review shows, expectations of reciprocity play a normative role in trust decisions and there is empirical evidence that they matter. Yet, the question remains of whether individual trustors use information about the payoffs available to the trustee to form accurate expectations of reciprocity, and whether they use these expectations optimally when making decisions. In a complex situation such as a trust-based exchange, there is reason to doubt that trustors are fully rational. To solve a difficult strategic decision problem, trustors may take a simplified approach and neglect to take a full account of the trustee’s perspective. If so, trustors will make systematic errors of over- and under-trusting. We test this idea in two experiments.
Our guiding hypothesis is that the trustors’ own potential consequences are the primary determinants of their decisions. Consider how risk and expectations are represented in the trust game. An expectation-based approach assumes that trust is primarily based on temptation (T−R2)/T. As temptation increases, the expectation of reciprocity weakens. Yet, research shows that trustors’ decisions are primarily based on the trustor’s own outcomes (Malhotra, 2004; Snijders & Keren, 1999). In previous research, we manipulated risk and temptation independently and found that temptation affects trust only when risk is low (Evans & Krueger, 2011). We now develop the idea that the trustor’s focus on risk is a specific instance of the general tendency to selectively attend to self-relevant information. Across a variety of psychological tasks, people perceive the social world through the lens of self-interest. Some egocentric processes may be motivated by self-enhancement or self-protection (Alicke & Sedikides, 2010), but often they result from the salience and accessibility of self-knowledge (Jackson, Brunet, Meltzoff, & Decety, 2006; Krueger, 2003). What others know, desire, or intend, is difficult to infer (Malle, 2004).
We report two experiments to investigate the egocentric nature of trust decisions. Experiment 1 employs process-tracing methods to shed light on how trustors search for relevant information, revealing their priorities. We ask whether trustors attend to the other player’s incentives (i.e., temptation) and use this information when making trust decisions. Experiment 2 investigates the potential causes of egocentrism. Trustors may neglect temptation because they do not fully realize its relevance for the probability of reciprocity, or they understand its importance but fail to consider it at the moment of decision-making.
To study how people approach dilemmas of trust, we chose a method that reveals the process of online information search. In Experiment 1, we used the Mouselab software, which records information acquisition as it occurs (Payne, Bettman, & Johnson, 1993). With Mouselab, decision problems are presented so that the outcomes of potential choices are concealed in boxes. To discover an outcome, participants must drag the mouse over the box of interest and the software records a sequential log of search events.
Our key assumption is that trustors are mainly concerned with their own opportunities. They ask, “What’s in it for me?” It is harder, and perhaps of less immediate interest, to consider the perspective of the trustee (Alicke, Dunning, & Krueger, 2005; Alicke & Sedikides, 2010). In the context of information search, this means that trustors focus on their own potential gains and losses. Therefore, Hypothesis 1 is that trustors will focus their attention on self-relevant information. We tested this hypothesis by examining omissions, whether trustors access the payoffs associated with risk and temptation at least once before making a final decision.
Experiment 1 also investigated whether risk and temptation were weighted optimally in final decisions. We examine if focusing on risk (and ignoring temptation) results in suboptimal behavior. Temptation is only useful in decision-making insofar as it relates to the expected value of trust. This calculation is based on the multiplication of outcomes and probabilities. Temptation is relevant because of its effect on the probability of reciprocity (Malhotra, 2004; Snijders & Keren, 1999), but the egocentric approach assumes that trustors do not optimally use this information.
Previous studies have found that trustors have limited sensitivity to temptation (Evans & Krueger, 2011; Snijders & Keren, 1999), but these studies did not estimate the effect of temptation on expected value. Ignoring temptation is justifiable if it has little or no bearing on final earnings. Hypothesis 2 is that trustors underweight the importance of temptation relative to its effect on expected value. To test this account, we calculated how trustors responded to changes in expected value caused by increases in risk and temptation. Hypothesis 2 states that changes in expected value through risk will have a stronger effect on behavior than comparable changes through temptation.
Undergraduates were recruited from a subject pool maintained by the Department of Economics at Brown University. The sample comprised 61 men, 51 women, and two participants who did not report their gender. Students majoring in economics made up 27.2% of the sample. The remaining participants reported diverse academic interests, including the natural and physical sciences (38.5%), other social sciences (19.3%), and the humanities (17.5%).
The experiment was conducted in seven sessions, with 12 to 19 participants in each. Participants received a $10 show-up payment and additional earnings based on his or her choices (another $5–15). Individual sessions took less than one hour to complete. We collected data for both roles in the trust game, but this report focuses on the trustors (N = 57).
Participants completed 24 trials of the trust game. They were randomly partnered for each trial, and the consequences of other players’ decisions were revealed at the end of the experiment. Participants were given the role of Player 1 (trustor) or 2 (trustee) by random assignment, and they retained that role throughout the experiment. On each trial, Player 1 needed to make a choice between IN or OUT (trust or status quo), whereas Player 2 chose between SHARE or KEEP (reciprocity or betrayal). Trustees always made a decision regardless of whether Player 1 chose IN or OUT, but they understood that their decisions between SHARE and KEEP would be relevant only if trustors chose IN. Participants were paid based on the outcomes of all 24 decisions (100 points = $1.00).
We orthogonally manipulated two factors in the trust game’s structure, risk and temptation: Risk was the ratio of the trustor’s cost over benefit, (P1−S)/(R1−S), with initial levels of .25 (low) and .75 (high). Temptation was the trustee’s incentive to choose betrayal, (T−R2)/T, with three levels: .16 (low), .35 (medium), and .60 (high). These initial six conditions were selected based on previous studies of the trust game (Evans & Krueger, 2011). We further randomized these conditions to create 24 unique trials: Each of the six conditions was adjusted four times by randomly generated multipliers ranging from 0.5 to 1.5. Finally, the six individual payoffs within each of the trials were randomized by a jitter factor of up to ± 10%. At the end of this process, there were 24 trials (see Appendix for the baseline conditions and exact payoffs used in the experiment).
Four of the seven sessions were assigned to the Mouselab condition (Willemsen & Johnson, 2011), where the payoffs of the trust game were concealed inside boxes. To learn the value of an outcome, participants had to drag the mouse over a labeled box. Moving the mouse outside of a box closed it, but participants could revisit each box as often as they wished. Mouselab recorded the order and duration of each payoff viewing. Participants were not allowed to take notes or to record information about the payoffs.
In the remaining three sessions, all boxes were open and all payoffs were visible. The rules of the game, its visual structure, and the payoff values were identical to the ones in the Mouselab sessions. We expected no behavioral differences between the open- and closed-boxes conditions. Mouselab was only meant to measure, but not to alter thinking about the game.
The trust game was presented as an extended decision tree. We controlled for directional search biases (i.e., top to bottom or left to right) by randomly varying three presentational features: The horizontal alignment of the trustor’s choices (IN versus OUT); the horizontal alignment of the trustee’s choices (KEEP versus SHARE); and the vertical alignment of the players’ payoffs. Figure 2 is a screenshot of the trust game as it was presented to participants. The three potential outcomes were consistently labeled (OUT, KEEP, and SHARE) to reduce noise in information search.
Figure 2: Screenshot of the Mouselab condition. 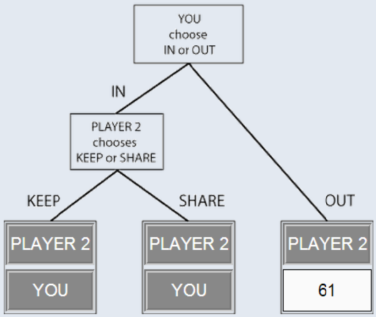
Participants read detailed instructions of the rules of the game, completed a quiz to ensure that they understood the rules, and responded to 24 trials of the game. Exact instruction materials are reported in the Appendix. After finishing the game, participants completed follow-up questions and a battery of psychological instruments that were not analyzed for this report. To prevent incidental priming effects, these instruments were always presented after the trust game.
A concern with Mouselab is that it alters the process of decision-making (Glöckner & Betsch, 2008). To see if this concern was warranted in our study, we compared the aggregate rates of trust and response times (total time elapsed during the 24 trials of the game) between the Mouselab and open-boxes conditions. Rates of trust were measured on a scale from 0 (never trusted) to 1 (always trusted). Reassuringly, the average rates did not vary across the Mouselab (M = .34, SE = .041, n = 33) and open-boxes (M = .31, SE = .043, n = 24) conditions, t(55) = .62, p = .54. Similarly, there was no significant difference in average response times between the Mouselab (M = 14.5 seconds per trial, SE = .94) and open-boxes conditions (M = 12.4, SE = 1.24), t(55) = 1.36, p = .18. There was no indication that the Mouselab interface affected trust or response times. When analyses did not involve variables generated by Mouselab, we used the combined data from both conditions (N = 57).
Mouselab recorded a sequential log of individual search events. These records were parsed for the time spent viewing each payoff and the order in which payoffs were accessed). Following convention, search events of duration < 100 milliseconds were discarded (Willemsen & Johnson, 2011).
Table 1: Information search omissions in Experiment 1. Standard errors reported in parentheses; Paired sample t-tests were conducted with 32 degrees of freedom; * indicates p < .05, ** indicates p < .01.
Self Other t-test r2 Status quo .10 (.045) .28 (.053) 5.11** 0.45 Reciprocity .15 (.048) .24 (.055) 2.25* 0.14 Betrayal .11 (.046) .23 (.055) 3.76** 0.32
Hypothesis 1 states that trustors focus primarily on self-relevant information. To investigate information search, we measured how often trustors fully neglected payoffs (omissions). Table 1 reports the average rates of omissions for self- and other-relevant payoffs, revealing that trustors often responded without viewing one or more of the trustee’s outcomes. This pattern was consistent for each of the three potential outcomes, but was especially strong for the status quo. The trustee’s status quo payoff (P2) was the most commonly neglected piece of information, while the self-relevant status quo payoff (P1) received the most attention. The relative neglect of P2 suggests trustors were not primarily motivated to maximize the equality or efficiency of outcomes.
We also measured the rates at which trustors failed to search for information related to temptation and risk, counting the rates at which trustors neglected at least one relevant payoff for each factor: P1, R1, or S for risk; R2 or T for temptation. The greater number of payoffs associated with risk increases the likelihood of an omission occurring, making this is a conservative test of egocentrism. Still, the rate of temptation omissions (M = .31, SE = .033) was significantly larger than the rate of risk omissions (M = .15, SE = .048), t(32) = 2.4, p = .02, r2 = .15. Information search data strongly supported the idea that trustors approached decision-making from an egocentric point of view. The tendency to ignore information was particularly striking because there were good reasons to expect few omissions: decisions were incentivized, the payoffs varied significantly across trials, and information search required little effort.
Hypothesis 2 states that trustors underweight the importance of temptation relative to its effect on the expected value of trust. We report three sets of analyses to examine this possibility: First, we tested the basic effects of risk and temptation on the rates of trust and reciprocity. Second, we calculated the effects of risk and temptation on the expected value of trust. Finally, we weighted risk and temptation relative to their effects on expected value, allowing us to directly compare their effects on decisions.
Figure 3: The rates of trust and reciprocity in Experiment 1 are plotted with each data point representing one trial. 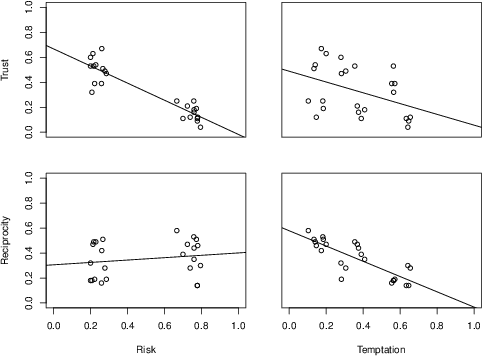
The zero-order effects of risk and temptation on trust and reciprocity decisions were estimated with correlations, using each trial as an observation, df’s = 22 (see Figure 3 for scatterplots). Trust was less likely to occur at high levels of risk, r = –.91, p < .001, and was also less likely to occur at high levels of temptation, r = –.41, p = .044. The rate of reciprocity was closely tied to the level of temptation, r = –.81, p < .001, and weakly correlated with risk, r = .18, p = .41.
At a correlational level, the effect of temptation on trust was less pronounced than the effect of risk. However, the preceding correlations did not account for the fact that risk and temptation may have different effects on the expected value of trust. The weaker correlation between temptation and trust may reflect the fact that temptation had less objective relevance for the expected value of trust decisions, which depends on both outcomes and probabilities. Hence, the next step was to test the effects of risk and temptation on the expected value of trust.
Expected value was based on the weighted average of the potential outcomes of trust, R1 and S, using the observed probabilities of reciprocity and betrayal, p and 1−p, as weights. We calculated the difference between this weighted average and the value of the status quo, P1. To account for the variability in stakes across trials, this difference was divided by the value of the status quo payoff, P1, so that the expected value for each trial was given by [R1 · p + S · (1−p) − P1]/P1, where p is the observed probability of reciprocity.
According to this definition, an expected value of 0 indicates that choosing trust, on average, generates the same payoff as the status quo, P1; an expected value of .5 indicates that choosing trust generates a payoff equal to 1.5 times the status quo; and an expected value of –.5 indicates that trust yields a payoff half the size of the status quo. The average expected value was slightly negative (M = –.14, SE = .055), but was positive for 6 out of 24 trials.
The expected value of trust changes with the level of risk, increasing with R1 and decreasing with S and P1. It also changes with temptation, through temptation’s effect on p, the probability of reciprocity. However, the effects of risk and temptation may not be equal in magnitude. Simple linear regressions measured the actual effects of risk and temptation. The expected value of trust significantly decreased at higher levels of risk, unstandardized b = –.89, SE = .11, p < .001, and also decreased at higher levels of temptation, b = –.78, SE = .25, p = .005. One-unit increases in risk and temptation corresponded to .89 and .78 unit decreases in the expected value of trust, respectively. We used these coefficients to calculate scaled measures of risk and temptation: EV-risk = .89 * risk; EV-temptation = .78 * temptation.
The scaled variables, EV-risk and EV-temptation, describe risk and temptation in terms of their effects on expected value. Equivalent changes in expected value require a larger change in temptation, compared to the comparable change in risk. This difference is due to the fact that temptation had a weaker effect on expected value than risk. Note that a one-unit increase in EV-risk requires a 1.12 unit increase in risk. In contrast, an equivalent change in EV-temptations requires a larger (1.28 unit) increase in temptation.
To test Hypothesis 2, we compared the effects of EV-risk and EV-temptation on trust. Unlike the previous correlational analyses, the effects of EV-risk and EV-temptation are now comparable as decision weights. An optimal decision-maker should be equally sensitive to changes in EV-risk and EV-temptation, given that the new variables describe risk and temptation using the same scale (e.g., units of expected value). However, if the effect of EV-risk is greater than that of EV-temptation, this indicates that trust decisions are more sensitive to changes in risk than comparable changes in temptation.
Table 2: Generalized Estimating Equations were used to calculate the effects of EV-risk and EV-temptation on trust. Clustered bootstrapping was then used to compare the difference in the effects of EV-risk and EV-temptation.
Experiment 1 Experiment 2 Intercept EV-risk EV-temptation |bEV-risk| − |bEV-temptation|
Logistic Generalized Estimating Equations were calculated using Stata 13. Trust decisions were coded such that 0 = status quo; 1 = trust. Each of 57 participants provided 24 observations (total N = 1368). To account for the clustered nature of the data, an exchangeable working correlation matrix was estimated. EV-risk and EV-temptation were tested as predictors. Table 2 displays the results. Risk and temptation both had significant negative effects on trust. We also tested models to identify main and interactive effects of the Mouselab condition, but found no significant differences.
Hypothesis 2 states that EV-risk has a larger effect on trust than EV-temptation, or in other words, |bEV-risk| − |bEV-temptation| > 0. We used clustered bootstrapping to estimate the magnitude of this difference (Cheng, Yu, & Huang, 2013). To account for the multilevel nature of the data, resampling with replacement occurred at the level of participants, but not at the level of individual decisions. Five thousand iterations of the logistic model were estimated. The average difference between |bEV-risk| and |bEV-temptation| was 1.42 (SE = .59). The 95% confidence interval of this estimate did not include zero (Table 2), indicating a significance difference in the scaled effects of risk and temptation, providing support for Hypothesis 2. Trustors were more sensitive to changes in risk than temptation.
We conducted Experiment 2 to replicate our analyses comparing the effects of risk and temptation on trust, and to better understand the root cause of trustors’ neglect of temptation. The idea that decisions to trust are largely egocentric implies that trustors do not use the probability of reciprocity to its full extent. An alternative explanation is that trustors care about the probability of reciprocity, but do not recognize the importance of temptation. Instead, they may infer the probability from generalized expectations (Rotter, 1967) or other sources of information, such as group identity (Foddy, Platow, & Yamagishi, 2009) or social norms (Bicchieri, Xiao, & Muldoon, 2011; Dunning, Fetchenhauer, & Schlösser, 2012). According to this view, trustors are misguided, but not necessarily egocentric.
To test this account, Experiment 2 directly measured expectations of reciprocity. The relatively weak relationship between trust and temptation in Experiment 1 could be explained by a disregard for probabilities or ignorance of the link between temptation and reciprocity. We introduce two additional hypotheses: Hypothesis 3 states that trustors understand the relationship between temptation and reciprocity; Hypothesis 4 states that trustors underweight their expectations of reciprocity when making decisions.
Experiment 2 was conducted with Amazon’s Mechanical Turk (MTurk; Horton, Rand, & Zeckhauser, 2011). To simplify the game for online participation, we did not employ the Mouselab software. Yet, we attempted to replicate key results of Experiment 1, such as the effects of risk and temptation on trust and reciprocity.
American participants were recruited from MTurk, N = 155. The average age was 31.4 (SE = .84), 42% were women, and 97% reported that English was their first language. Each participant received 40 cents for completing the experiment and a bonus payment based on one of their decisions. Participants were randomly assigned to the role of trustor (n = 74) or trustee (n = 81).
The experiment consisted of two sections, a replication of the trust game and a task measuring expectations of reciprocity. The materials for the trust game from Experiment 1 were adapted for online use (see Appendix). The instructions were shortened to retain attention and comprehension questions were not included. We used the same set of trials as the previous study (Table 1), but paid participants based on only one randomly selected decision. Typical bonuses ranged from 20–50 cents; the payments were made one week after the experiment was concluded. There was no deception.
To avoid priming perspective-taking, we measured expectations of reciprocity after the trust game. In this part of the experiment, we asked participants to predict the percentage of trustees who would choose to reciprocate trust in each of the 24 trials. They made predictions using slider bars that were scaled from 0 to 100. To motivate accurate predictions, we awarded $1.00 bonuses to the most accurate 10% of participants. These bonuses were delivered one week later, along with the bonus payments for trust game decisions.
Compared with the students recruited in Experiment 1, MTurk workers were more likely to trust (M = .51, SE = .030) and reciprocate (M = .50, SE = .032). Although there were differences in the overall levels of behavior, the effects of risk and temptation were similar, df’s = 22. Trust was highly correlated with risk, r = –.91, p < .001, and weakly correlated with temptation, r = –.38, p = .066. The rate of reciprocity was strongly correlated with temptation, r = –.90, p < .001, and weakly correlated with risk, r = .13, p = .54.
Hypothesis 2 states that trustors underweight the importance of temptation relative to its effect on the expected value of trust. In Experiment 1, we found that trustors were more sensitive to changes in risk than temptation. To test the robustness of this finding, we replicated our analyses comparing the effects of risk and temptation on trust. Following the procedure outlined in Experiment 1, we calculated the effects of risk and temptation on the expected value of trust. Then, we scaled risk and temptation to directly compare their relative effects on trust decisions.
Using the formula in Experiment 1, we calculated the expected value for each trial. The overall expected value of trust was slightly positive, M = .016, SE = .061, and was positive for 14 out of 24 trials. We used simple linear regressions to estimate the effects of risk and temptation on expected value. As in Experiment 1, the expected value of trust decreased significantly at higher levels of risk, b = –.89, SE = .15, p < .001, and at higher levels of temptation, b = –1.05, SE = .24, p < .001. These estimates were then used to calculate scaled measures of risk and temptation, EV-risk = .89 * risk; EV-temptation = 1.05 * temptation.
Following the procedure outlined in Experiment 1, we used logistic GEE to compare the scaled effects of risk and temptation on trust. Seventy six participants provided 24 observations each (total N = 1776). The model summary is reported in Table 2. As in the previous experiment, trustors were significantly influenced by both risk and temptation. Clustered bootstrapping was then used to estimate a confidence interval of the difference between the scaled effects of risk and temptation, |bEV-risk| − |bEV-temptation|. The average difference was 1.46 (SE = .49). Because the confidence interval of the estimated difference did not include zero, we conclude that trustors were again significantly more sensitive to changes in risk than comparable changes in temptation.
To better understand the weak relationship between temptation and trust, we directly analyzed expectations of reciprocity. The relative neglect of temptation could have occurred because trustors did not understand the strong effect of temptation on reciprocity, or they may have understood this relationship, but underemphasized it when making a decision.
Participants provided expectations of reciprocity as frequencies (0 to 100), but prior to analyses, expectations were scaled as proportions (0 to 1). First, we calculated each participant’s average expectation of reciprocity. Overall, trustors expected that the probability of reciprocity was .46 (SE = .020), slightly underestimating the observed rate of reciprocity, .51, t(73) = 2.37, p = .02. This replicates the previous finding that trustors are overly cynical about the likelihood of reciprocity (Fetchenhauer & Dunning, 2009).
We also examined how trustors used risk and temptation to form expectations of reciprocity. Hypothesis 3 states that trustors use temptation to form expectations of reciprocity. To test this hypothesis, we compared the effect of temptation on expectations with the actual effect of temptation on the probability of reciprocity.
A linear GEE was used to calculate the effects of risk and temptation on trustors’ expectations. Trustors expected less reciprocity at higher levels of temptation, b = –.52, SE = .024, p < .001, whereas the level of risk had no significant effect, b = .030, SE = .017, p = .083. Holding the level of risk constant, a one-unit increase in temptation was associated with a .52 unit decrease in the expected probability of reciprocity.
Temptation was indeed an important consideration in trustors’ expectations of reciprocity, but the previous analysis did not reveal whether trustors under or overestimated the effect of temptation. To provide a benchmark for accuracy, we estimated a simple linear regression of the effect of temptation on the actual probability of reciprocity, using each trial of the game as an observation, df = 22. Across trials, increasing temptation significantly decreased the probability of reciprocity, b = –.88, SE = .090, p < .001.
Figure 4: The effects of temptation on reciprocity and expectations in Experiment 2. 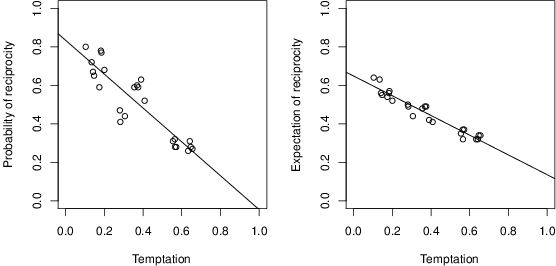
Clustered bootstrapping was then used to compare the effect of temptation on expectations (b = –.52) with the actual effect of temptation on the probability of reciprocity (b = –.88). We estimated 5,000 iterations of the aforementioned GEE model testing the effects of risk and temptation on expectations. The average difference was .35 (SE = .067), with a 95% confidence interval of .23 to .49. Given that the confidence interval does not include zero, we conclude that trustors did not fully account for temptation in forming expectations of reciprocity. This result could account, in part, for the relatively weak effect of temptation on trust decisions. Figure 4 illustrates the effects of temptation on the rates of reciprocity and trustors’ average expectations. Trustors understood the relevance of temptation, but underestimated its strength as a predictor of reciprocity.
Trustors understood, but underestimated, the relationship between temptation and the probability of reciprocity. This raises the question of whether they optimally used expectations when making decisions. Hypothesis 4 states that trustors underweight expectations in their decisions relative to their effects on expected value. Our approach to test the effect of expectations on trust was similar to the previous analyses of risk and temptation. We scaled trustors’ expectations of reciprocity relative to their effects on expected value and then compared the scaled effect of expectations and risk. Note that the expected values of trust differ for each participant, since each participant generated distinct estimates for the probabilities of reciprocity.
We calculated the subjective expected value of trust for each participant, using each participant’s expectations of reciprocity (instead of the observed probabilities of reciprocity). Then we used separate GEE models to estimate the simple linear effects of risk and expectations on subjective expected value. We found that subjective expected value increased significantly with higher expectations of reciprocity, b = .99, p < .001, and decreased at higher levels of risk, b = –1.01, SE = .020, p < .001. These values were then used to calculate the relative effects of expectations and risk, SEV-expectations and SEV-risk. In this case, the scaling procedure had minimal effects on the measures of risk and expectations.
Our final step was to compare the effects of SEV-expectations and SEV-risk on trust decisions. A logistic GEE was estimated with trust as the dependent variable and SEV-expectations and SEV-risk entered as predictors. Trust decreased at higher levels of SEV-risk, b = –2.09, SE = .17, p < .001, and increased positively with SEV-expectations, b = .86, SE = .20, p < .001. Clustered bootstrapping was used to compare the effects of risk and expectations, testing the hypothesis that |bEV-risk| − |bEV-temptation| > 0. Five thousand iterations of the GEE were estimated. The average difference in the effects of risk and expectations was 1.23 (SE = .44), with a 95% confidence interval ranging from .37 to 2.09. The confidence interval does not include zero, indicating that trustors were more sensitive to changes in risk than comparable changes in expectations.
Dilemmas of trust involve personal risk and expectations of reciprocity. The prevalent view is that expectations, rather than risk, are the trustor’s most important consideration. Process tracing methods, which revealed how trustors searched for information before reaching a decision, supported the opposite conclusion (Experiment 1). Trustors often ignored payoffs related to the trustee’s temptation. Behaviorally, trustors were also more sensitive to changes in risk than comparable changes in temptation. Experiment 2, which directly measured expectations of reciprocity, further investigated the weak relationship between temptation and trust. Trustors understood, but underestimated, the relationship between temptation and the probability of reciprocity. However, they did not fully utilize expectations in their decisions. Trust decisions were more sensitive to changes in risk than expectations, even after accounting for their differing effects on the subjective expected value of trust.
Relatively few studies have investigated the structural aspects of the trust game (Evans & Krueger, 2011; Malhotra, 2004; Snijders & Keren, 1999), yet the present results suggest that changes in risk and temptation have important consequences for the trustor’s decision-making. Consider, for example, the question of whether people trust too much or too little: Fetchenhauer and Dunning (2009) found that trustors, given their stated expectations of reciprocity, were overly trusting. However, the conclusion suggested by the present results is that decision-makers, giving insufficient weight to their expectations, are over-trusting when the probability of reciprocity is low and under-trusting when the probability of reciprocity is high. This pattern amounts to a regression effect (Fiedler & Krueger, 2012). Prescriptions for optimal trust decisions need to account for the levels of risk and temptation.
Risk and temptation also provide insights into how trustors form expectations of reciprocity. Consistent with Fetchenhauer and Dunning (2009), we found that trustors tended to underestimate the overall probability of reciprocity. However, expectations were also influenced by the level of temptation. Trustors correctly understood that increases in the other player’s incentives to betray trust would lead to a decrease in the likelihood of reciprocity. However, the estimated influence of temptation was weaker than its actual effect on reciprocity.
The present results are also relevant to the concept of betrayal-aversion, the finding that decision-makers are more sensitive to negative outcomes in interpersonal, as opposed to individual, contexts (Bohnet, Greig, Herrmann, & Zeckhauser, 2008). Trustors’ tendency to underweight expectations suggests that betrayal aversion is related to the cost of betrayal, rather than the probability of it occurring. Indeed, trustors are more sensitive to changes in the losses associated with betrayal, P1 − S, than gains from reciprocity, R1—P1, (Evans & Krueger, 2011). Note, however, that the present studies did not differentiate between these two components of risk.
The evidence of egocentric trust decisions was consistent in the laboratory (Experiment 1) and MTurk (Experiment 2) samples. Interestingly, MTurk workers were more likely to trust and reciprocate than laboratory participants. These behavioral differences may be related to demographic differences and changes in how the trust game was administered. For example, online participants were paid for only 1 out of 24 decisions and these bonuses were delayed one week. Although we cannot speak to the exact source of these differences, we find it reassuring that the effects of risk and temptation were similar in low- and high-trust environments.
A limitation of the present studies is that we focused on one (highly valid) cue to the probability of reciprocity, temptation. Arguably, trustors are more inclined to rely on alternative cues to reciprocity, such as group identity (Foddy et al., 2009) or the trustee’s physical appearance (Todorov, Pakrashi, & Oosterhof, 2009) and past behavior (Resnick & Zeckhauser, 2002). An important goal for future research is to understand how trustors utilize different forms of social information, and to examine how these cues interact with the structural aspects of the situation. A trustworthy countenance might not only increase trust (Bonnefon, Hopfensitz, & De Neys, 2013), but also increase sensitivity to temptation.
The present research suggests that unfavorable outcomes are the primary barrier to establishing trust among strangers. Although social psychological models emphasize the relative importance of expectations, trustors focused on their own outcomes during information search. Moreover, trustors did not fully account for their expectations of reciprocity in their ultimate decisions. Arguably, if an organization seeks to encourage trust among its members, the most direct approach would be to reduce the trustor’s risk, increasing the benefits of reciprocity and decreasing the cost of betrayal. This could be accomplished by framing the dilemma in a positive light or offering insurance in the case of betrayal.
Alicke, M. D., Dunning, D., & Krueger, J. I. (2005). The self in social judgment. New York, NY: Psychology Press.
Alicke, M. D., & Sedikides, C. (2010). Handbook of self-enhancement and self-protection. New York, NY: Guilford Press.
Bicchieri, C., Xiao, E., & Muldoon, R. (2011). Trustworthiness is a social norm, but trusting is not. Politics, Philosophy & Economics, 10, 170–187.
Binmore, K. (2007). Game theory: A very short introduction. Oxford University Press.
Bohnet, I., Greig, F., Herrmann, B., & Zeckhauser, R. (2008). Betrayal aversion: Evidence from Brazil, China, Oman, Switzerland, Turkey, and the United States. The American Economic Review, 98, 294–310.
Bonnefon, J. F., Hopfensitz, A., & De Neys, W. (2013). The modular nature of trustworthiness detection. Journal of Experimental Psychology: General, 142(1), 143–150. http://dx.doi.org/10.1037/a0028930.
Camerer, C. (2003). Behavioral game theory: Experiments in strategic interaction. Princeton, NJ: Princeton University Press.
Cheng, G., Yu, Z., & Huang, J. Z. (2013). The cluster bootstrap consistency in generalized estimating equations. Journal of Multivariate Analysis, 115, 33–47.
Chua, R. Y. J., Ingram, P., & Morris, M. W. (2008). From the head and the heart: Locating cognition-and affect-based trust in managers’ professional networks. Academy of Management Journal, 51(3), 436–452. http://dx.doi.org/10.5465/AMJ.2008.32625956.
Dasguta, P. (1988). Making and Breaking Cooperative Relations. Basil Blackwell, New York.
Dunning, D., Fetchenhauer, D., & Schlösser, T.M. (2012). Trust as a social and emotional act: Noneconomic considerations in trust behavior, Journal of Economic Psychology, 33, 686–694. http://dx.doi.org/10.1016/j.joep.2011.09.005.
Ekman, P., & O’Sullivan, M. (1991). Who can catch a liar? American psychologist, 46(9), 913–920. http://dx.doi.org/10.1037//0003-066X.46.9.913.
Evans, A. M., & Krueger, J. I. (2011). Elements of trust: Risk and perspective-taking. Journal of Experimental Social Psychology, 47, 171–177. http://dx.doi.org/10.1016/j.jesp.2010.08.007.
Fetchenhauer, D., & Dunning, D. (2009). Do people trust too much or too little? Journal of Economic Psychology, 30(3), 263–276. http://dx.doi.org/10.1016/j.joep.2008.04.006.
Foddy, M., Platow, M. J., & Yamagishi, T. (2009). Group-based trust in strangers: The role of stereotypes and expectations. Psychological Science, 20(4), 419–422. http://dx.doi.org/10.1111/j.1467-9280.2009.02312.x.
Fiedler, K., & Krueger, J. I. (2012). More than an artifact: Regression as a theoretical construct. In J. I. Krueger (Ed.). Social judgment and decision-making (pp. 171–189). New York, NY: Psychology Press.
Gintis, H. (2009). The bounds of reason: Game theory and the unification of the behavioral sciences. Princeton, NJ: Princeton University Press.
Glöckner, A., & Betsch, T. (2008). Multiple-reason decision making based on automatic processing. Journal of Experimental Psychology: Learning, Memory, and Cognition, 34, 1055–1075. http://dx.doi.org/10.1037/0278-7393.34.5.1055.
Hoffman, D. L., Novak, T. P., & Peralta, M. (1999). Building consumer trust online. Communications of the ACM, 42(4), 80–85.
Horton, J. J., Rand, D. G., & Zeckhauser, R. J. (2011). The online laboratory: Conducting experiments in a real labor market. Experimental Economics, 14(3), 399–425. http://dx.doi.org/10.1007/s10683-011-9273-9.
Jackson, P. L., Brunet, E., Meltzoff, A. N., & Decety, J. (2006). Empathy examined through the neural mechanisms involved in imagining how I feel versus how you feel pain. Neuropsychologia, 44, 752–761. http://dx.doi.org/10.1016/j.neuropsychologia.2005.07.015.
Johnson, N. D., & Mislin, A. A. (2011). Trust games: A meta-analysis. Journal of Economic Psychology, 32, 865–889. http://dx.doi.org/10.1016/j.joep.2011.05.007.
Johnson-George, C., & Swap, W. C. (1982). Measurement of specific interpersonal trust: Construction and validation of a scale to assess trust in a specific other. Journal of Personality and Social Psychology, 43(6), 1306. http://dx.doi.org/10.1037//0022-3514.43.6.1306.
Krueger, J. (2003). Return of the ego—Self-referent information as a filter for social prediction: Comment on Karniol (2003). Psychological Review, 110, 585–590. http://dx.doi.org/10.1037/0033-295X.110.3.585.
Lin, S., Keysar, B., & Epley, N. (2010). Reflexively mindblind: Using theory of mind to interpret behavior requires effortful attention. Journal of Experimental Social Psychology, 46, 551–556. http://dx.doi.org/10.1016/j.jesp.2009.12.019.
Malhotra, D. (2004). Trust and reciprocity decisions: The differing perspectives of trustors and trusted parties. Organizational Behavior and Human Decision Processes, 94(2), 61–73. http://dx.doi.org/10.1016/j.obhdp.2004.03.001.
Malle, B. F. (2004). How the mind explains behavior: Folk explanations, meaning, and social interaction. Cambridge, MA: MIT Press.
Mayer, R. C., Davis, J. H., & Schoorman, F. D. (1995). An integrative model of organizational trust. The Academy of Management Review, 20, 709–734. http://dx.doi.org/10.2307/258792.
Murninghan, J. K. (2012). Do nothing!: How to stop overmanaging and become a great leader. Penguin.
Olekalns, M., & Smith, P. L. (2005). Moments in time: Metacognition, trust, and outcomes in dyadic negotiations. Personality and Social Psychology Bulletin, 31(12), 1696–1707. http://dx.doi.org/10.1177/0146167205278306.
Payne, J. W., Bettman, J. R., & Johnson, E. J. (1993). The Adaptive Decision Maker. New York, NJ: Cambridge University Press.
Resnick, P., & Zeckhauser, R. (2002). Trust among strangers in Internet transactions: Empirical analysis of eBay’s reputation system. Advances in Applied Microeconomics, 11, 127–157. http://dx.doi.org/10.1016/S0278-0984(02)11030-3.
Rotter, J. B. (1967). A new scale for the measurement of interpersonal trust. Journal of Personality, 35, 651–665.
Rousseau, D. M., Sitkin, S. B., Burt, R. S., & Camerer, C. (1998). Not so different after all: A cross-discipline view of trust. Academy of Management Review, 23, 393–404. http://dx.doi.org/10.5465/AMR.1998.926617.
Snijders, C., & Keren, G. (1999). Determinants of trust. In D. V. Budescu, I. Erev, & R. Zwick (Eds.), Games and Human Behavior (pp. 355–385). Mahwah, NJ: Lawrence Erlbaum.
Todorov, A., Pakrashi, M., & Oosterhof, N. N. (2009). Evaluating faces on trustworthiness after minimal time exposure. Social Cognition, 27(6), 813–833. http://dx.doi.org/10.1521/soco.2009.27.6.813.
Trötschel, R., Hüffmeier, J., Loschelder, D. D., Schwartz, K., & Gollwitzer, P. M. (2011). Perspective taking as a means to overcome motivational barriers in negotiations: When putting oneself into the opponent’s shoes helps to walk toward agreements. Journal of Personality and Social Psychology, 101, 771–790. http://dx.doi.org/10.1037/a0023801.
Willemsen, M.C. & Johnson, E.J. (2011). Visiting the decision factory : observing cognition with MouselabWEB and other information acquisition methods. In M Schulte-Mecklenbeck, A. Kühberger & R. Ranyard (Eds.), A handbook of process tracing methods for decision research: A critical review and user’s guide (pp. 19–42). New York: Psychology Press.
Yamagishi, T. (1986). The provision of a sanctioning system as a public good. Journal of Personality and social Psychology, 51(1), 110–116. http://dx.doi.org/10.1037//0022-3514.51.1.110.
Six baseline conditions were used to generate a set of 24 distinct trials (see Tables A1 and A2). In both experiments, 100 points = $1.00. In Experiment 1, every decision was incentivized. In Experiment 2, participants were paid based on one randomly selected decision.
The instructions to the trust game used in Experiment 1 were presented to participants over 9 pages. To begin, Pages 1 and 2 introduced the basic structure of the game. Pages 3-6 familiarized participants with the information search interface by asking them to retrieve values from the trust game. Page 7 presented participants with additional information about their earnings in the experiment. At Page 8, participants learned their role in the game, Player 1 or 2. Finally, Page 9 presented participants with a series of comprehension questions to verify that they understood the procedure.
“In the next part of this experiment, you will make several decisions in an interactive scenario. This scenario involves two individuals, Player 1 and Player 2. The players will receive points based on the outcomes of their decisions. In this scenario, each point is worth $0.01 (players will be paid at the end of the experiment). First, you will learn the rules of the scenario, and then you will learn if you were assigned to the role of Player 1 or Player 2.
In total, the scenario consists of 24 rounds, and each player will make 24 separate decisions.”
Table A1. Baseline conditions of the trust game.
Risk Temptation P1 P2 R1 R2 S T Low Low 40 20 70 70 30 80 Med 40 20 70 70 30 100 High 40 20 70 70 30 160 High Low 40 20 50 50 10 60 Med 40 20 50 50 10 80 High 40 20 50 50 10 140
Table A2. Rates of trust and reciprocity observed in Experiments 1 and 2. In Experiment 1, rates of trust and reciprocity are based on combined data from the Mouselab and Open-Boxes condition (57 trustors and 57 trustees).
Experiment 1 (Lab) Experiment 2 (MTurk) Risk Temp P1 P2 R1 R2 S T Trust Reciprocity Trust Reciprocity Low Low 48 25 81 84 36 97 0.51 0.51 0.69 0.72 59 29 107 100 46 125 0.63 0.47 0.59 0.68 44 23 78 76 32 92 0.67 0.42 0.72 0.59 36 18 63 61 28 71 0.54 0.49 0.7 0.67 Med 51 25 91 90 41 125 0.6 0.32 0.69 0.47 55 27 90 94 41 131 0.47 0.19 0.61 0.41 24 12 42 40 19 62 0.53 0.49 0.73 0.59 41 21 67 68 31 98 0.49 0.28 0.61 0.44 High 36 17 64 63 28 147 0.39 0.19 0.54 0.28 28 15 48 49 21 110 0.39 0.16 0.58 0.31 23 12 43 41 18 94 0.53 0.18 0.65 0.32 46 23 88 87 35 200 0.32 0.18 0.65 0.28 High Low 29 14 36 36 7 44 0.25 0.53 0.38 0.78 44 22 54 53 10 65 0.19 0.51 0.43 0.77 19 10 26 26 5 29 0.25 0.58 0.57 0.8 52 25 63 64 13 75 0.12 0.46 0.36 0.65 Med 25 12 31 30 6 48 0.16 0.44 0.39 0.59 28 13 36 36 7 57 0.21 0.47 0.42 0.6 25 12 31 29 6 49 0.18 0.35 0.41 0.52 28 15 37 36 7 59 0.11 0.39 0.38 0.63 High 23 12 29 30 6 87 0.12 0.28 0.42 0.27 42 21 50 48 11 134 0.04 0.3 0.32 0.31 28 14 34 35 7 99 0.09 0.14 0.3 0.28 37 19 45 44 9 120 0.11 0.14 0.28 0.26
[Italicized text was presented to participants in the Mouselab condition]
“Each round of the scenario occurs in two stages: In the first stage, Player 1 chooses IN or OUT. If Player 1 chooses OUT, the round ends. If Player 1 chooses IN, then Player 2 chooses KEEP or SHARE. The players earn different amounts of points based on the outcomes of their choices.”
[Participants were then presented with an example of the trust game]
“Note that in each round, Player 1 must choose IN or OUT without knowing what choice Player 2 will make. Similarly, Player 2 must choose KEEP or SHARE without knowing if Player 1 chose IN or OUT. If Player 1 chooses OUT, it doesn’t matter what choice Player 2 makes. The potential outcomes of each round will be concealed inside of boxes. You will need to drag your mouse over these boxes to learn the values of the outcomes (KEEP, SHARE, or OUT). For example, in the figure below, if Player 1 chooses OUT, then Player 1 will receive 29 points and Player 2 will receive 14 points. If Player 1 chooses IN, then Player 2 will choose KEEP or SHARE. You may only view the value of one outcome at a time. However, you may view the outcomes as many times as you wish. On the following pages, you will be presented with four practice rounds. The purpose of these practice rounds is to familiarize you with the scenario. You will be asked to respond to several questions about each round. Please take your time; it is very important to our research that you fully understand the rules. Both the values of the outcomes and the locations of outcomes will change from round to round.”
On pages 3-6, participants were presented with four examples of the trust game and were asked to retrieve information about each game’s payoffs. The purpose of these pages was to familiarize participants with the Mouselab interface. Participants in the Open-Boxes condition completed the same task without having to actively search for information.
Sample question: “Below is an example of one round of this scenario. Please answer the following questions about the round before you continue.
If Player 1 chooses OUT…
How many points will Player 1 receive?
How many points will Player 2 receive?”
“Thank you for completing the practice rounds. Now we will review information about additional earnings in this scenario. Throughout this scenario, you will earn points based on the outcomes of your decisions (and the decisions of other players). However, you will not learn these outcomes until after the experiment is completed. This is to ensure that all decisions remain anonymous. Every participant in this experiment will be assigned to the role of Player 1 or Player 2. Every time Player 1 makes a decision, he or she will be randomly paired with a person assigned to the role of Player 2. Every time you make a decision, you will be paired with a randomly selected partner. You will be paired with other participants who are currently completing the experiment. No other participants in the experiment will learn about your identity. Similarly, you will not learn about the identities of any other participant. Every point you earn is worth one cent. Your earnings will be paid in cash when you have completed this experiment. Regardless of how many points you earn, every participant will also be paid $10 cash at the end of this session. All earnings in this scenario are in addition to the $10 cash payment. The number of points you earn will earn depends upon your decisions, and the decisions of other participants. We cannot guarantee any earnings.”
“You have randomly been assigned to the role of Player 1. You will make 24 separate decisions as Player 1, each time you will be asked to choose IN or OUT. You will be randomly paired with a different Player 2 each time you make a decision. The decisions of other players will always be made by other participants from this experiment. You will have to make your decisions without learning the responses of the other players. This means that you will not know whether each Player 2 chose KEEP or SHARE. Player 2 will make a choice between KEEP and SHARE for each round. However, Player 2’s decision will only be relevant when you choose IN. You will make 24 decisions as Player 1. Remember, the point values associated with each outcome (KEEP, SHARE, and OUT) may change in each round of the scenario. In addition, the locations of different outcomes may change from round to round.”
Concluding the instructions, participants were presented with a series of multiple choice questions about the experiment. Participants were not permitted to proceed until they correctly answered each question. When Page 9 was submitted, incorrect answers were highlighted and participants received a hint:
“Before you begin, please answer the following comprehension questions. You must answer each question correctly before you can continue.”
In this scenario, which role were you randomly assigned to? Player 1 / Player 2
What is the monetary value of 500 points?
$.50 / $1.00 / $5.00 / $10.00
True or false: the decisions of other players will always be made by other human participants?
True / False
Which of the following statements is true?
You will not learn the other players’ decisions until the end of the experiment. You will learn the other players’ decisions after each round.
You will learn the identities of the other players.”
To reduce potential fatigue effects, the game instructions for the MTurk study were reduced from nine to four pages. Participants learned about the basic structure of the game and were presented with an example, then learned their assigned role.
“In this part of the experiment, you will make several decisions in an interactive scenario. This scenario involves two individuals, Player 1 and Player 2. First, you will learn the rules of the scenario, and then you will learn if you were assigned to the role of Player 1 or Player 2.
Pay close attention. You will receive a bonus payment based on one of your decisions.”
“The scenario consists of 24 rounds in total, and each participant will make 24 separate decisions.
Each round of the scenario occurs in two stages: In the first stage, Player 1 chooses IN or OUT. If Player 1 chooses OUT, the round ends. If Player 1 chooses IN, then Player 2 chooses SHRAE or KEEP.
Note that in each round, Player 1 chooses IN or OUT without knowing what choice Player 2 will make. Similarly, Player 2 chooses SHARE or KEEP without knowing if Player 1 chose IN or OUT. If Player 1 chooses OUT, it doesn’t matter what choice Player 2 makes.
Below is an example of one round of the game.
[EXAMPLE OF GAME]”
“You will receive a bonus payment based on one of your decisions in this scenario. This payment is in addition to your 40 cent payment for completing the HIT.
One week after the experiment is completed, we will choose one round from this scenario and randomly assign partners. You will receive a bonus payment based on your decision and the decision of your partner.
Please make your decisions carefully.”
“You have randomly been assigned to the role of Player 1. You will make 24 separate decisions as Player 1, each time you will be asked to choose IN or OUT. You will be randomly paired with a different Player 2 each time you make a decision. The decisions of other players will always be made by other participants from this experiment.
You will have to make your decisions without learning the responses of the other players. This means that you will not know whether each Player 2 chose KEEP or SHARE. Player 2 will make a choice between KEEP and SHARE for each round. However, Player 2’s decision will only be relevant when you choose IN.
You will make 24 decisions as Player 1. Remember, the values associated with each outcome (SHARE, KEEP, and OUT) will change in each round of the scenario.
Remember, you will receive a bonus payment based on one of your decisions.”
Copyright: © 2013. The authors license this article under the terms of the Creative Commons Attribution 3.0 License.
This document was translated from LATEX by HEVEA.