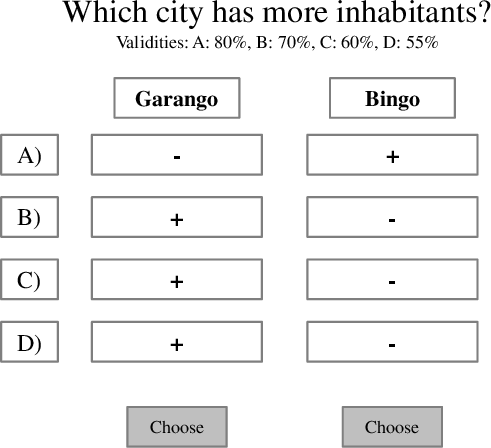
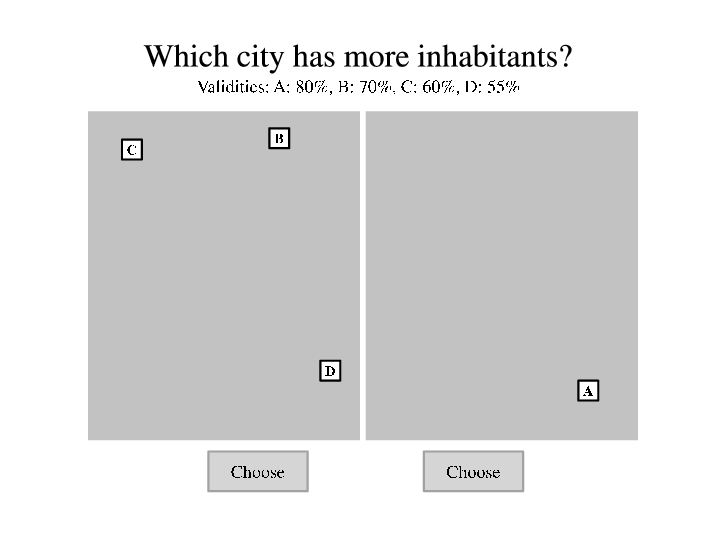
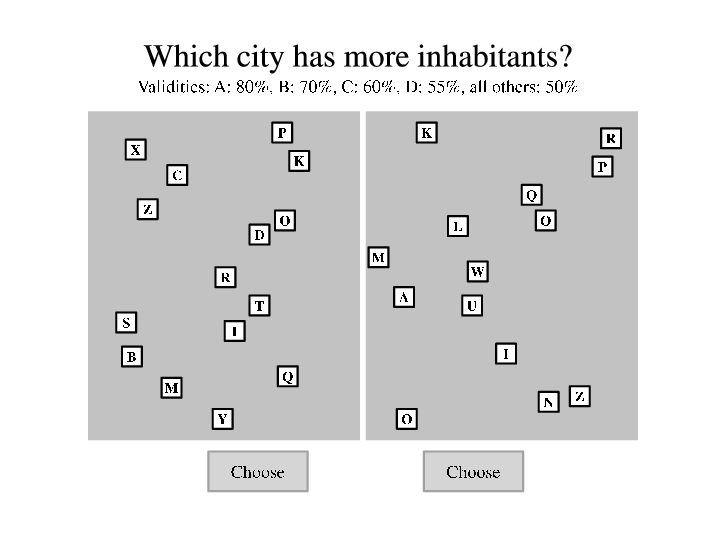
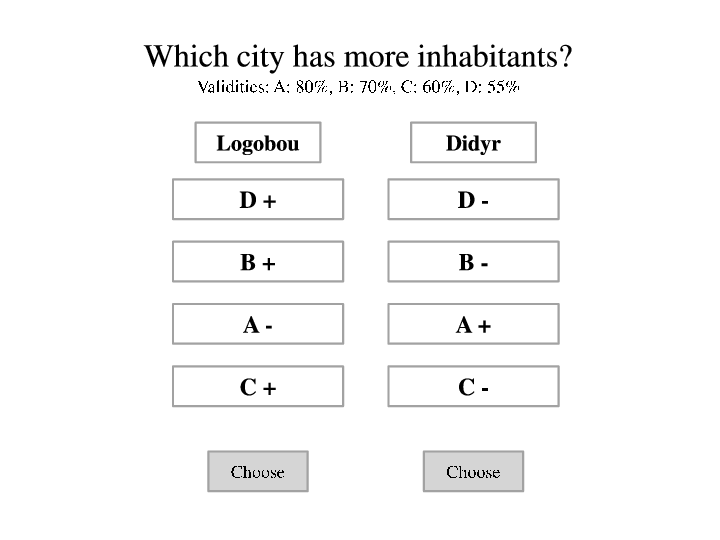
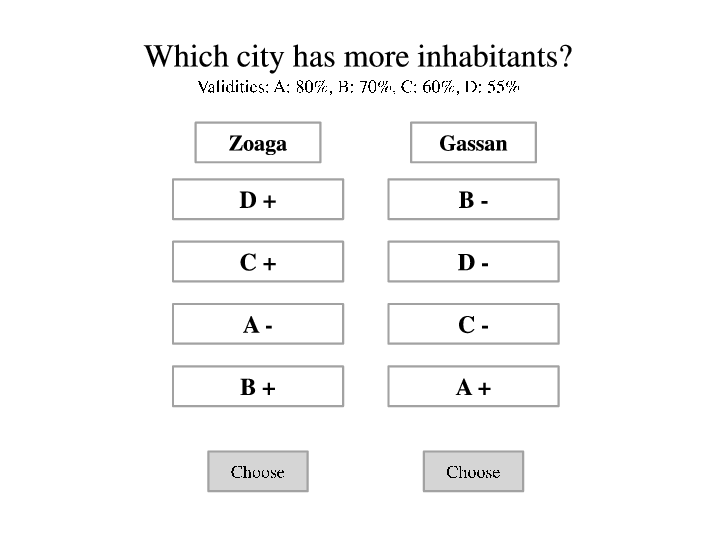
| Figure 1: Presentation formats Matrix (left), Map (center), and Complex Map (right) in Experiment 1. |
Judgment and Decision Making, Vol. 8, No. 3, May 2013, pp. 278-298
Deliberation versus automaticity in decision making: Which presentation format features facilitate automatic decision making?Anke Söllner* Arndt Bröder# Benjamin E. Hilbig# |
The idea of automatic decision making approximating normatively optimal decisions without necessitating much cognitive effort is intriguing. Whereas recent findings support the notion that such fast, automatic processes explain empirical data well, little is known about the conditions under which such processes are selected rather than more deliberate stepwise strategies. We investigate the role of the format of information presentation, focusing explicitly on the ease of information acquisition and its influence on information integration processes. In a probabilistic inference task, the standard matrix employed in prior research was contrasted with a newly created map presentation format and additional variations of both presentation formats. Across three experiments, a robust presentation format effect emerged: Automatic decision making was more prevalent in the matrix (with high information accessibility), whereas sequential decision strategies prevailed when the presentation format demanded more information acquisition effort. Further scrutiny of the effect showed that it is not driven by the presentation format as such, but rather by the extent of information search induced by a format. Thus, if information is accessible with minimal need for information search, information integration is likely to proceed in a perception-like, holistic manner. In turn, a moderate demand for information search decreases the likelihood of behavior consistent with the assumptions of automatic decision making.
Keywords: decision strategy, information search, parallel constraint satisfaction, strategy selection.
Making good decisions can be a challenge—it is often subjectively effortful, time-consuming, and appears to nudge us to the limits of our cognitive capacity. Typically, it is taken for granted that the normative standard of decision making—the weighing and adding of all available information—may be the most accurate way forward, but that it also bears the largest costs in terms of time and effort (Payne, Bettman, & Johnson, 1993). Therefore, some have deemed the actual application of such a complex strategy by default rather unlikely and argued for shortcut strategies (heuristics, Gigerenzer, Todd, & the ABC Research Group, 1999). However, the necessity of resorting to simplifying strategies hinges on the assumption of effortful, serial, and deliberate information processing—an assumption that may well be limited to certain circumstances. Under other conditions, one might expect largely automatic and thus mostly effortless information processing which, in turn, would allow for relying on complex strategies without imposing severe costs.
In the present work, we focus on the format of information presentation as one possible key determinant of more or less automatic—as opposed to effortful step-wise—decision making. As such, we intend to provide evidence for automatic decision making, thus broadening the focus of traditional research by considering automatic processes as a plausible further strategy in the well-established multiple strategy approach. More importantly, we aim to specify the strategy selection conditions of automatic decision making, that is, the presentation format features that elicit it. More generally, the current work investigates aspects of the task environment that facilitate automatic decision making. Thus, if real-world environments can be structured correspondingly, it might be possible to achieve a high prevalence of normatively optimal decisions without necessitating too much time and effort.
In this paper, we report three experiments that contrast the classic matrix with an alternative presentation format. While the first experiment concentrates on this comparison only, the second experiment examines two main features of the respective presentation formats for their influence on strategy selection. The final third experiment investigates one of these features—the extent of information search—more closely within the matrix presentation format.
In multi-attribute decision tasks, decision makers choose from a set of options, each of which is described by values of the same set of attributes. The decision is made with respect to a certain criterion that can either be a subjective one (like personal preference) or an objective criterion (like e.g., size of cities or turnover of enterprises). When the available attributes are predictive of a categorical criterion to some (imperfect) degree, the latter type of multi-attribute decision task is called a probabilistic inference task.
With regard to their content, probabilistic inference tasks can vary remarkably (Czerlinski, Gigerenzer, & Goldstein, 1999). In previous research, the City-Size task (Gigerenzer, Hoffrage & Kleinbölting, 1991) has frequently been employed (e.g., Bröder & Eichler, 2006; Gigerenzer & Goldstein, 1996; Glöckner & Bröder, 2011; Horstmann, Ahlgrimm, & Glöckner, 2009). Here, a decision maker typically is faced with the task to infer which of two cities (options) has more inhabitants (decision criterion). Given no prior knowledge about options, the decision maker is informed about the presence versus absence (value) of different cues (attributes). These cues could be whether a city has an international airport, an opera house, an international fair, or a zoo. Additionally, the decision maker is informed about (or learns) the validity of the different cues, that is, how well each can predict the criterion.
To explain how decision makers solve these probabilistic inference problems, different approaches have been proposed. One obvious way to address these tasks would be to deliberately perform a sequence of elementary information processes (EIPs) as proposed by Payne et al. (1993). Different combinations and sequences of these EIPs are called decision strategies. Though these different decision strategies differ in several aspects, they all share the basic assumption of decision making as a sequential, stepwise process.
Research on probabilistic inferences (e.g., Bröder & Schiffer, 2003b; Gigerenzer & Goldstein, 1996; Glöckner, 2009) has often focused on three prototypical EIP-based decision strategies: the “Weighted Additive Rule” (WADD), the “Equal Weight Rule” (EQW, Dawes, 1979), and the “Take-The-Best”-heuristic (TTB, Gigerenzer & Goldstein, 1996). While a decision maker using WADD considers and integrates all available information (cue values and validities) in a weighted-additive manner, an EQW user ignores the validities by weighing all cues equally. For both strategies, the absence of a cue can be compensated by the presence of others. This is not the case for TTB which considers the information cue by cue in decreasing order of validity. As soon as a cue discriminates between options, the decision maker stops the information search and chooses the option that is favored by the most valid discriminating cue—ignoring all other information.
Although the sequence and amount of EIPs differs considerably between the introduced strategies (WADD, EQW, and TTB), all three of them rest upon the notion of stepwise, sequential information processing. Though these processes are often interpreted as being deliberate (e.g., Gigerenzer & Todd, 1999), that is no necessary presumption (Gigerenzer, 2007; 2008).
The basic assumption of effortful, sequential decision making shared by EQW, TTB, and WADD is not part of all models that apply for multi-attribute decision tasks (for overviews see Evans, 2008; Gilovich, Griffin, & Kahneman, 2002; Glöckner & Witteman, 2010). The parallel constraint satisfaction (PCS) model for probabilistic inferences (Glöckner & Betsch, 2008a), which conceptualizes decision making as an automatic, parallel process, is one of these alternative models. Information integration in the PCS network model is not limited by the cognitive costs assumption made by the multiple strategy approach. Instead, Glöckner and Betsch (2008a, 2012) postulate that automatic processing in the PCS network requires only a minimum of cognitive resources for mimicking a fast weighted addition of all available information (Glöckner, 2010).
The basis of the PCS model is a network of cue- and option-nodes that are interlinked. Through an iterative, parallel process (spreading of activation) the network maximizes consistency under parallel consideration of all constraints. As soon as the network passes a certain consistency threshold, the iterative process terminates and the option with the highest positive activation level is chosen.
According to Glöckner and Betsch (2008a), decision makers create the aforementioned network spontaneously and automatically when confronted with a decision problem. In this network, all available and applicable pieces of information are incorporated. Here, the authors draw a parallel to the basic idea of Gestalt psychology (e.g., Köhler, 1947) that the mental system automatically strives to maximize consistency by forming mental representations (“Gestalten”) in a holistic process. Glöckner and colleagues (Glöckner & Betsch, 2012; Glöckner & Hodges, 2011) describe this process, that automatically captures the initial constellation of information, to be comparable to processes of perception.
Adopting the view of the multiple strategy approach that people are equipped with a repertoire of different decision strategies, the strategy selection problem arises: How does the decision maker determine which strategy to choose? Payne et al. (1993, see also Beach & Mitchell, 1978) argued that strategy selection can be viewed as a tradeoff between (cognitive) effort and accuracy. This approach has been criticized for several reasons, the main concerns being (1) the necessity of a meta-calculus deciding how to decide (Glöckner & Betsch, 2008a; Rieskamp & Otto, 2006) and (2) the assumption that high accuracy is inevitably associated with increased effort (Gigerenzer & Goldstein, 1999; Gigerenzer & Gaissmaier, 2011). Subsequently, some authors (e.g., Bröder & Schiffer, 2006a; Rieskamp & Otto, 2006) investigated the central role of learning in strategy selection, whereas other investigations concentrated on monitoring the influence of different task features on strategy selection (e.g., time pressure, Rieskamp & Hoffrage, 1999; working memory capacity, Bröder & Schiffer, 2003a; salience of cue information, Platzer & Bröder, 2012). Marewski and Schooler (2011) observed that the strategy selection problem is frequently resolved by the fact that sometimes only one specific strategy (or at most a small set of strategies) is applicable or afforded. In their cognitive niche framework Marewski and Schooler (2011) assume that strategy selection follows a cost-benefit-tradeoff only if more than one strategy can be applied. Hence, according to this framework, the task environment already constrains the set of applicable strategies, thus facilitating cost-benefit selection between the remaining ones.
Glöckner and Betsch (2008a) avoid the strategy selection problem by assuming only one uniform mechanism (namely, PCS) instead of a repertoire of different strategies (see also Lee & Cummins, 2004, for an alternative unifying model). However, we deem it sensible to treat the PCS model as if it belongs to the humane repertoire of decision strategies for several reasons: (1) Proponents of the PCS model repeatedly treated it themselves as if it was one of several applicable strategies by contrasting it with the different decision strategies instead of the multiple strategy approach as a whole (e.g., Glöckner & Betsch, 2008b; Glöckner & Hodges, 2011; Horstmann et al., 2009). (2) Some evidence from these investigations suggests that the PCS model cannot successfully account for decision making under certain constraints (i.e., inferences from memory, Glöckner and Hodges, 2011; forced sequential information search, Glöckner & Betsch, 2008b). (3) Despite PCS’s notion of parallel information integration, Bröder and Gaissmaier (2007) found evidence that people sometimes actually employ TTB in a serial manner—a finding, PCS cannot easily account for. Finally (4), even a unifying model can account for differences only by assuming different parameter values. How these are determined is a structurally similar problem to strategy selection in a multiple strategies framework.
In the course of monitoring, how different task features influence people’s strategy selection (within the multiple strategy approach), the presentation format has been addressed by several authors. Bröder and Schiffer (2003b; 2006b) found that in memory-based choices, their participants seemed to employ a compensatory decision strategy (i.e., EQW or WADD) in a pictorial presentation format more often than when verbal information was presented in a matrix-like format. Here, TTB seemed to be more frequently employed. In contrast to these results, Bergert and Nosofsky (2007) observed a frequent use of TTB when information was presented in a pictorial format, whereas Newell, Collins and Lee (2007) did not find any effect of whether information was presented verbally or pictorially. As only Bröder and Schiffer’s (2003b; 2006b) experiments induced considerable memory retrieval costs, Bröder and Newell (2008) conclude that the format of the stimulus material seems to have little effect as long as solving the decision problem does not burden working memory too much. Platzer and Bröder (2012) raised additional doubts concerning the importance of the format of information presentation on decision strategies: When controlling for salience in the pictorial condition, the format effect reported by Bröder and Schiffer (2003b; 2006b) disappeared. These findings suggest that not the presentation format per se, but the accessibility of information, as determined by the presentation format, influences which strategies decision makers employ.1
To our knowledge, it remains unclear whether the format of information presentation influences the application of PCS. In their investigations, proponents of the PCS network model have predominantly employed the matrix-like presentation format of the open information board (Glöckner & Betsch, 2008b; Glöckner & Bröder, 2011; Horstmann et al., 2009) which demands particularly little information search.2 Here, a remarkable dominance of PCS-consistent behavior has repeatedly been shown. In turn, one might question whether presenting information in an open, matrix-like format is actually a necessity for PCS. Indeed, this is plausible given that one crucial pre-condition for “automatic” decision making (in line with PCS) was mentioned by Glöckner and Betsch (2008b): Sequential information search seems to impede the reliance on PCS. The authors contrasted the open and the closed (cue values are initially hidden and have to be looked up by the participant) information board and found a considerable difference in decision strategy use between the two experimental procedures (see also Lohse & Johnson, 1996). Stated briefly, sequential information search as induced by the closed information board appeared to keep participants from PCS-consistent information integration.
Combining this finding with Marewski and Schooler’s (2011) cognitive niche framework, we hypothesize that PCS’s applicability might be limited by the accessibility of information. When information is highly accessible, different decision strategies as well as PCS-consistent information integration are applicable. From a cost-benefit-view, the dominance of PCS-consistent behavior shown in previous studies makes perfect sense, as PCS combines high accuracy with low cognitive effort. If high information accessibility is a pre-condition for PCS-consistent behavior, task environments featuring lower information accessibility might constitute situations where the PCS model simply is not contained in the set of applicable strategies, thus leading to information integration as proposed by the multiple strategy approach instead.
In the present investigation, the standard presentation format of the information board (matrix) is contrasted with an alternative presentation format. Employing the aforementioned City-Size task, this alternative presentation format should resemble the way that information about cities is often displayed to people. Thus, we decided to create a presentation format that conceptually follows the example of a common city map, where pictograms indicating the presence of certain facilities are distributed according to the geographic conditions of the respective city. In order to maximize the experimental control and minimize unintended noise (e.g., effects of salience as reported by Platzer & Bröder, 2012), the background of the map presentation format was uniform grey (instead of comprising actual buildings, streets, etc.) and the symbols representing cues present in the respective city were symbolized by letters (instead of the usual pictograms). Hence, our “map” representation is rather stylized for reasons of experimental control, but it maintains the need to search relevant cues, which is also a feature of actual maps.
Both presentation formats (matrix and map) are varied in several details across experiments in order to identify critical presentation format features that are responsible for differences in information integration processes. According to our working hypothesis, presentation formats that enable a quick and easy encoding of cue information should foster PCS-consistent processing.
In order to investigate which decision strategy is employed by a decision maker, the observed data pattern can be compared to the predictions of the different models. The participant is classified as in favor of the model that explains the observed data pattern best. If the models differ in their predictions regarding participants’ choices, the outcome-based strategy classification method (Bröder & Schiffer, 2003a; Bröder, 2010) offers one well-established and frequently employed possibility for model classification (e.g., Ayal & Hochmann, 2009; Bröder & Gaissmaier, 2007; Bröder, Newell, & Platzer, 2010; Glöckner & Betsch, 2008a). However, if two models predict exactly the same choice patterns—as WADD and PCS do for our experiments—the outcome-based classification method cannot distinguish between these models. Building on this method, Glöckner (2009; 2010; Jekel, Nicklisch & Glöckner, 2011) therefore introduced an approach that integrates choices, decision times, and confidence judgments in order to make specific predictions that are unique for each of the models. This Multiple Measure Maximum Likelihood (MM-ML) method allows to distinguish between the sequential decision strategies EQW, TTB, and WADD and the PCS model by computing a single maximum likelihood for each of the considered models (Appendix A). To control for parsimony, the Bayesian Information Criterion (BIC, Schwarz, 1978; Appendix B) is computed and used as indicator for the best fitting model.
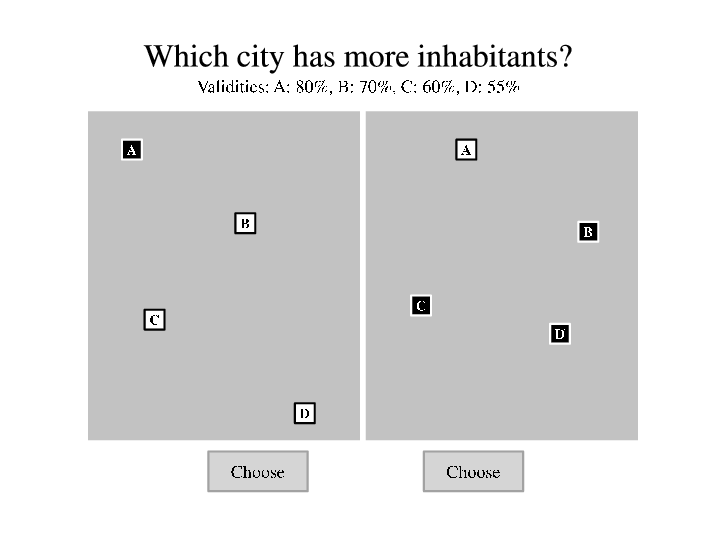
Figure 1: Presentation formats Matrix (left), Map (center), and Complex Map (right) in Experiment 1.
In the first experiment, the aforementioned presentation formats matrix and map are contrasted. In line with previous findings (Ahlgrimm, Glöckner, & Bröder, 2010, May; Glöckner & Betsch, 2008b; Glöckner & Bröder, 2011; Horstmann et al., 2009), we assume that behavior consistent with PCS’s predictions should be highly prevalent in the matrix presentation format.
In contrast, we hypothesize that PCS-consistent behavior will be less frequently observed in the map format. Because the pieces of information are not conveniently presented in the well-organized matrix format, the decision maker needs to restructure the given information before it can be integrated. This additional task may impair the decision maker’s ability to integrate the available pieces of information in a perception-like process as proposed by PCS and thus may lead to more frequent decision strategy use.
In a third condition, further irrelevant distractor features were included in the map presentation format, presumably leading to even more need for information search and restructuring. Previous research has shown that the need to (extensively) search for information influences the way people process information (for an overview see Gigerenzer, Dieckmann & Gaissmaier, 2012). Analogous to Glöckner and Betsch’s (2008b) reasoning concerning the closed information board, we assume that the need to intensively search for information further impedes the use of PCS and fosters the employment of decision strategies in this map with high information costs.
This experiment used three different presentation formats as experimental conditions. Each presentation format displayed the formally identical information and employed the same decision trials.
The Matrix presentation format entailed an open information board (Payne et al., 1988; 1993; Figure 1, left part). The city names3 headed the columns of the matrix and were randomly assigned to the different options. The four relevant cues were depicted on the left side of the computer screen. The letters A to D were employed as abstract cue labels in order to prevent participants from using any background knowledge. From top to bottom they were displayed in decreasing order of validity, with cue A on the top to cue D on the bottom. The presence of a cue for an option was indicated by a plus sign in the respective cell of the matrix, whereas a minus sign showed its absence.
The Map presentation format is shown in the middle part of Figure 1. A grey rectangle symbolized the area of each city and the presence of a cue was indicated by a letter that identified the respective cue, shown in a small white square. Thus, just as in the Matrix format, the cues in this presentation format were kept in an abstract form with the letter A indicating the most valid cue and the letter D specifying the least valid one. Following the example of a city map, the absence of a cue in a city was indicated by not-displaying it on the city area. The squares symbolizing the present cues were distributed randomly across the grey area.
For the Complex Map format, distractor cues were added to the map in order to increase information costs for the participants (Figure 1, right part). Ten to 14 of the letters I to Z were presented in random distribution across the city area. Participants were explicitly told that all these additional letters (except the letters A to D that symbolize the four relevant cues) indicated cues with the chance validity of .50 and thus yield no relevant information for their decision.
In each decision trial of the experiment, participants were presented with two fictitious cities described by four binary cues and asked to choose the option that probably has more inhabitants. After indicating the decision, participants provided a corresponding confidence judgment. In each trial, choice, decision time, and confidence judgment were recorded.
Each experimental condition comprised 70 decision trials presented in random order. In order to enable an optimal decision strategy classification with the MM-ML method, the six diagnostic pairs (cue value patterns) proposed by Glöckner (2009) were employed (Appendix C). Each pair was presented ten times—each option displayed five times on the left side and five times on the right side of the computer screen. In addition to these 60 decision trials relevant for the strategy classification, ten filler trials4 were included in each experimental condition.
As this experiment incorporated a pure within-subjects design, each participant completed all experimental conditions. The set-up of each experimental condition was held constant: After the initial instructions the participant worked on five practice trials which could be repeated optionally. Another short instruction followed before the 70 decision trials were presented. Between the three experimental conditions (presentation format blocks), breaks (at least 2.5 minutes) were included. The order of the three presentation format blocks was counter-balanced across the participants.
As the open information board displays all applicable pieces of information conveniently to the decision maker, information should be easy to access and information integration compatible with PCS’s predictions should be highly prevalent in the Matrix presentation format. This would be in line with previous studies (Ahlgrimm et al., 2010, May; Glöckner & Betsch, 2008b; Glöckner & Bröder, 2011; Horstmann et al., 2009). Since the Map presentation format requires restructuring the available information in order to make a decision, we assume that PCS-consistent behavior will be impaired and thus less prevalent in this alternative presentation format. Here, sequential decision strategies should be employed more frequently than in the Matrix presentation format. Further, we assume that this effect should also be true—and possibly more pronounced—for the comparison between Complex Map and Matrix —even if it cannot be found for the simple Map.
Eighty-three students of the University of Mannheim participated in the experiment (70 female, mean age 21.5). They received course credit for their participation.
For a model classification with the MM-ML method, predictions for the models under consideration and each of the six diagnostic pairs (cue value patterns: Appendix C) were derived for three dependent measures: Choices, decision times, and confidence judgments. The exact steps for deriving the model predictions are described by Glöckner (2010). Appendix D displays the predictions for all models, diagnostic pairs and dependent measures for Experiment 1 as they can also be found in Glöckner (2009).
In line with Bröder’s (2000) recommendation, we tested a corrected version of WADD that assumes that participants correct their decision weights for the fact that cues with a validity of .50 predict the decision criterion only with chance probability (w = v–.50, see Glöckner & Betsch, 2008b; Glöckner, 2009). Following Glöckner’s (2009; 2010) procedure, we also included a simple guessing strategy Random.
We conducted the model classification with the MM-ML method using the free software R and the code provided by Jekel et al. (2010). In order to control for occasional inattentiveness of participants, we replaced decision time outliers (more than 3 SD above the participant’s mean decision time) with the median decision time of the participant for the respective diagnostic pair. As suggested by Jekel et al. (2010), decision times were log-transformed. In order to control for learning effects, decision time residuals were used after partialing out the trial number. If the estimated choice error rate εk for the best-fitting model was ≥ .40 the respective participant was not classified and excluded from further analyses (Bröder & Schiffer, 2003b).5
Table 1 (upper part) shows the results of the MM-ML model classification for each presentation format. In line with our hypothesis, PCS-consistent behavior was frequently found in the Matrix (47 participants), but only rarely in the Map (18 participants) and in the Complex Map (17 participants). For the decision strategies (EQW, TTB, and WADD) the opposite pattern was observed: frequent use in the Map (65 participants) and the Complex Map (64 participants) presentation format, but low prevalence in the Matrix (36 participants).
Table 1: Model classification for Experiments 1 to 3.
Model classification Exp. Presentation format EQW TTB WADD PCS Random Unclassified* Total 1 Matrix 83 Map 83 Complex Map 83 2 Matrix 108 Map 108 Fixed Map 36 Negative Map 35 Negative Fixed Map 37 3 adjusted Matrix 40 Map 40 Random Row Matrix 40 Random Display Matrix 40 Note. EQW: “Equal Weight Rule”, TTB: “Take-The-Best”-heuristic, WADD: corrected “Weighted Additive Rule”, PCS: “Parallel Constraint Satisfaction”. * Choice error rate εk ≥ .40. ** One of these three unclassified participants was excluded, because this person indicated that he or she did not comprehend the confidence judgment instruction properly.
To test our format hypothesis, the presentation formats Matrix and Map were compared first. The McNemar test (McNemar, 1947) for dependent samples showed a significant effect in the predicted direction: χ ²(1, N = 83) = 19.56, p < .001. The conditional Odds ratio (OR) was 5.14 in the sample. When the presentation formats Matrix and Complex Map were compared, a significant effect in the predicted direction was observed: χ ²(1, N = 81) = 20.51, p < .001, OR = 5.83. No differences could be found between the presentation formats Map and Complex Map: χ ²(1, N = 81) = 0.05, p = .82. Thus, PCS-compatible behavior was much more prevalent in the Matrix presentation format than in the Map and the Complex Map, whereas the latter two presentation formats (Map and Complex Map) did not differ from each other.
However, we found differences between the simple Map and the Complex Map concerning the sequential strategies: Taking into account only participants who were classified as being either TTB- or WADD-users in both newly established presentation formats, the McNemar test showed a significant effect: χ ²(1, N = 53) = 7.14, p = .01, OR = 6.00. Thus, a strategy shift between these two decision strategies was found: When information costs are increased (Complex Map), the fast and frugal heuristic TTB is more prevalent whereas the more complex WADD strategy decreases in prevalence. This result confirms earlier findings on the influence of information costs (Bröder, 2000; Lee & Cummins, 2004) and indicates that information costs can effectively be manipulated via distracters that make information search time-consuming. High information search demands lead to a more frequent use of heuristics like TTB (Gigerenzer et al., 2012).
Our hypothesis is supported by these results: The PCS model could describe the behavior of the majority of participants in the Matrix (i.e., open information board) best. By contrast, behavior in the alternative Map and Complex Map presentation formats was typically best accounted for by decision strategies’ prediction of sequential information processing. Thus, the format in which the formally identical information is presented to participants profoundly influences how the information is processed and integrated. This effect is not limited to alternative formats that impose considerably high information costs (Complex Map).
Experiment 1 found a substantial difference in information processing between two different presentation format conditions. In the classic matrix-like presentation format of the open information board, behavior consistent with PCS’s predictions was much more prevalent than in an alternative presentation format that resembles a city map. As this constitutes a novel finding in regard to PCS, the first goal of Experiment 2 is to replicate this basic result.
However, even if the difference in information processing found in Experiment 1 can be replicated, the question remains, what feature of the presentation format facilitates (or hinders) PCS-consistent computation. The two presentation formats employed in Experiment 1 differ from each other in several aspects. Two important differences are (1) whether negative cue values are explicitly displayed or need to be inferred and (2) whether information search is necessary or reduced to a minimum. In the Matrix presentation format, positive and negative cue values are displayed and information search demands are low, whereas in the Map negative cue values have to be inferred and the information about the presence of the cues is randomly distributed (spatially), which increases information search effort.
Theoretically, both presentation format features could influence the ease with which a PCS network as postulated by Glöckner and Betsch (2008a) can be generated. According to our working hypothesis, the need to search and recode information due to reduced information accessibility may impair the spontaneous generation of the proposed PCS network. Therefore, the preferred “automatic” decision making might not be applicable here, and decision makers are left to employ one of the remaining decision strategies for information integration.
First, if negative cue values are not displayed, information is incomplete at the first glance and has to be recoded before it can be processed further. The decision maker has to infer from the absence of positive cue values that the cue value for the respective cue must be negative. We hypothesize that this additional step of recoding might hinder the spontaneous generation of the proposed PCS network and thus foster step-wise information integration as postulated by multiple strategy approach instead. Hence, behavior consistent with one of the decision strategies TTB, EQW, and WADD is more frequently observed when negative cue values are not displayed to the decision maker and have to be inferred.
Second, the increase in information search (that was induced in the Map format) might have hindered PCS-consistent behavior. Gigerenzer et al. (2012) highlighted the important role of information search as a vital determinant for decision making processes. Although Gigerenzer et al. (2012) focus on the shift from compensatory decision strategies to heuristics like TTB due to high information search demands, the basic principle can be adapted for our research focus: The way people process and integrate information depends on the extent of information search imposed by the environment. Building on Glöckner and Betsch’s (2008b) observation that forced sequential information search in the closed information board reduces PCS-consistent behavior, we suggest that not only this particular mode of information search induction, but increased information search costs per se might hinder the generation of the postulated PCS network. If therefore “automatic” decision making is not applicable anymore, decision strategies have to be employed more frequently.
Thus, in Experiment 2, both presentation format features are manipulated within the original Map presentation format of Experiment 1. We assume that displaying negative cue values and minimizing information search requirements facilitate the spontaneous generation of the mental network proposed by the PCS model. If “automatic” decision making is applicable, it will be observed frequently.
A side issue that will also be addressed in Experiment 2 concerns one finding of Experiment 1 that was not discussed so far. Especially in the Map presentation format, but also in the Matrix the lack of participants using EQW was surprising. Simply counting the number of squares (Map, Figure 1, middle part) or pluses (Matrix, Figure 1, left part) seems an obvious and easy-to-apply strategy that should be chosen by at least some participants. However, only 1.2% of the strategy classifications of Experiment 1 favored EQW as the most probable decision strategy. Experiment 2 will test the idea that EQW was employed so rarely in Experiment 1 because this strategy predicts guessing for four of the six diagnostic pairs. Thus, participants who strive to use efficient strategies might have abstained from using this strategy, simply because it rarely favored one option over the other in this specific environment.
In this experiment, the two presentation formats Matrix and Map from Experiment 1 (Figure 1, left and center) were presented to all participants. Additionally, we introduced three presentation formats as variations of the original Map presentation format. In these new conditions, two presentation format features were systematically manipulated: (1) whether negative cue values are displayed or not and (2) the extent of information search induced by the spatial distribution of cue values.
Figure 2: Presentation formats Negative Map (left), Negative Fixed Map (center), and Fixed Map (right) in Experiment 2. 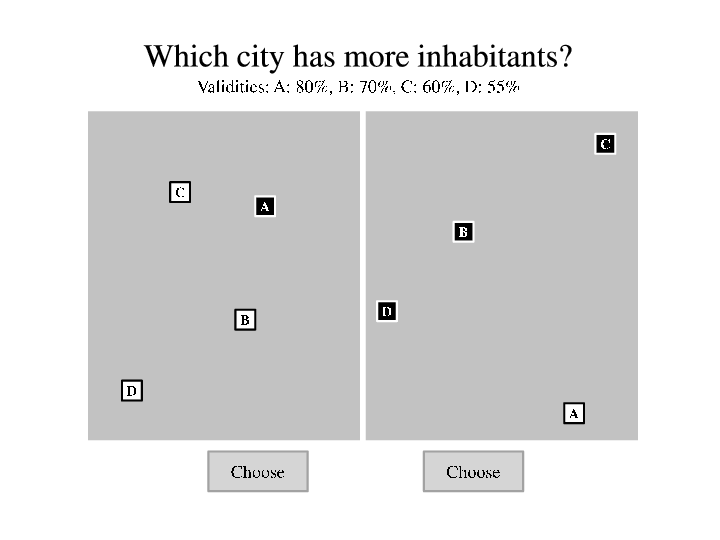
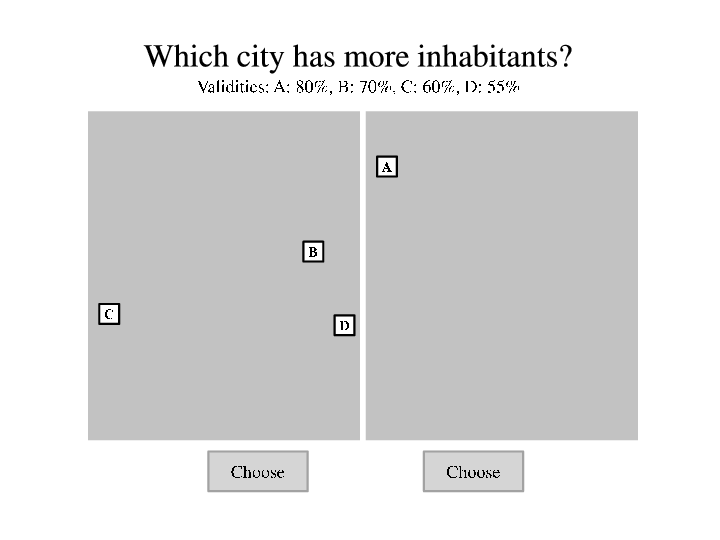
In the first new map6 (Negative Map, Figure 2, left part) negative cue values are displayed as white letters in black squares and positive cue values as black letters in white squares. The cue values are randomly distributed across the grey rectangles that symbolize the city area. Thus, this presentation format differs from the Map and resembles the Matrix insofar as it eliminates the need to actively infer negative values. Importantly, it still requires search of the cues.
The second new map (Negative Fixed Map, Figure 2, middle part) has negative and positive cue values displayed and in addition, information search is reduced, because each cue appears only in its own quarter of the rectangle symbolizing the city area: The most valid cue A in the upper left, cue B in the upper right, cue C in the lower left, and the least valid cue D in the lower right quarter. Correspondingly, the Negative Fixed Map differs from the Map and resembles the Matrix on both considered presentation format features: Negative cue values are displayed, and information search is reduced.
In the third new map (Fixed Map, Figure 2, right part) only positive cue values are displayed, whereas negative cue values have to be inferred from the absence of the respective cue on the city area. Information search is reduced, because each cue only appears in its respective quarter. Thus, the presentation format Fixed Map differs from the Map and resembles the Matrix in respect to the reduced information search.
The design of Experiment 2 closely resembled the one of Experiment 1. Each participant worked on three different presentation formats, interspersed with breaks of at least 2.5 minutes length. Two important changes were made in comparison to Experiment 1—one concerned the formats used (see above) and the other related to the diagnostic pairs. For each presentation format, seven diagnostic pairs were tested ten times—each one five times with one option on the left side of the screen and five times with this option on the right side. The diagnostic pairs were chosen in respect to two goals: The diagnostic pairs should be able to differentiate between the considered models, and EQW should predict guessing in only few cases. Therefore, four new diagnostic pairs plus the diagnostic pairs 1, 3, and 6 from Experiment 1 were selected (Appendix E). For these seven diagnostic pairs EQW predicts guessing only in one case (see Appendix F for the complete model predictions).
In terms of experimental design, we manipulated the presentation format within and between participants: Each participant completed the original presentation formats Matrix and Map from Experiment 1 (Figure 1, left and center). The third presentation format for the participants was one of the three new maps (Fixed Map, Negative Map, and Fixed Negative Map)—each one completed by about one third of the total sample.
Hypothesis 1: Replicating the findings of Experiment 1, we predict that PCS-consistent behavior is more often found in the Matrix presentation format than in the (original) Map. Correspondingly, behavior best described by one of the decision strategies TTB, EQW, and WADD should be more prevalent in the Map presentation format than in the Matrix.
Hypothesis 2: Building on the presentation format effect found in Experiment 1, we assume that displaying negative cue values facilitates behavior compatible with PCS, whereas the need to infer negative cue values fosters the use of decision strategies instead.
Hypothesis 3: In Experiment 1, PCS was more prevalent in the Matrix presentation format (minimal information search) than in the Map (increased information search). We hypothesize that minimal information search facilitates PCS-consistent behavior, whereas the need to search for information leads to more frequent use of decision strategies.
Hypothesis 4: In Experiment 2, diagnostic pairs are employed for which EQW predicts guessing only in 14.29% of all cases, whereas for the diagnostic pairs used in Experiment 1 this strategy predicted guessing in two thirds of all cases. We assume that participants employ the principally useful EQW more often in this environment, now that it predicts guessing only rarely.
In this experiment, 108 participants took part (73 female, mean age 21.42). Most of them (107) were students from the University of Mannheim. For their participation, 93 participants received course credit, 15 participants received monetary compensation.
In order to replicate the basic presentation format effect of Experiment 1, all participants completed both the Matrix and the Map presentation format. 35 of them were also tested in the Negative Map condition, 36 completed the Fixed Map presentation format, and 37 were confronted with the Negative Fixed Map condition. The presentation order of the three presentation format blocks (Matrix, Map, plus one the aforementioned additional maps) was counter-balanced across all participants.
As in Experiment 1, model classification was carried out with the MM-ML method. Thus, choices, decision times, and confidence judgments were again recorded for each trial. Data were transformed and exclusion criteria set exactly as in Experiment 1.
Figure 3: Relative frequencies of decision strategy (TTB, EQW, or WADD) or PCS-consistent behavior in Experiment 2. The N for each of the presentation formats Matrix and Map is 108, whereas the total N of the remaining three presentation formats sums up to 108 as well (between-subjects manipulation). 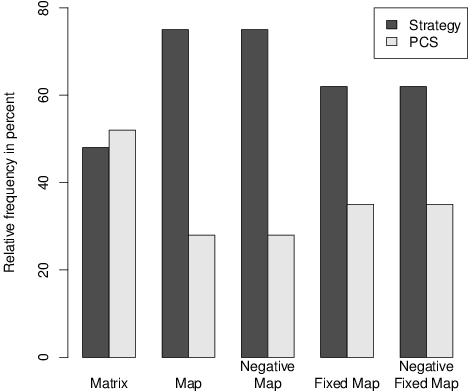
Table 1 (middle part) shows the result of the model classification with the MM-ML method. In line with Hypothesis 1, PCS was more often classified in the Matrix (57 participants) than in the Map (29 participants), whereas decision strategy use (EQW, TTB, or WADD) was more frequent in the Map (79 participants) than in the Matrix (51 participants) presentation format. Figure 3 shows the relative frequencies for all presentation formats of Experiment 2.
Employing the McNemar test for dependent samples, the comparison of the presentation formats Map and Matrix showed a significant effect in the direction assumed under Hypothesis 1: χ ²(1, N = 108) = 20.63, p < .001, OR = 6.60. Thus, the result of Experiment 1 was replicated in this experiment: PCS-consistent behavior was more prevalent in the Matrix presentation format, whereas behavior compatible with one of the decision strategies was found more often in the Map.
In order to test the importance of the presentation format effect of whether or not negative cue values are displayed (Hypothesis 2), one can (a) compare the maps with fixed cue orders with each other or (b) contrast the maps with random cue distribution with each other. The first comparison (a) showed no difference between the Fixed Map and the Negative Fixed Map: χ ²(1, N = 72) = 0.00, p = 1.00. For the within-subjects comparison between the Negative Map and the (original) Map (b), the McNemar test was not significant (χ2(1, N = 33) = 0.20, p = .66). According to these results, the presence/absence of negative cue values did not influence the information integration process.
The relevance of the extent of information search induced by the presentation format (Hypothesis 3) can be investigated with two comparisons: Comparing the maps with each other (c) where negative and positive cue values are displayed or (d) where only the positive cue values are displayed in both maps. Though for the first comparison (c) between the Negative Map and the Negative Fixed Map the assumed shift could be observed descriptively, it was not significant (χ ²(1, N = 69) = 0.62, p = .43). The second within-subjects comparison (d) between the Fixed Map and the (original) Map confirmed this finding: χ ²(1, N = 36) = 0.50, p = .48. Thus, reduced information search did not significantly facilitate PCS-consistent behavior. We did not find support for Hypothesis 3: The extent of information search—as manipulated in Experiment 2—does not seem to influence whether “automatic” decision making is frequently observed or not.
Hypothesis 4 deals with the side issue whether the frequency of EQW use depends on the nature of the diagnostic pairs presented to the participants. We predicted that EQW use should be more prevalent when this strategy predicts guessing only in few cases, as was the case in the current environment. In line with this assumption, we found that 18.52% of all data sets collected in Experiment 2 were classified as being best described by EQW. This result is supported by two cross-experimental comparisons between the identical conditions (presentation formats) of Experiments 1 and 2: When EQW is contrasted with all other strategies pooled into one category, the difference in EQW use between Experiments 1 and 2 is significant for the presentation format Matrix (χ ²(1, N = 191) = 11.95, p = .001, w = 0.25) and for the Map presentation format (χ ²(1, N = 191) = 10.72, p = .001, w = 0.24). Thus, the choice of the diagnostic pairs employed in an experiment seems to influence the prevalence of EQW use.
To sum up the findings of Experiment 2, we can first conclude that the presentation format effect found in Experiment 1 appears to be robust. PCS-consistent behavior is more prevalent in the Matrix than in the Map presentation format, whereas behavior best accounted for by the multiple strategy approach (EQW, TTB, and WADD) is more frequently found in the Map presentation format than in the Matrix. However, the results do not support a distinct influence of any of the two presentation format features (extent of information search and negative cue value presentation) investigated herein. Possibly, the manipulation of the information search costs was not strong enough between the search-intensive random order maps (Map and Negative Map) and the fixed order maps (Fixed Map and Negative Fixed Map) that did not completely eliminate information search, but required an intermediate level of search. Hence, the crucial difference between the Map and the Matrix might be whether search is necessary at all, whereas the amount of costs associated with it has no further impact, at least within the variations realized in this experiment.
Apart from these presentation format considerations, Experiment 2 showed that participants seem to choose their decision strategies adaptively contingent on the task environment, that is, the cue patterns presented to them. If a principally useful strategy (in the current case EQW) does not allow for making a distinct choice often enough (but rather implies guessing on many trials), individuals adapt their decision behavior and employ an alternative strategy that will discriminate between choice options more frequently. This finding is well in line with approaches to strategy selection that stress the role of learning processes (e.g., Bröder & Schiffer, 2006a; Rieskamp & Otto, 2006). Thus, experimenters need to be careful when constructing experimental environments and drawing conclusions that aim to generalize to other environments—not only in terms of, for example, discrimination rate, validity and redundancy of cues (see, for example, Bröder & Newell, 2008, or Gigerenzer et al., 2012, for an overview), but also in regard to the diagnostics pairs themselves that are presented to the participants.
Figure 4: Presentation formats adjusted Matrix (left), Random Row Matrix (center), and Random Display Matrix (right) in Experiment 3. 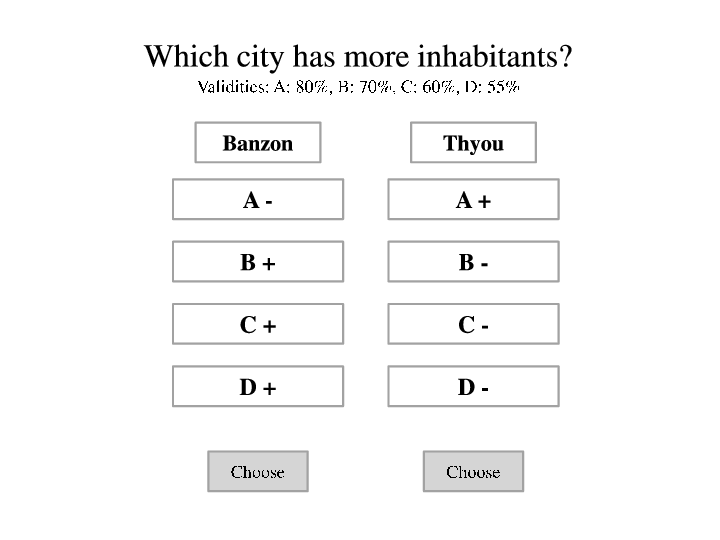
In Experiment 2, the presentation format effect of Experiment 1 was replicated. PCS-consistent information integration was more prevalent in the matrix-like presentation format (open information board) than in the presentation format that resembles a map. None of the newly established maps caused a clearly detectable increase in PCS-consistent behavior. As the manipulation of the presentation format feature information search might have been too weak in Experiment 2, Experiment 3 aims for a stronger manipulation of this feature within the original Matrix presentation format.
Gigerenzer et al. (2012) stressed the importance of information search processes to processes of information integration within the multiple strategy approach. As Glöckner and Betsch (2008b; 2012) pointed out, the relevance of information search processes for the PCS network model as well, we deemed this presentation format feature worth a closer look despite the non-significant result of Experiment 2. We suspect that the information search manipulation in Experiment 2 might have been too weak, because even in the maps with reduced information search (Fixed Map and Negative Fixed Map) a certain extent of search was unavoidable: Cue values were displayed in the quarter assigned to the respective cue, but within this quarter the exact spot of appearance for cue values was random. In contrast to this reduced information search, in the Matrix each spot of appearance for the cue values was completely predefined. Thus, information search is reduced to a minimum in the Matrix.
As a further reduction of information search in our view would eliminate the basic idea of a map presentation format, we decided to manipulate the considered presentation format feature within the matrix. As such, Experiment 3 tests two alternative matrix presentation formats that pose higher information search demands on the participants. This was done in order to be able to attribute the effects found in Experiments 1 and 2 to the theoretically interesting variable search rather than to potential other accidental differences between the formats.7
Apart from the information search manipulation, Experiment 3 aims to replicate the search cost effect established in the within-subjects designs of Experiments 1 and 2 in a between-subjects design.
In Experiment 3, four different presentation formats were included. Apart from the Map presentation format that has been tested in both Experiments 1 and 2, three matrices with different degrees of induced information search were employed.
The first matrix presentation format of Experiment 3 (adjusted Matrix, Figure 4, left) closely resembles the Matrix employed in Experiments 1 and 2 (Figure 1, left). The only slight adjustment relates to the cue labels. In contrast to Experiments 1 and 2 where the cue labels are displayed on the left side of the screen and function as row headings, in the adjusted Matrix the cue labels directly accompany the cue values. The cue order is constant across all trials with the most valid cue in the first row and the others following in descending order of validity. As this order is constant across all trials, information search is reduced to a minimum.
The second matrix presentation format (Random Row Matrix, Figure 4, center) demands more information search than the adjusted Matrix described previously (Figure 4, left). This manipulation is achieved by randomizing the cue rows of the matrix for each trial anew. Consequently, each cue might appear in any of the four rows on a given trial. Apart from this row-wise randomization the Random Row Matrix presentation format equals the adjusted Matrix.
In the third matrix presentation format (Random Display Matrix, Figure 4, right) information search is further increased as the cue order is not only randomized row-wise, but additionally within each column (i.e., option) for each trial anew. Thus, participants have to extensively search for the desired cue value information.
The design and procedure of Experiment 3 closely resembled Experiment 1 (including the diagnostic pairs and filler trials). However, in contrast to Experiment 1, each participant was randomly assigned to and worked on only one presentation format and thus completed the experiment after practice trials plus 70 decision trials.
Hypothesis 1: In Experiments 1 and 2, a within-subjects presentation format effect was found: PCS-consistent behavior was more frequently found in the Matrix presentation format and decision strategies (WADD, EQW, or TTB) were more prevalent in the Map. We hypothesize that this effect should also hold in a between-subjects design when a (slightly) adjusted Matrix is compared to the original Map.
Hypothesis 2: We hypothesize that the presentation format feature extent of information search predominantly drives the presentation format effect assumed under Hypothesis 1. Specifically, increased information search should lead to more frequent use of decision strategies, whereas PCS-compatible behavior is facilitated by particularly low information search costs.
In this experiment, 160 individuals participated (108 female, mean age 22.07), most of them (151) students of the University of Mannheim. They received course credit for their participation. In each presentation format condition, 40 participants were tested.
In Experiment 3 the same diagnostic pairs as in Experiment 1 were used. Model predictions and classification with the MM-ML method for Experiment 3 equal those of Experiment 1.
In Table 1 (lower part) the results of the model classification with the MM-ML method are displayed. The influence of increased information search can easily be seen here: Descriptively, the distribution in the matrices with increased information search (Random Row Matrix and Random Display Matrix) resembles the distribution observed for the Map presentation format, whereas the adjusted Matrix shows the opposite pattern.
In line with Hypothesis 1, use of decision strategies (EQW, TTB, or WADD) was more frequent in the Map (26 participants) than in the adjusted Matrix (10 participants), whereas PCS-consistent behavior was more often found in the adjusted Matrix (30 participants) than in the Map (14 participants) presentation format. Thus, the presentation format effect shown in Experiments 1 and 2 was replicated: χ ²(1, N = 80) = 12.93, p < .001, w = 0.40.
The influence of information search extent (Hypothesis 2) can be tested in two different ways: (1) Comparing the adjusted Matrix with minimal information search to the matrix with medium information search (Random Row Matrix), a distinct difference in the assumed direction was observed. A chi-square test corroborated the effect (χ ²(1, N = 80) = 11.43, p = .001, w = 0.38) which was medium to large in size (Cohen, 1988). To test (2) whether a further increase in information search would intensify the change in information processing, the Random Row Matrix was compared with the Random Display Matrix. There was no difference between these two presentation formats (χ ²(1, N = 77) = 0.01, p = .98). As such, further increasing the extent of information search did not cause any additional shifts from PCS to decision strategy consistent behavior (or vice versa). Thus, a moderate necessity for information search sufficed to induce more frequent use of sequential decision strategies (EQW, TTB, and WADD), whereas an additional increase did not change information processing.
In order to test whether the presentation format effect observed under Hypothesis 1 can be eliminated by equalizing information search demands, the information search-intensive Map presentation format is compared to the matrix with maximal information search (Random Display Matrix with completely random cue value order). The chi-square test shows that, when information search is comparable, no presentation format effect can be found anymore (χ ²(1, N = 77) = 0.07, p = .80).
To sum up the results of Experiment 3, the presentation format effect observed in the within-subjects designs of Experiments 1 and 2 is also clearly visible in the between-subjects design of Experiment 3. Automatic, parallel information integration as proposed by the PCS model was more prevalent in the adjusted Matrix and sequential computation in the Map presentation format. We found this effect in three different samples and in within- as well as between-subjects designs. Thus, the effect of the presentation format on information processing seems to be robust.
Additionally, the importance of the presentation format feature information search could be established. A moderate increase in the extent of information search appeared to hinder PCS-consistent information integration considerably. However, a further increase in the extent of information search did not affect information processing beyond that. Interestingly, the presentation format effect disappeared when the extent of information search was most comparable across the two presentation formats. Thus, the presentation format feature information search seems to predominantly drive the aforementioned presentation format effect.
Previous research on the format of information presentation (Bergert & Nosofsky, 2007; Bröder & Newell, 2008; Newell et al., 2007; Newell & Lee, 2010; Platzer & Bröder, 2012) suggests that the accessibility of information might influence the process of decision making. Whereas proponents of the PCS network model have shown that PCS-consistent behavior is highly prevalent when information is presented in the standardized matrix format (e.g., Glöckner & Betsch, 2008b; Horstmann et al., 2009), the role of the presentation format itself—and, more importantly, the accessibility of information—in fostering reliance on PCS-like processes has not yet been tested systematically. Employing the City-Size task for probabilistic inferences, we developed an alternative presentation format (based on the idea of a map) to test the assumption that decision makers’ ability to rely on PCS-like processes is bounded by information accessibility and thus hampered once the “wrong” presentation format is used.
Across all three experiments, a robust presentation format effect between the matrix with high accessibility of information and the map with reduced information accessibility could be found: PCS-compatible behavior was much more prevalent in the former than in the latter, whereas participants used one of the sequential decision strategies (WADD, TTB, or EQW) more frequently in the map than in the matrix. Whereas Experiment 1 established this basic effect, Experiments 2 and 3 aimed to clarify which specific feature of presentation formats might have driven the observed effect. However, in Experiment 2 there was neither an effect of (1) whether negative cue values are displayed (or have to be inferred by the participant) nor of (2) the extent of information search induced by the presentation format. Hence, search per se rather than its amount seemed to hamper PCS use. Varying the search demands within the matrix format, Experiment 3 revealed that already a moderate increase in the extent of information search reduces PCS-consistent behavior considerably. In turn, once the extent of information search was held constant across presentation formats, the presentation format effect was no longer observable.
Thus, although a presentation format effect was reliably found in all three experiments, it was not the presentation format per se that caused this shift in information integration processes, but the accessibility of information induced by the format. Only when all pieces of information are instantly and simultaneously available, PCS-consistent behavior is predominantly observed. In turn, even moderate information search demands reducing the accessibility of information, suffice to hamper PCS-compatible processes. Consequently, decision makers are more likely to engage in sequential information processing as assumed by the multiple strategy approach.
One may argue that the information accessibility effect reported here may alternatively be attributed to spurious WADD-classifications of actual PCS-users in the presentation formats with decreased information accessibility (especially the “maps”). Both models make the same predictions for choice outcomes and confidence judgments, but WADD is the null-model in terms of decision times (assuming no decision time differences between different item types). Thus, adding noise to the decision times—as is the case with decreased information accessibility—might blur the actual time differences between item types, resulting in an advantage of the null-model WADD over the alternative model PCS. Although it is possible that noise in the decision times might have contributed to the pattern observed in our data, it cannot account for the reported “strategy shifts” comprehensively, mainly for two reasons: First, in the presentation formats with decreased information accessibility, although we do observe more WADD-classifications as opposed to PCS (which is what the noise interpretation predicts), we also find a considerable increase in TTB-classifications and TTB is not a null-model in terms of decision times. Thus, this “strategy shift” cannot be accounted for by the noise interpretation. Second, analyzing the absolute decision time differences between item types that should provoke particularly different decision times according to the PCS model (but not according to all other models), we mostly find results that are incompatible with a mere noise-based interpretation, but instead corroborate the interpretation of our results as being produced by different underlying processes.8
Our results are aligned with previous research on the (ir)relevance of information presentation format for decision strategy use. Reviewing their own empirical work, Bröder and Newell (2008) concluded that the format of the stimulus material seems to have little effect—as long as solving the decision problem does not burden working memory too much. Platzer and Bröder (2012) reported that the “format effect” reported by Bröder and Schiffer (2003b; 2006b) disappeared when controlling for salience. Testing a sequential evidence accumulation model (Lee & Cummins, 2004), Newell and Lee (2010) found little systematic effect of the stimulus format on choice behavior. These findings suggest that decision processes depend on the accessibility of information fostered or hampered by certain formats rather than on the format per se. The current findings extend this conclusion to a different class of processes as specified in a model assuming automatic, parallel information integration (PCS).
The important role of information accessibility to PCS-consistent behavior was only recently discussed for inferences from memory. Comparing their research results with the findings of Bröder and colleagues (Bröder & Gaissmaier, 2007; Bröder & Schiffer, 2003b), Glöckner and Hodges (2011) conclude that the accessibility of information might constitute a relevant variable that influences the process of decision making. When all applicable pieces of information are quickly available without high memory costs, PCS-consistent behavior can be observed, whereas it is only rarely found when retrieval imposes high memory costs and information accessibility is therefore reduced. Our results show that this reasoning can be transferred to inferences from givens as well.
The work reported here refines Glöckner and Betsch’s (2008b) note on one possible condition for selecting PCS-like processes in information integration: the influence of information search. Analogous to Lohse and Johnson (1996) who compared different process tracing methods (see also Norman & Schulte-Mecklenbeck, 2010), Glöckner and Betsch (2008b) reported a shift in the information integration process contingent on the method employed for information presentation (open versus closed information board): If all pieces of information were simultaneously displayed, PCS-consistent behavior was highly prevalent, whereas sequential information search lead to a marked decrease. The current results extend such conclusions in showing that—even in presentation formats that display all pieces of information simultaneously—a moderate reduction in information accessibility also reduces the prevalence of PCS-consistent behavior.
But why does the ability to integrate information in a PCS-consistent manner seem to crucially depend on a high accessibility of information? Glöckner and colleagues emphasized that the PCS model integrates automatic, perception-like processes (Glöckner & Betsch, 2012; Glöckner & Hodges, 2011). They explicitly draw a parallel between their PCS network model and Gestalt psychology’s basic idea of automatic consistency maximization (Glöckner & Betsch, 2008a). From this we deem it plausible that automatic, parallel information integration as assumed by the PCS model heavily relies on the immediate accessibility of information. If all applicable pieces of information can—without recoding—be captured by a simple perception-like process, a mental representation (“Gestalt”) of the choice situation can quickly be constituted in a holistic process (see Peterson & Rhodes, 2003, for an overview on holistic processing in perception). PCS-consistent information processing relies on this immediate constitution of a mental network and is thus hampered when information needs to be restructured and recoded before it can be integrated. If the quick, automatic default for decision making (PCS) cannot be applied, the decision maker has to resume to sequential decision making strategies instead.
This reasoning is well in line with Marewski and Schooler’s (2011) cognitive niche framework: For different environments, different processes are applicable. From a cost-benefit-view, “automatic” decision making should prevail whenever it is applicable. If, however, the constitution of the proposed mental network is impaired, the default strategy is no longer applicable and people have to select a different decision strategy from the set of applicable options.
Our findings emphasize the importance of considering both information acquisition processes on the one hand and processes of information integration on the other hand (see also Glöckner & Betsch, 2008a; Glöckner & Hilbig, 2012, and for a similar finding in the domain of risky choices Hilbig & Glöckner, 2011) as two interdependent but nonetheless separate parts of the whole decision making process. Gigerenzer et al. (2012) recently highlighted the importance of information search processes for the processes of information integration, illustrating that within the multiple strategy approach shifts between fast and frugal heuristics and more complex decision strategies (e.g., WADD) have repeatedly been reported. Gigerenzer et al. (2012) demonstrate that these results can be attributed to differences in the extent of information search induced by the respective choice environment. Clearly, it is well in line with such arguments that automatic, parallel information integration as proposed by the PCS network model is also crucially influenced by information search demands.
Building on these results, it might be possible to create real-life choice situations in a way so as to facilitate PCS-consistent information processing. Here, the focus should be on the accessibility of information in general and the extent of information search in particular (Gigerenzer et al., 2012; Glöckner & Betsch, 2012), because these variables considerably influence the information integration process. Future research on the potentiality of automatic, parallel information integration as proposed by the PCS network model should aim to identify further variables (see, for example, Ahlgrimm et al., 2010, May; Horstmann et al., 2009; Hass & Pachur, 2011, March) that facilitate (or hamper) this quick way to normatively optimal decisions that does not necessitate much time and effort.
Ayal, S., & Hochman, G. (2009). Ignorance or integration: Examining the nature of the cognitive processes underlying choice behavior. Journal of Behavioral Decision Making, 22, 455–474.
Beach, L. R., & Mitchell, T. R. (1978). A contingency model for the selection of decision strategies. Academy of Management Review, 3, 439–449.
Ben Zur, H., & Bresnitz, S. J. (1981). The effect of time pressure on risky choice behavior. Acta Psychologica, 47, 89–104.
Bergert, F. B., & Nosofsky, R. M. (2007). A responsetime approach to comparing generalized rational and take-the-best models of decision making. Journal of Experimental Psychology: Learning, Memory, and Cognition, 33, 107–129.
Bröder, A. (2000). Assessing the empirical validity of the “take-the-best” heuristic as a model of human probabilistic inference. Journal of Experimental Psychology: Learning, Memory, and Cognition, 26, 1332–1346.
Bröder, A. (2010). Outcome-based strategy classification. In A. Glöckner & C. L. Witteman (Eds.), Foundations for tracing intuition: Challenges and methods (pp. 61–82). London: Psychology Press & Routledge.
Bröder, A., & Eichler, A. (2006). The use of recognition and additional cues in inferences from memory. Acta Psychologica, 121, 275–284.
Bröder, A., & Gaissmaier, W. (2007). Sequential processing of cues in memory-based multiattribute decisions. Psychonomic Bulletin & Review, 14, 895–900.
Bröder, A., & Newell, B. R. (2008). Challenging some common beliefs: Empirical work within the adaptive toolbox metaphor. Judgment and Decision Making, 3, 205–214.
Bröder, A., Newell, B. R., & Platzer, C. (2010). Cue integration vs. exemplar-based reasoning in multi-attribute decisions from memory: A matter of cue representation. Judgment and Decision Making, 5, 326–338.
Bröder, A., & Schiffer, S. (2003a). Bayesian strategy assessment in multi-attribute decision making. Journal of Behavioral Decision Making, 16, 193–213.
Bröder, A., & Schiffer, S. (2003b). Take the best versus simultaneous feature matching: Probabilistic inferences from memory and effects of representation format. Journal of Experimental Psychology: General, 132, 277–293.
Bröder, A., & Schiffer, S. (2006a). Adaptive flexibility and maladaptive routines in selecting fast and frugal decision strategies. Journal of Experimental Psychology: Learning, Memory, and Cognition, 32, 904–918.
Bröder, A., & Schiffer, S. (2006b). Stimulus format and working memory in fast and frugal strategy selection. Journal of Behavioral Decision Making, 19, 361–380.
Cohen, J. (1988). Statistical power analysis for the social sciences (2nd edition). Hillsdale, New Jersey: Erlbaum.
Czerlinski, J., Gigerenzer, G., & Goldstein, D. G. (1999). How good are simple heuristics? In G. Gigerenzer, P. M. Todd, & the ABC Research Group (Eds.), Simple heuristics that make us smart (pp. 97–118). New York: Oxford University Press.
Dawes, R. M. (1979). The Robust Beauty of Improper Linear Models in Decision Making. American Psychologist, 34, 571–582.
Evans, J. S. B. T. (2008). Dual-processing accounts of reasoning, judgment, and social cognition. Annual Review of Psychology, 59, 255–278.
Gigerenzer, G. (2007). Gut feelings. The intelligence of the unconscious. New York: Viking.
Gigerenzer, G. (2008). Rationality for mortals. How people cope with uncertainty. New York: Oxford University Press.
Gigerenzer, G., Dieckmann, A., & Gaissmaier, W. (2012). Efficient cognition through limited search. In P. M. Todd, G. Gigerenzer & the ABC Research Group (Eds.), Ecological rationality: Intelligence in the world (pp. 241–273). New York: Oxford University Press.
Gigerenzer, G., & Gaissmaier, W. (2011). Heuristic decision making. Annual Review of Psychology, 62, 451–482.
Gigerenzer, G., & Goldstein, D. G. (1996). Reasoning the fast and frugal way: Models of bounded rationality. Psychological Review, 103, 650–669.
Gigerenzer, G., & Goldstein, D. G. (1999). Betting on one good reason: The take the best heuristic. In G. Gigerenzer, P. M. Todd & the ABC Research Group (Eds.), Simple heuristics that make us smart (pp. 75–95). New York: Oxford University Press.
Gigerenzer, G., Hoffrage, U., & Kleinbölting, H. (1991). Probabilistic mental models: A Brunswikian theory of confidence. Psychological Review, 98, 506–528.
Gigerenzer, G., & Todd, P. M. (1999). Fast and frugal heuristics: The adaptive toolbox. In G. Gigerenzer, P. M. Todd, & the ABC Research Group (Eds.), Simple heuristics that make us smart (pp. 3–34). New York: Oxford University Press.
Gigerenzer, G., Todd, P. M., & the ABC Research Group (Eds.). (1999). Simple Heuristics that make us smart. New York: Oxford University Press.
Gilovich, T., Griffin, D., & Kahneman, D. (Eds.). (2002). Heuristics and biases: The psychology of intuitive judgment. New York: Cambridge University Press.
Glöckner, A. (2009). Investigating intuitive and deliberate processes statistically: The multiple-measure maximum likelihood strategy classification method. Judgment and Decision Making, 4, 186–199.
Glöckner, A. (2010). Multiple measure strategy classification: Outcomes, decision times and confidence ratings. In A. Glöckner & C. L. Witteman (Eds.), Foundations for tracing intuition: Challenges and methods (pp. 83–105). London: Psychology Press & Routledge.
Glöckner, A., & Betsch, T. (2008a). Modeling option and strategy choices with connectionist networks: Towards an integrative model of automatic and deliberate decision making. Judgment and Decision Making, 3, 215–228.
Glöckner, A., & Betsch, T. (2008b). Multiple-reason decision making based on automatic processing. Journal of Experimental Psychology: Learning, Memory, and Cognition, 34, 1055–1075.
Glöckner, A., & Betsch, T. (2012). Decisions beyond boundaries: When more information is processed faster than less. Acta Psychologica, 139, 532–542.
Glöckner, A., & Bröder, A. (2011). Processing of recognition information and additional cues: A model-based analysis of choice, confidence, and response time. Judgment and Decision Making, 6, 23–42.
Glöckner, A., & Hilbig, B. E. (2012). What is adaptive about adaptive decision making? Testing single- versus multiple-strategy models in probabilistic inference tasks. Manuscript submitted for publication.
Glöckner, A., & Hodges, S. D. (2011). Parallel constraint satisfaction in memory-based decisions. Experimental Psychology, 58, 180–195.
Glöckner, A., & Witteman, C. L. M. (2010). Beyond dual-process models: A categorization of processes underlying intuitive judgment and decision making. Thinking and Reasoning, 16, 1–25.
Hass, A. N., & Pachur, T. (2011, March). Die Rahmenbedingungen automatischer Entscheidungsprozesse. Poster presented at the 53rd Tagung experimentell arbeitender Psychologen, Halle (Saale), Germany.
Hilbig, B. E., & Glöckner, A. (2011). Yes, they can! Appropriate weighting of small probabilities as a function of information acquisition. Acta Psychologica, 138, 390–396.
Horstmann, N., Ahlgrimm, A., & Glöckner, A. (2009). How distinct are intuition and deliberation? An eye-tracking analysis of instruction-induced decision modes. Judgment and Decision Making, 4, 335–354.
Jekel, M., Nicklisch, A., & Glöckner, A. (2010). Implementation of the multiple-measure maximum likelihood strategy classification method in R: Addendum to Glöckner (2009) and practical guide for application. Judgment and Decision Making, 5, 54–63.
Köhler, W. (1947). Gestalt psychology: An introduction to new concepts in modern psychology. New York: Liveright.
Lee, M. D., & Cummins, T. D. (2004). Evidence accumulation in decision making: Unifying the “take the best” and the “rational” models. Psychonomic Bulletin & Review, 11, 343–352.
Lohse, G., & Johnson, E. (1996). A comparison of two process tracing methods for choice tasks. Organizational Behavior and Human Decision Processes, 68, 28–43.
Marewski, J. N., & Schooler, L. J. (2011). Cognitive niches: An ecological model of strategy selection. Psychological Review, 118, 393–437.
McNemar, Q. (1947). Note on the sampling error of the difference between correlated proportions or percentages. Psychometrika, 12, 153–157.
Moshagen, M., & Hilbig, B. E. (2011). Methodological notes on model comparisons and strategy classification: A falsificationist proposition. Judgment and Decision Making, 6, 814–820.
Newell, B. R., Collins, P., & Lee, M. D. (2007). Adjusting the spanner: Testing an evidence accumulation model of decision making. In D. McNamara & G. Trafton (Eds.), Proceedings of the 29th Annual Conference of the Cognitive Science Society. Mahwah, New Jersey: Erlbaum.
Newell, B. R., & Lee, M. D. (2010). The right tool for the job? Comparing an evidence accumulation and a naive strategy selection model of decision making. Journal of Behavioral Decision Making, 24, 456–481.
Newell, B. R., & Shanks, D. R. (2003). Take the best or look at the rest? Factors influencing "one-reason” decision-making. Journal of Experimental Psychology: Learning, Memory, and Cognition, 29, 53–65.
Norman, E., & Schulte-Mecklenbeck, M. (2010). Take a quick click at that! Mouselab and eye-tracking as tools to measure intuition. In A. Glöckner & C. Witteman (Eds.), Foundations for tracing intuition: Challenges and methods (pp. 24–44). New York: Psychology Press.
Payne, J. W. (1976). Task complexity and contingent processing in decision making: An information search and protocol analysis. Organizational Behavior and Human Performance, 16, 366–387.
Payne, J. W., Bettman, J. R. & Johnson, E. J. (1988). Adaptive strategy selection in decision making. Journal of Experimental Psychology: Learning, Memory, and Cognition, 14, 534–552.
Payne, J. W., Bettman, J. R., & Johnson, E. J. (1993). The adaptive decision maker. New York: Cambridge University Press.
Peterson, M. A., & Rhodes, G. (Eds.). (2003). Perception of faces, objects, and scenes: Analytic and holistic processes. New York: Oxford University Press.
Platzer, C., & Bröder, A. (2012). Most people do not ignore salient invalid cues in memory-based decisions. Psychonomic Bulletin & Review, 19, 654–661.
Rieskamp, J., & Hoffrage, U. (1999). When do people use simple heuristics, and how can we tell? In G. Gigerenzer, P. M. Todd & the ABC Research Group (Eds.), Simple heuristics that make us smart (pp. 141–167). New York: Oxford University Press.
Rieskamp, J., & Otto, P. E. (2006). SSL: A theory of how people learn to select strategies. Journal of Experimental Psychology: General, 135, 207–236.
Schwarz, G. (1978). Estimating the dimension of a model. The Annals of Statistics, 6, 461–464.
Wagenmakers, E.-J. (2007). A practical solution to the pervasive problems of p values. Psychonomic Bulletin & Review, 14, 779–804.
The MM-ML method (Glöckner 2009, 2010) allows for model classification on an individual level. Predictions for each of the dependent measures (choices, decision times, confidence judgments) and employed diagnostic pairs are derived for each model. Accordingly, up to seven free parameters are necessary to specify a model k. The MM-ML method estimates optimal values for each of the free parameters of model k and calculates the maximum conditional likelihood for the observed data pattern given the application of model k:
|
| BICk = −2 ln(Lk(total)) + ln(Nobs)Np |
| Cue | Pair 1 | Pair 2 | Pair 3 | Pair 4 | Pair 5 | Pair 6 | ||||||
| Option | Option | Option | Option | Option | Option | |||||||
| "A" | "B" | "A" | "B" | "A" | "B" | "A" | "B" | "A" | "B" | "A" | "B" | |
| Cue A (v = .80) | + | − | + | − | + | − | + | − | + | − | − | − |
| Cue B (v = .70) | + | − | + | − | − | + | − | − | − | + | − | − |
| Cue C (v = .60) | + | − | − | + | − | + | − | − | + | − | + | − |
| Cue D (v = .55) | − | + | − | + | − | + | − | + | − | + | − | + |
Pair 1 | Pair 2 | Pair 3 | Pair 4 | Pair 5 | Pair 6 | |
| Choice | ||||||
EQW | A | Guessing | B | Guessing | Guessing | Guessing |
TTB | A | A | A | A | A | A |
WADD | A | A | B | A | A | A |
PCS | A | A | B | A | A | A |
| Decision time (contrasts) | ||||||
EQW | 0 | 0 | 0 | 0 | 0 | 0 |
TTB | −0.167 | −0.167 | −0.167 | −0.167 | −0.167 | 0.833 |
WADD | 0 | 0 | 0 | 0 | 0 | 0 |
PCS | −0.400 | −0.310 | 0.600 | −0.120 | 0.110 | 0.130 |
| Confidence judgment (contrasts) | ||||||
EQW | 0.667 | −0.330 | 0.667 | −0.330 | −0.330 | −0.330 |
TTB | 0.167 | 0.167 | 0.167 | 0.167 | 0.167 | −0.833 |
WADD | 0.630 | 0.230 | −0.370 | 0.030 | −0.170 | −0.370 |
PCS | 0.620 | 0.280 | −0.320 | −0.010 | −0.190 | −0.380 |
| Note. EQW: “Equal Weight Rule”, TTB: “Take-The-Best”-heuristic, WADD: corrected “Weighted Additive Rule”, PCS: “Parallel Constraint Satisfaction”. | ||||||
| Cue | Pair 1 | Pair 2 | Pair 3 | Pair 4 | Pair 5 | Pair 6 | Pair 7 | |||||||
| "A" | "B" | "A" | "B" | "A" | "B" | "A" | "B" | "A" | "B" | "A" | "B" | "A" | "B" | |
| Cue A (v = .80) | + | − | + | − | − | − | − | − | + | + | + | − | + | − |
| Cue B (v = .70) | + | − | − | + | − | − | + | − | + | − | + | + | + | + |
| Cue C (v = .60) | + | − | − | + | + | − | + | − | − | + | − | + | + | − |
| Cue D (v = .55) | − | + | − | + | − | + | + | + | − | + | − | + | − | − |
Pair 1 | Pair 2 | Pair 3 | Pair 4 | Pair 5 | Pair 6 | Pair 7 | |
| Choice | |||||||
EQW | A | B | Guessing | A | B | B | A |
TTB | A | A | A | A | A | A | A |
WADD | A | B | A | A | A | A | A |
PCS | A | B | A | A | A | A | A |
| Decision time (contrasts) | |||||||
EQW | 0 | 0 | 0 | 0 | 0 | 0 | 0 |
TTB | −0.286 | −0.286 | 0.714 | 0.214 | 0.214 | −0.286 | −0.286 |
WADD | 0 | 0 | 0 | 0 | 0 | 0 | 0 |
PCS | −0.422 | 0.578 | 0.351 | −0.301 | 0.169 | −0.074 | −0.301 |
| Confidence judgment (contrasts) | |||||||
EQW | 0.286 | 0.286 | −0.714 | 0.286 | −0.214 | −0.214 | 0.286 |
TTB | 0.286 | 0.286 | −0.714 | −0.214 | −0.214 | 0.286 | 0.286 |
WADD | 0.657 | −0.343 | −0.343 | 0.157 | −0.343 | −0.143 | 0.357 |
PCS | 0.650 | −0.298 | −0.350 | 0.149 | −0.269 | −0.140 | 0.257 |
| Note. EQW: “Equal Weight Rule”, TTB: “Take-The-Best”-heuristic, WADD: corrected “Weighted Additive Rule”, PCS: “Parallel Constraint Satisfaction”. | |||||||
| p(k|D) = |
|
We thank Lisa Marie Haag, Ruth Hebsaker, Hannah Helfrich, Laura Jutz, Lena Knapp, Corinna Lippenberger, Elena Müller, and Lisa Rostock for their assistance with Experiment 3. Experiment 1 was part of the first author’s diploma thesis at the University of Mannheim.
Copyright: © 2013. The authors license this article under the terms of the Creative Commons Attribution 3.0 License.
This document was translated from LATEX by HEVEA.