Judgment and Decision Making, Vol. 8, No. 5, September 2013, pp. 589-602
External validity of individual differences in multiple cue probability learning: The case of pilot trainingNadine Matton* Éric Raufaste# Stéphane Vautier# |
Individuals differ in their ability to deal with unpredictable environments. Could impaired performances on learning an unpredictable cue-criteria relationship in a laboratory task be associated with impaired learning of complex skills in a natural setting? We focused on a multiple-cue probability learning (MCPL) laboratory task and on the natural setting of pilot training. We used data from three selection sessions and from the three corresponding selected pilot student classes of a national airline pilot selection and training system. First, applicants took an MCPL task at the selection stage (N=556; N=701; N=412). Then, pilot trainees selected from the applicant pools (N=44; N=60; N=28) followed the training for 2.5 to 3 yrs. Differences in final MCPL performance were associated with pilot training difficulties. Indeed, poor MCPL performers experienced almost twice as many pilot training difficulties as better MCPL performers (44.0% and 25.0%, respectively).
Keywords: multiple-cue probability learning, individual differences, learning
profiles, pilot selection, pilot training.
Individuals permanently have to learn to adapt to non-deterministic environments. The weather, stock exchange shares, presidential elections or the efficacy of medical care depend on so many factors that they cannot be considered as totally predictable. However, some people are less efficient than others in dealing with noisy environments. Indeed most education systems put only little emphasis on learning to cope with unpredictability or with noisy information. Therefore it is not surprising to hear from examples of mathematicians who persist in taking suboptimal stock market decisions (see the example of John Allen Paulos cited by Stanovich, 2009). Could one detect such difficulties in dealing with uncertainty in real life with a laboratory cognitive task simulating learning in an unpredictable environment?
The field of aviation is specially illustrative of situations involving the ability to deal with unpredictable events. For pilots especially, the necessary skills cannot be learned solely by explicit instruction and by acquisition of declarative knowledge. In particular, acquiring flying skills involves learning to infer relationships between cues (nature of clouds, wind force, physiological sensations, visual cues of surrounding environment..) and criteria (aircraft speed, altitude,...) through repeated experiences. Pilot students have to learn to infer which cues are positively or negatively related to aircraft attitude and which cues are irrelevant in a given situation. Some pilot students need more flying hours than others, and some of them never complete pilot training. In the US Air Force, for example, despite selection of the best applicants for pilot training, some pilot students fail or have difficulties during training (e.g., Carretta, 2011).
Learning in nondeterministic environments has widely been studied using the Multiple Cue Probability Learning (MCPL) task, which grew out of probabilistic functionalism (Brunswik, 1955, 1956). Learners have to predict criterion states from states of cues through exposure to successive multiple cue-criterion configurations (for reviews, see Hammond & Stewart, 2001; Karelaia & Hogarth, 2008). Uncertainty in the tasks comes from the non-deterministic relationship between cues and criteria. Large individual differences are usually found in the final performance in such tasks (for a recent study including individual analyses, see Speekenbrink & Shanks, 2010).
In the present paper we aimed at exploring individual differences in MCPL within a pilot selection context and at relating them to pilot training outcome. More precisely, we assessed the proportion of pilot students who experienced difficulties during training for various subgroups of students classified by their MCPL performance. The next sections present elements of the MCPL paradigm, airline pilot selection and training, and the general principle of the empirical studies that will be presented.
Learning in uncertain environments has usually been approached through MCPL tasks. In a typical MCPL experiment, participants must discover a cue-criterion relationship through a series of trials. The basic task for the participant is to learn to make predictions of a criterion from cues, after successive trials representing values of the cues and the criterion. For example, a trader must predict share values given some financial cues to help him decide. Various types of feedback can be provided to participants. In the present paper, we focus on situations where only outcome feedback is available, that is, situations where the observed value of the criterion is provided after the participant gives his prediction on each trial. In the preceding example, the trader can be told which value was actually reached by the share. In the case of nondeterministic relationships, the actual value of the criterion differs from the target rule prediction by some random value that changes from trial to trial. Since outcome feedback does not reflect the target rule perfectly, participants must infer the target rule despite the noise.
Other kinds of feedback have been proposed in the literature, such as providing characteristics of the cue-criterion relationships (task information), providing the person’s cue-utilization (cognitive information), or providing the relations between the person’s perception of environment and the environment (e.g., Balzer, Doherty, & O’Connor, 1989; Newell, Weston, Tunney, & Shanks, 2009). In complex MCPL tasks (e.g., high number of cues or non linear relations between cues and criterion) outcome feedback is not necessarily helpful for the learning process (Harvey, 2011). Nevertheless, we chose to focus on outcome feedback because we believe it is more representative of real-world situations, and because this type of feedback may be helpful in the kind of tasks used in the present studies, with few and uncorrelated cues (Hogarth & Karelaia, 2007).
A standard view holds that MCPL involves a hypothesis testing activity in which the individual constructs hypotheses from memory about the relationship between the cues and the criterion and tests them with the available data (Brehmer, 1980; Lindberg & Brehmer, 1977). In non-deterministic MCPL tasks where outcome feedback is provided, given its noisy nature, the individual has also to resist frustration, and defense mechanisms may be involved in order to reduce the generated anxiety (Smedslund, 1955). Individual differences in MCPL performances have notably been found between pathological and non-pathological groups. For instance, schizophrenics’ performances were increasingly impaired as the number of cues augmented (Gillis, 1969). Depressed individuals also demonstrated difficulties in applying consistently a particular cognitive strategy and in utilizing new and more relevant information (Post, 1978). Furthermore, paranoid individuals manifested greater difficulty in ignoring irrelevant aspects of the environment compared to non-paranoid individuals (Gillis & Davis, 1973). On non-pathological individuals, no consistent differences in performances have been found between cognitively simple and complex participants (Winters, 1970) or between individuals varying in cognitive styles, using the Myers-Briggs Type Indicator (Ruble & Cosier, 1990). More generally, MCPL studies have shown large variability in the strategies used by participants (e.g., Gluck, Shohamy, & Myers, 2002; Meeter, Myers, Shohamy, Hopkins, & Gluck, 2006).
The impact of the nature of the task on the performances has been widely studied. Linear relationships are easier to learn than non linear ones (e.g., Hammond & Summers, 1965). Performances are also better when the proportion of noise is smaller (e.g., Peterson & Ulehla, 1964). Tasks with mixed cues, i.e., with some cues being positively and other cues being negatively related to the criterion, have been shown to be sensitive to age and working memory capacity differences. Young adults were compared to old people, to young children and adolescents. Consistently, young adults were the group with the highest MCPL performances (Chasseigne et al., 2004; Lafon, Chasseigne, & Mullet, 2004). The authors hypothesized that tasks with mixed cues involve the inhibition of the prepotent direct relation response and the coordination of the different cue values, which is supposed to load heavily on executive functioning. Rolison, Evans, Walsh, and Dennis (2011) found that individuals with high working memory capacity (WMC) performed better on tasks that contained positive and negative cues than individuals with low WMC, but high-WMC individuals performed no better in tasks containing only positive cues.
For a student with no flying experience, airline pilot training lasts 2.5 to 3 years and consists of theoretical and practical training. After taking theory examinations for the Airline Transport Licence on aeronautical knowledge, pilot students train for pilot licences (Commercial Pilot Licence with the qualification for Instrument Rules flights, Multiple Engine aircraft, or Multi-Crew Cooperation). Practical training is composed of flying hours with a flight instructor and simulator flights grouped in several phases (manoeuvrability, radio-navigation, instrument flight rules,...). At the end of each phase, a check flight assesses the flying skills of the pilot student. In case of difficulties, additional flying hours or the exclusion from the training are decided by the training organization. Given the high cost of flying hours (training one single student costs about 250 K€, i.e., ≈ 320 K$), pilot training organizations are interested in limiting the number of additional flying hours and the number of training failures.
The pilot selection process is usually composed of successive steps. The most common selection tools are cognitive ability tests, psychomotor tests, group exercises and individual interviews (Carretta, Retzlaff, Callister, & King, 1998; Goeters, Maschke, & Eissfeld, 2004; Martinussen, 1996). Various psychological dimensions are traditionally evaluated: Spatial ability, numerical ability, verbal ability, attentional ability, multitasking, decision making, cooperation, communication, leadership, and other personality measurements. However, to our knowledge, in these selection processes the ability to learn to deal with uncertainty has never been assessed directly.
Much research has been focused on assessing the relationship between student performance at the selection tests and pilot training outcome, i.e., the predictive validity of the selection tests (Burke, Hobson, & Linsky, 1997; Carretta, 2011; Carretta & Ree, 1994, 2003; Damos, 1993; Martinussen, 1996; Martinussen & Torjussen, 1998; Olea & Ree, 1994; Park & Lee, 1992; Ree & Carretta, 1996; Schmidt & J. E. Hunter, 1998; Stauffer & Ree, 1996).
Most predictive validity studies use correlations between selection test scores and training outcome. The training outcome is evaluated through flying grades, instructor assessments or pass/fail criteria. Correlations between selection tests and training outcome typically ranged between r=.15 and r=.40. The best predictors were composite scores based on cognitive and psychomotor tests (e.g., r=.37, Martinussen, 1996). Nevertheless, predictive validity of the pilot selection test scores has declined since the 1960s; for instance, the mean correlation between mechanical ability scores and pilot training outcome decreased from r=.32 to r=.14 between 1940–1960 and 1961–1990 (D. R. Hunter & Burke, 1994). Thus, it is important to better comprehend the causes of failure. An investigation of these causes in a pilot training organization showed that the pilot students who had difficulties during practical training were not necessarily the worst performers on the cognitive ability tests used at the selection stage (Matton, 2008). Indeed, practical flying training involves different processes than those required to perform well on traditional cognitive ability tests. Student pilots have in particular to learn to deal with uncertain elements (e.g., weather, nearby traffic, engine failures, etc.) and to make decisions based on incomplete data. In some cases, flight instructors noted that pilot students had difficulty facing the unexpected and/or had difficulty identifying the most relevant information and got lost in details. Thus, it seemed beneficial to assess the candidates’ ability to adapt to uncertainty through the MCPL paradigm and to evaluate the relationship with pilot training outcome.
The idea was to relate MCPL performance to pilot training outcome. The studies were carried out in an actual pilot selection and training context. The French Air Transport Pilot Training School, “ENAC”, offers each year the opportunity to 20 to 80 young students to receive free theoretical and practical airline pilot training. In this organization, pilot selection comprises three steps: written-academic tests (mathematics, physics, English), cognitive-ability tests and final tests (group exercises completed by individual interviews, and an oral English exam). Among those students, two thirds are eliminated at the first step (written-academic tests). After the final step, around 10% of the sample who took the cognitive-ability tests are selected for training. As the samples of pilot trainees were small, we collected data of three selection sessions. Two studies were conducted:
The main methodology was approximately analogous for the three sessions and their commonalities are now described.
The three samples of the individual difference study consisted of the applicants who were taking the yearly examination for admission to the ENAC pilot training, all young adults and mostly males. The external validity study was conducted on the cumulated three small samples of pilot trainees recruited after the whole selection process.
Given the interesting results on MCPL individual differences with mixed-cues tasks (Chasseigne et al., 2004; Lafon et al., 2004; Rolison, Evans, Dennis, & Walsh, 2012; Rolison, Evans, Walsh, et al., 2011) we chose to use a combination of positive and negative cue-criterion relationships. Moreover, as linear relationships are easier to learn than non linear ones (Brehmer & Qvanstrom, 1976), given our objective of detecting poor MCPL performances, we chose to use linear cue-criterion relationships. Indeed, a difficulty detected on an easy task is potentially more meaningful than on a difficult task. For the same reason we chose to use uncorrelated cues, as cue redundancy usually impaired MCPL performance (Karelaia & Hogarth, 2008), even though in real piloting settings, many cues are inter-correlated and redundant.
The MCPL task was inserted at the end of the cognitive-ability testing step, but MCPL results were not taken into account for the selection decision (the applicants were not informed of this). As the selection process itself was being renewed at that time, the cognitive ability tests differed widely across sessions. They will be detailed in the methodological section of each study and in appendices A, B and C.
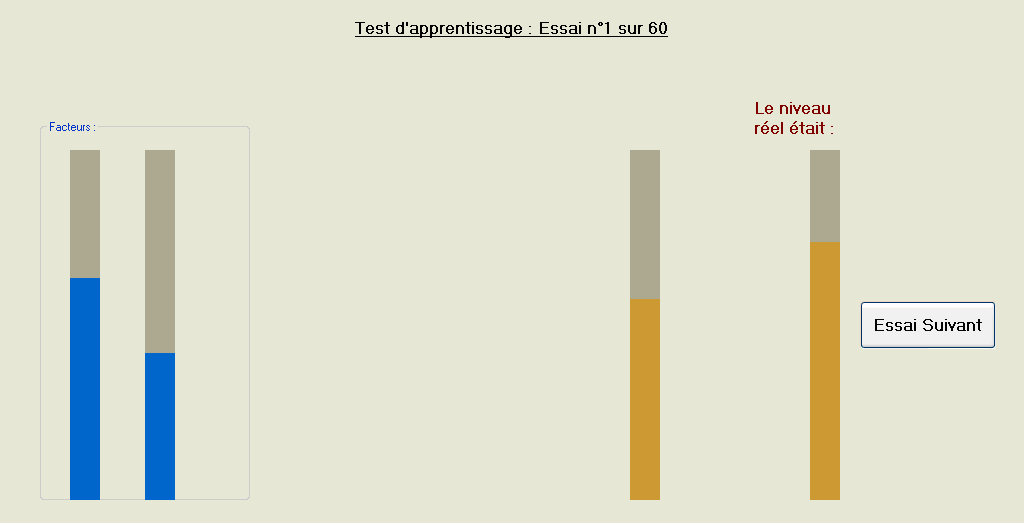
The MCPL tasks consisted of 60 trials within a specific time frame. A progress bar representing remaining time was shown at the bottom of the screen, which certainly induced time pressure. On each trial, the cues were presented as vertical bars of continuously varying height (up to 350 pixels) on a 15" CRT computer screen with a 1024× 768 resolution. Participants provided their prediction by setting the height of a response-bar using the mouse. After clicking on a validation button, they received the outcome feedback through a fourth bar (see Figure 1). MCPL stimuli were constructed from a linear regression in the form y=cue1−cue2+e, with e an error term from a standard normal distribution. Cues and outcome feedback values were then transformed to vary from 0 to 350 pixels. The first five trials were used for familiarization. Importantly, all participants were instructed that perfect performance was almost impossible to attain, due to some random factors.
Following Brunswik, achievement (noted ra after Hursch, Hammond, & Hursch, 1964) denotes the correlation between a participant’s responses and the corresponding criteria. In order to assess the ability to learn the probabilistic relationship we focused on the MCPL final performance, but also on the initial performance in order to have a reference point. Individual initial and final performances were summarized through two correlations: ra1, the achievement of the first 20 trials1 and raLast, the achievement of the 20 last trials treated by the applicant. As the five first trials were familiarization trials, ra1 ranged from trials #6 to #25. Given that all applicants did not complete the 60 trials within the time-limit, the 20 last trials could differ from one individual to another. Nevertheless, for each applicant raLast corresponded to the achievement level reached after benefitting from the maximum amount of learning time.
To assess the discriminant validity of MCPL performance, we computed correlations between MCPL performance and cognitive ability tests scores. As the batteries of cognitive ability tests differed across selection sessions, we computed the standardized sums of z-scores of all cognitive ability tests per session, which we denoted Zcog.
MCPL individual differences were studied using three selection sessions.
Session 1 was conducted during the 2006 pilot selection.
At the selection stage, 556 applicants took the MCPL task, all aged between 18 and 31 years old (M=21.0, sd=2.48) and 91.2% male. Forty four pilot students (90.9% male, Mage=20.6) were admitted after the selection process.
The cue-criterion multiple correlation was high (Re=.96). Cues were linearly related and individual ecological validities were positive, .63 and negative, -.72. The cue inter-correlation was <.01. The whole task was limited to 10 minutes. The average number of trials completed was 58.3 (sd=5.1).
Six cognitive ability tests were administered before the MCPL task: A spatial ability test, a mechanical comprehension test, a perceptual speed test, a numerical ability test, a reasoning test and a divided attention test (see Appendix A for more details).
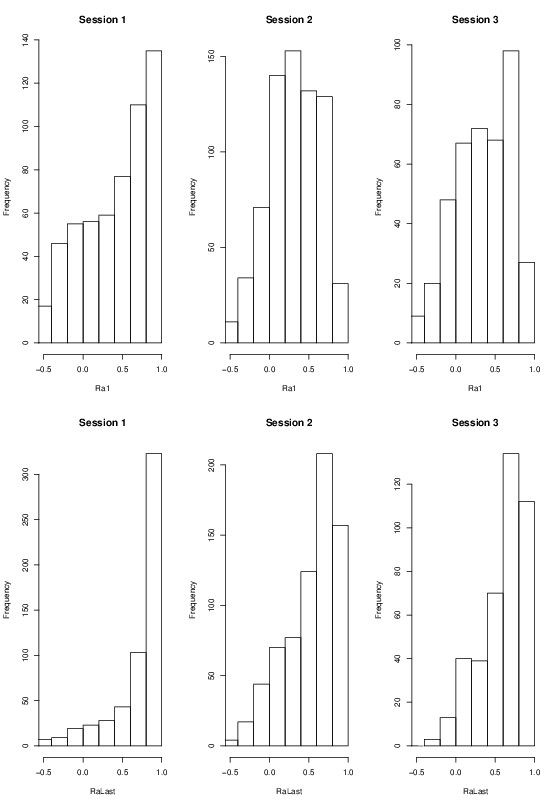
Large individual differences on initial and final performances were observed among applicants (see Figure 2). On the whole, applicants did learn the cue-criterion relationship (see Table 1) as they started at a mean initial correlation of ra1=.42 and ended at a significantly higher mean final correlation of raLast=.73 (p<.001). Final performance was significantly related to the number of trials completed within the time limit (r(554)=.26, p<.001). Total time spent after the five familiarization trials varied from 3.1 to 9.5 min (M=6.9, sd=1.4). Interestingly, the majority of applicants had high final performances, thus poor final performances were rare in this population.
Session 1 showed that substantive differences in the learning of a non-deterministic relationship between cues and criteria could be observed among pilot candidates, even with a small amount of noise in the relationship that had to be learnt (Re=.96). Large individual differences in the learning profiles were identified, differing by initial and final performance. Study 2 aimed at replicating the differences in MCPL performances during the 2007 examination. Indeed, applicants of this selection process are known to be well informed of the tests used at the preceding selection session (through Internet forums for example). Therefore it was necessary to change the relationship to be learnt in the MCPL task. We chose to increase the difficulty by adding an irrelevant cue as a new cue.
At the selection stage, 701 applicants took the MCPL task, all aged between 18 and 31 years old (M=20.7, sd=2.24) and 88.4% male. Sixty pilot students (86.7% male, Mage=20.4) were admitted after the selection process (see Appendix B for more details).
Three cues were used. The multiple cue-criterion correlation was similar to that of Study 1 (i.e., Re=.96). Individual cue-criterion correlations were positive (rP=.74), negative (rN=−.70), and almost null (rI=.09, I for “Irrelevant”). Cue inter-correlations were nonsignificant. Participants had 15 minutes to complete the task. The average number of trials completed was close to that of Session 1 (M=58.6, sd=4.6).
Ten cognitive ability tests were administered before the MCPL task: Two spatial ability tests, two mechanical comprehension tests, two perceptual speed tests, one numerical ability test, one reasoning test, one verbal ability test and a divided attention test (see Appendix B for more details).
As in Study 1, large individual differences on initial and final performances were observed among applicants (see Figure 2). On the whole, applicants did learn the cue-criterion relationship (see Table 1) as they started at a mean initial correlation of ra1=.31 and ended at a significantly higher mean final correlation of raLast=.52 (p<.001). Final performance was again significantly related to the number of trials completed within the time limit (r(699)=.21, p<.001). Total time spent after the five familiarization trials was significantly longer than in Session 1 (M=10.0, sd=2.5, min=3.0 and max=14.1, t(1255)=26.3, p<.001)), which was predictable given the increase of available time. Initial and final performances were lower than in Session 1, so the addition of an irrelevant cue increased the task difficulty, although the available time was increased (from 10 to 15 min). As in Session 1, the majority of applicants had high final performances, thus the poor final performances were rare in this population too.
Session 3 was conducted during the 2010 examination. We chose to use exactly the same task as in Session 2, i.e., with low uncertainty and three mixed cues. As a result, we could cumulate data of these three sessions for the external validity study.
At the selection stage, 412 applicants took the MCPL task, all aged between 18 and 30 years old (M=21.5, sd=2.71) and 91.7% male. Twenty eight pilot students (92.9% male, Mage=20.3) were admitted after the selection process.
The task was strictly identical to that of Study 2: Three cues, high multiple cue-criterion correlation (Re=.95) and individual cue-criterion correlations were positive (rP=.74), negative (rN=−.69), and almost null (rI=.08). Cue inter-correlations were nonsignificant. Participants had 15 minutes to complete the task. The average number of trials completed was close to that of Session 2 (M=59.4, sd=3.9).
Fourteen cognitive ability tests were administered before the MCPL task: Two spatial ability tests, one mechanical comprehension test, two perceptual speed tests, two numerical ability tests, three reasoning tests, three verbal ability tests and one multitasking test (see Appendix C for more details).
The results replicated those of Session 2, as mean initial and final performances reached similar levels (see Table 1). Again, large individual differences among initial and final performances were observed and poor final performances were rare (see Figure 2). Final performance was again significantly related to the number of trials completed within the time limit (r(410)=.13, p<.01). However, total time spent after the five familiarization trials was significantly lower than in Session 2 (M=7.6, sd=2.8, min=2.8 and max=14.1, t(1111)=15.1, p<.001)).
We combined pilot training data for the three pilot student groups (n=44, n=60 and n=28), so the sample consisted of N=132 pilot students (87.8% male, Mage=20.5 and sdage=1.2). All of them came from scientific preparatory classes for competitive admission to elite universities. Among them, 30.0% had experienced difficulties during practical pilot training leading to complementary flying hours and/or exclusion from the training.
Firstly, to get a picture of the nature of the relationship between MCPL performance and pilot training outcome, we applied a method described by Hosmer and Lemeshow (2000). It consisted in creating intervals for the MCPL performance and computing the frequency of occurrence of pilot training difficulties within each group. We chose to use quartiles, so each group size was sufficient to compute representative frequencies (n=33). Thus, we created four MCPL performance categories labeled “poor”, “medium”, “high” and “very high”. As the tasks used in the three selection sessions were equivalent in level of global uncertainty (Re=.96), we combined MCPL performance and pilot training data of the three classes.
Secondly, we investigated the potential role of individual differences in cognitive ability test scores in the association between MCPL performance and pilot training difficulty. We computed the standardized sums of z-scores of cognitive ability tests, Zcog, for each session and corresponding Cronbach’s alpha. The association between the performance on the cognitive ability tests and the MCPL performance was assessed through the correlation between the Zcog aggregated across the three sessions and the Fisher transformed ra1 and raLast of all applicants. Then, we asked whether Zcog could have moderating effects on the association between MCPL and pilot training difficulty by deriving partial contingency tables at various levels of Zcog. Given the small sample size, we categorized Zcog in two subgroups by a median split and derived the partial contingency tables (e.g., see Agresti, 2002, p. 47–54 for the methodology of partial association). Zcog score was also added as a predictor in logistic regressions of pilot training outcome on MCPL performance to assess the potential confounding effect of individual differences in Zcog scores on the relationship between the two variables. Four models of logistic regression were fitted to the data. Model M1 used raw raLast, i.e., the fine grained variability of MCPL final performances. In Model M2 we used simplified predictor data, corresponding to the four categories of MCPL final performance defined by the mean of each quartile. Model M3 tested the significance of MCPL initial performance categorized in quartiles in the same way. M4 tested the significance of final MCPL performance and Zcog both categorized in quartiles.
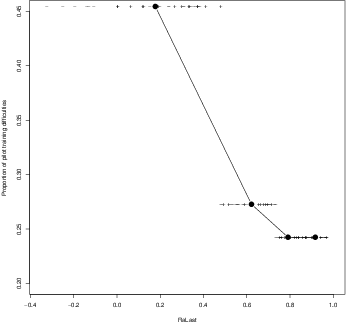
Descriptive statistics of MCPL performance for the sample of pilot students showed large individual differences in initial and final MCPL performance (see Table 2). Final MCPL performance and the frequency of pilot training difficulty were associated (see Figure 3 and Table 3). Indeed, the highest rate of difficulty during training was observed for the group of poorest MCPL final performances. Moreover, the training difficulty rate was non significantly different for medium, high and very high MCPL final performances (27%, n=33 vs. 24%, n=33, p=.78). The pattern suggested a cutoff around raLast=.50. If applied (see Table 4), this cutoff would lead to a significant difference between training difficulty rates for the two subgroups of poor vs. good MCPL performers (44% below cutoff, n=33 vs. 25% above cutoff, n=99, p=.03). On the other hand, there was no evidence of an association between MCPL initial performance and training outcome. Indeed, after applying the same cutoff (ra1=.50), the difficulty rate was not significantly different for the two subgroups (31% below cutoff, n=72 vs. 31% above cutoff, n=60, ns).
Table 3: Frequency Table of Pilot Training Difficulty Rate by MCPL Performance Group.
Label n range(raLast) M(raLast) Difficulty rate Poor 33 [–.32; .48] .18 .45 Medium 33 [.48; .73] .62 .27 High 33 [.73; .84] .79 .24 Very high 33 [.84; .97] .92 .24
Table 4: Frequency Contingency Tables of Pilot Training Difficulty Rate by MCPL dichotomized Performance Group.
Training outcome MCPL perf. Success Difficulty Difficulty rate Poor final 20 16 .44 Good final 72 24 .25 Poor initial 50 22 .31 Good initial 42 18 .30 Note. MCPL final and initial performance has been dichotomized in poor vs. good following the cutoff of raLast=.50 and ra1=.50 respectively.
Table 5: Partial Contingency Tables of Pilot Training Difficulty Rate by MCPL Performance Group at two levels of general cognitive ability (measured by Zcog).
Training outcome Zcog MCPL Success Difficulty Difficulty rate High cog Poor 11 8 .42 Good 36 11 .23 Low cog Poor 9 8 .47 Good 36 13 .26 Note. MCPL performance has been dichotomized in poor vs. good following the cutoff of raLast=.50.
Table 6: Logistic Regression of MCPL Performance on Pilot Training Difficulty, including Scores on Cognitive Ability Tests as a Predictor.
Model Variable Estimate SE z p M1 raw raLast –0.80 0.61 –1.31 .19 Zcog –0.34 0.35 –0.98 .33 M2 cat raLast –1.41 0.67 –2.11 .03* Zcog –0.37 0.35 –1.04 .30 M3 cat ra1 –0.49 0.60 –0.82 .41 Zcog –0.34 0.35 –0.96 .33 M4 cat raLast –1.40 0.67 –2.09 .04* cat Zcog –0.32 0.38 –0.86 .39 Note. Pilot training outcome was coded 1 for Difficult and 0 for Success. Model M1 used raw MCPL final performance, M2 used MCPL final performance categorized in quartiles (replaced by the mean value of each group), M3 used MCPL initial performance categorized in quartiles and M4 used MCPL final performance and Zcog categorized in quartiles (replaced by the mean value of each group). *: significant at 5%. Sample size N=132.
Cronbach’s alpha of Zcog were acceptable for the three applicant groups (.78, .75 and .83, respectively), revealing acceptable internal consistency of this measurement. The correlation between the Fisher transformed initial and final MCPL performances and the standardized sums of the cognitive ability tests scores on the whole applicant data was low, although significant (at p<.001), r(1667)=.15 for ra1 and r(1667)=.16 for raLast. Therefore the differences in cognitive ability tests could account for only 2.2% of the differences of MCPL performances, highlighting discriminant validity of MCPL performance against the actual batteries of tests used. Thus, MCPL performance was not redundant over Zcog.
One might ask whether Zcog has a moderating effect on the association between MCPL and pilot training difficulty. Thus, we produced the two partial contingency tables for the subgroups of “high” vs. “low” cognitive ability and for two categories of MCPL performance using the cutoff of raLast=.50 (see Table 5). The global odds ratio was θ=2.40, and conditional odds ratio of both categories of Zcog were similar (θHighCog=2.38 and θLowCog=2.46). So, the odds of pilot training difficulty for those who performed poorly on the MCPL task were 2.4 times the odds for those performing good, regardless of their performance at cognitive ability tests.
The results of logistic regressions confirmed the significance of MCPL final performance on pilot training outcome (see Table 6). Indeed, while controlling for differences in Zcog, MCPL final performance categorized by quartiles was a statistically significant predictor of pilot training outcome (with p=.03). On the other hand, MCPL initial performance, categorized by quartiles, was not a significant predictor of pilot training outcome. Furthermore, MCPL raw final performance was not a significant predictor of pilot training (probably due to the lack of power resulting from the use of the fine grained continuous raLast variable). Moreover, differences in Zcog were not predictive of pilot training difficulty neither with the full scale nor categorized by quartiles. This is not surprising as pilot students were selected on the basis of Zcog, so we did not expect differences in Zcog to be highly predictive of pilot training outcome.
The poor predictive power of MCPL initial performance compared to final performance suggested that the predictive value of the final MCPL performance could be attributed to what had been learnt at the end of task time-limit. More precisely, individual differences in initial performance seemed to result from some random factors (good or bad luck at the first trials). Indeed, among those who started poorly (n=72 with ra1<.50), more than half (58%) ended at raLast≥.50, 80% of which succeeded the pilot training.
The present studies were conducted in the context of airline pilot selection and training. The data were obtained from three selection sessions and the three corresponding selected pilot students classes. Initially, Multiple Cue Probability Learning (MCPL) performance was assessed at the time of selection. Then, pilot training outcome (success/difficulty) was collected after a three-year follow-up. All MCPL tasks used a mix of positive and negative cues, and for two of them, an irrelevant cue. The results showed large individual differences in initial and final MCPL performances, with a majority of applicants achieving high levels of performance. The level of MCPL final performance could be related to the outcome of airline pilot training. The frequency of training difficulties (i.e., additional flying hours and/or exclusion from the training) was highest for the group of poor MCPL performers compared to medium/high/very high MCPL performers. Poor MCPL performance was associated with a final achievement inferior to ra=.50. Moreover, poor initial MCPL performance (i.e., at the beginning of the task) could not be significantly related to difficulties during pilot training.
To our knowledge, the relationship between MCPL performance and performance in a real setting of high skilled training had not been assessed before. Despite the significant difference of pilot training success rate for poor vs. good MCPL performers, the relationship between MCPL performance and pilot training outcome was not deterministic. A poor final MCPL performance does not necessarily imply difficulties in pilot training. Indeed, the causes of pilot training difficulties are surely complex. Moreover, as pointed out by Klayman (1984), probability learning tasks could fail to capture some important features of learning in natural environments, such as the discovery of new valid predictive cues, and the incorporation of these new cues into the learner’s predictive model. Thus, we did not expect the training difficulties to be systematically related to difficulties in the MCPL task. Nevertheless poor final MCPL performance was significantly related to a higher proportion of pilot training difficulty. Moreover, initial MCPL performance could not predict pilot training outcome, even though the initial performance was not intended to do so. Indeed, initial MCPL performance corresponded to the trials where participants tested their first hypotheses. For instance, if participants thought first of positive cue-criterion relationships (as is often the case, Brehmer, 1977), their poor initial performances would not be symptomatic of cognitive impairment.
What could be the underlying cognitive processes that led the pilot students to have difficulty both in the MCPL task and during the pilot training? A lack of ability to generate different hypotheses (or a too “sparse hypothesis space”, Navarro & Perfors, 2011) or the perseveration in a wrong hypothesis (e.g., Dunbar & Sussman, 1995). Unfavorable personality characteristics could also be invoked. Perhaps MCPL tasks assess the degree of ambiguity tolerance in a behavioral way. Unfortunately, no ambiguity tolerance test was present in the battery of tests at the selection stage. Another interpretation could be that the experimental conditions of the high stake selection setting overloaded the executive functions of the poor MCPL learners, thus preventing them from functioning efficiently in a controlled mode (e.g., Keinan, Friedland, Kahneman, & Roth, 1999). Stressors are known to promote the use of simple strategies, even in individuals accustomed to using complex solutions (Van Hiel & Mervielde, 2007). Thus, we could explain learning failures by a disruption of executive processing due to an emotional reaction linked to a high-stakes and stressful examination. In a dual-process perspective, Rolison, Evans, Dennis, et al. (2012) suggested that learning about positive cues would involve automatic processes whereas learning about negative cues would involve controlled processes. From that view point, an interpretation of our results could be that poor MCPL performers would have difficulty in getting involved in controlled processes in stressful situations. Similarly, such difficulty could occur in real-life flight situations.
Consistent with previous findings from the literature, we found large individual differences in MCPL performance. Nevertheless, we could have expected better final performances. For instance with a similar MCPL task, young adults (n=98, aged from 18 to 25) were all able to learn a two-cue mixed probability learning task (Chasseigne et al., 2004). Lafon et al. (2004) showed that children of 5 to 10 years old had difficulty in learning the negative relationship and that only the young adults (aged from 17 to 27) learned efficiently how to use the negative cue correctly. It is noteworthy that, in these two studies, participants had 150 trials and no time limit (between 30 and 40 min to complete the task). In our studies, time was limited (10 or 15 min), which induced some time pressure and could explain the non optimal final performance. Therefore, our MCPL performances are more likely to reflect a rate of learning in uncertainty, than an ability to deal with uncertainty. Moreover, results of Lafon et al. (2004) and Chasseigne et al. (2004), showed some improvement after 60 trials (2 first blocks). For these authors, the presence of the negative cue and the coordination of the two cue values involved greater demands on the executive control, thus providing an interpretation for the poor performances of both very young or very old participants. This hypothesis is also consistent with the findings of Rolison, Evans, Walsh, et al. (2011), who found that working memory capacity was correlated with performance on MCPL tasks containing negative cues.
As noted by Weaver and Stewart (2012) “despite over 300 studies of MCPL (Holzworth, 1999), MCPL has not been connected to the intelligence or learning literature” (p. 403). Weaver and Stewart (2012) found a correlation (r(98)=.29, p<.01) between scores of an inductive reasoning test and performance on a three-mixed-cue MCPL task with low uncertainty (Re=.9). Overall correlation with a composite score of other cognitive ability tests in our studies was also significant but smaller (r(1667)=.16, p<.001). The larger sample size of our studies would tend to make us cautious regarding the medium correlation obtained by Weaver and Stewart (2012). Nevertheless, the correlation we found is positive, indicating that some part of the variance observed in MCPL performance may be attributed to what is usually called general cognitive ability.
The practical implication of the present finding in a selection setting is quite straightforward. MCPL tasks in a selection setting could be useful to detect applicants with difficulty learning in uncertainty. However, the MCPL tasks used in the present studies involved perceptual skills (as cues, response and outcome feedback were represented through colored bars), and the question remains open how as to generalize to learning uncertainty in tasks involving cognitive skills.
The practical implications can range between two extremes. At one extreme, poor MCPL performance could alert the selection practitioners and incite them to further investigate those applicants’ ability to deal with uncertainty (during the interviews for example). At the other extreme, the selection organization could eliminate poor MCPL performers. From a purely organizational point of view, the minimization of the training difficulty risk would justify this decision despite of unavoidable wrong eliminations.
It is unclear whether MCPL tasks could help diagnose complex learning deficiencies or if an individual MCPL profile could be useful for an instructor to adapt his training method to the student. These questions are now opened by this research.
Agresti, A. (2002). Categorical data analysis. Hoboken, NJ:John Wiley & Sons.
Balzer, W. K., Doherty, M. E., & O’Connor, R. (1989). Effects of cognitive feedback on performance. Psychological Bulletin, 106, 410–433.
Brehmer, B. (1977). Learning complex rules in probabilistic inference tasks: iii. the effect of cue validity (tech. rep. No. 117).
Brehmer, B. (1980). In one word: not from experience. Acta Psychologica, 45, 233–241.
Brehmer, B., & Qvanstrom, G. (1976). Information integration and subjective weights in multiple-cue judgments. Organizational Behavior and Human Decision Processes, 17, 118–126.
Brunswik, E. (1955). Representative design and probabilistic theory in a functional psychology. Psychological Review, 62, 193–217.
Brunswik, E. (1956). Perception and the representative design of psychological experiments. Berkeley: University of California Press.
Burke, E. F., Hobson, C., & Linsky, C. (1997). Large sample validations of three general predictors of pilot training success. International Journal of Aviation Psychology, 7, 225–234.
Carretta, T. R. (2011). Pilot candidate selection method: still an effective predictor of us air force pilot training performance. Aviation Psychology and Applied Human Factors, 1, 3–8.
Carretta, T. R., & Ree, M. J. (1994). Pilot-candidate selection method: sources of validity. International Journal of Aviation Psychology, 4, 103–117.
Carretta, T. R., & Ree, M. J. (2003). Pilot selection methods. In P. S. Tsang & M. A. Vidulich (Eds.), Principles and practice of aviation psychology (pp. 357–396). Mahwah, NJ: Lawrence Erlbaum Associates.
Carretta, T. R., Retzlaff, D., Paul, Callister, J. D., & King, R. E. (1998). A comparison of two U.S. Air force pilot aptitude tests. Aviation, Space, and Environment Medicine, 69, 931–935.
Chasseigne, G., Ligneau, C., Grau, S., Le Gall, A., Roque, M.,&Mullet, E. (2004). Aging and probabilistic learning in single- and multiple-cue tasks. Experimental Aging Research, 30, 23–45.
Damos, D. L. (1993). Using meta-analysis to compare the predictive validity of single- and multiple-task measures to flight performance. Human Factors, 35, 615– 628.
Dunbar, K., & Sussman, D. (1995). Toward a cognitive account of frontal lobe function: simulating frontal lobe deficits in normal subjects. In Structure and functions of the human prefrontal cortex (pp. 289–304). New York Academy of Sciences.
Gillis, J. S. (1969). Schizophrenic thinking in a probabilistic situation. Psychological Record, 19, 211–224.
Gillis, J. S., & Davis, K. E. (1973). The effects of psychoactive drugs on complex thinking in paranoid and non paranoid schizophrenics: an application of the multiple-cue model to the study of disordered thinking. In L. Rappoport & D. A. Summers (Eds.), Human judgment and social interaction (pp. 170–184). New York, USA: Rinehart and Winston, Inc.
Gluck, M. A., Shohamy, D., & Myers, C. E. (2002). How do people solve the "weather prediction" task?: individual variability in strategies for probabilistic category learning. Learning and Memory, 9, 408–418.
Goeters, K.-M., Maschke, P., & Eissfeld, H. (2004). Ability requirements in core aviation professions: job analyses of airline pilots and air traffic controllers. In K.-M. Goeters (Ed.), Aviation psychology: practice and research. Hampshire: Ashgate.
Hammond, K. R., & Stewart, T. R. (Eds.). (2001). The essential brunswik: beginnings, explications, applications. Cary, NC: Oxford University Press.
Hammond, K. R., & Summers, D. A. (1965). Cognitive dependence on linear and non-linear cues. Psychological Review, 72, 215–224.
Harvey, N. (2011). Learning judgment and decision making from feedback. In M. K. Dhami, A. Schlottmann & M. Waldmann (Eds.), Judgment and decision making as a skill: learning, development, and evolution (pp. 406– 464). Cambridge: Cambridge University Press.
Hogarth, R. M., & Karelaia, N. (2007). Heuristic and linear models of judgment: matching rules and environments. Psychological Review, 114, 733–758.
Holzworth, R. J. (1999). Annotated bibliography of cue probability learning studies (http://www.albany.edu/cpr/brunswik/resources/mcplbib.doc). Department of Psychology, University of Connecticut.
Hosmer, D. W., & Lemeshow, S. (2000). Applied logistic regression (Second edition). Wiley.
Hunter, D. R., & Burke, E. F. (1994). Predicting aircraft pilot- training success: a meta-analysis of published research. International Journal of Aviation Psychology, 4, 297–313.
Hursch, C. J., Hammond, K. R., & Hursch, J. L. (1964). Some methodological considerations in multiple-cue probability studies. Psychological Review, 71, 42–60.
Karelaia, N., & Hogarth, R. M. (2008). Determinants of linear judgment: a meta-analysis of lens model studies. Psychological Bulletin, 134, 404–426.
Keinan, G., Friedland, N., Kahneman, D., & Roth, D. (1999). The effect of stress on the suppression of erroneous competing responses. Anxiety, stress, and coping, 12, 455–476.
Klayman, J. (1984). Learning from feedback in probabilistic environments. Acta Psychologica, 56, 81–92.
Lafon, P., Chasseigne, G., & Mullet, E. (2004). Functional learning among children, adolescents and young adults. Journal of Experimental Child Psychology, 88, 334–347.
Lindberg, L. A., & Brehmer, B. (1977). Effects of task information and active feedback control in inductive inference (tech. rep. No. 123).
Martinussen, M. (1996). Psychological measures as predictors of pilot performance: a meta-analysis. International Journal of Aviation Psychology, 6, 1–20.
Martinussen, M., & Torjussen, T. (1998). Pilot selection in the norwegian air force: a validation and meta-analysis of the test battery. International Journal of Aviation Psychology, 8, 33–45.
Matton, N. (2008). Approches psychométrique et cognitive des différences individuelles d’aptitudes: application à la sélection des pilotes de ligne. (Doctoral dissertation, University of Toulouse).
Meeter, M., Myers, C. E., Shohamy, D., Hopkins, R. O., & Gluck, M. A. (2006). Strategies in probabilistic categorization: results from a new way of analyzing performance. Learning and Memory, 13, 230–239.
Navarro, D. J., & Perfors, A. F. (2011). Hypothesis generation, sparse categories, and the positive test strategy. Psychological Review, 118, 120–134.
Newell, B. R., Weston, N. J., Tunney, R. J., & Shanks, D. R. (2009). The effectiveness of feedback in multiple-cue probability learning. Quarterly Journal of Experimental Psychology, 62, 890–908.
Olea, M. M., & Ree, M. J. (1994). Predicting pilot and navigator criteria: not much more than g. Journal of Applied Psychology, 79, 845–851.
Park, K. S., & Lee, S. W. (1992). A computer-aided aptitude test for predicting flight performance of trainees. Human Factors, 34, 189–204.
Peterson, C., & Ulehla, Z. J. (1964). Uncertainty, inference difficulty, and probability learning. Journal of Experimental Psychology, 67, 523–530.
Post, P. D. (1978). The cognitive functioning of depressives in a multiple-cue, probabilistic task. (Doctoral dissertation, ProQuest Information and Learning).
Ree, M. J., & Carretta, T. R. (1996). Central role of g in military pilot selection. International Journal of Aviation Psychology, 6, 111–123.
Rolison, J. J., Evans, J. S. B. T., Dennis, I., & Walsh, C. R. (2012). Dual-processes in learning and judgment: evidence from the multiple-cue probability learning paradigm. Organizational Behavior and Human Decision Processes, 118, 189–202.
Rolison, J. J., Evans, J. S. B. T., Walsh, C. R., & Dennis, I. (2011). The role of working memory capacity in multiple-cue probability learning. The Quarterly Journal of Experimental Psychology, 64, 1494–1514.
Ruble, T. L., & Cosier, R. A. (1990). Effects of cognitive styles and decision setting on performance. Organizational Behavior and Human Decision Processes, 46, 283–295.
Schmidt, F. L., & Hunter, J. E. (1998). The validity and utility of selection methods in personnel psychology: practical and theoretical implications of 85 years of research findings. Psychological Bulletin, 124, 262–274.
Smedslund, J. (1955). Multiple-probability learning: an inquiry into the origins of perception. Oslo, Norway: Akademisk forlag.
Speekenbrink, M., & Shanks, D. R. (2010). Learning in a changing environment. Journal of Experimental Psychology: General, 139, 266–298.
Stanovich, K. E. (2009). What intelligence tests miss: the psychology of rational thought. New Haven, CT US: Yale University Press.
Stauffer, J., & Ree, M. J. (1996). Predicting with logistic or linear regression: will it make a difference in who is selected for pilot training? International Journal of Aviation Psychology, 6, 233–241.
Van Hiel, A., & Mervielde, I. (2007). The search for complex problem-solving strategies in the presence of stressors. Human Factors, 49, 1072–1082.
Weaver, E. A., & Stewart, T. R. (2012). Dimensions of judgment: factor analysis of individual differences. Journal of Behavioral Decision Making, 25, 402–413.
Winters, E. P. (1970). Person perception in multiple-cue probability learning task as a function of cognitive complexity and inferential set. Dissertation Abstracts International, 30(12-B), 5681.
Correlations between test scores and MCPL initial and final
performances (after Fisher transformation).
| Session 1 | Session 2 | Session 3 | ||||
| ra1f | raLastf | ra1f | raLastf | ra1f | raLastf | |
| A1 | .09^* | .07 | ||||
| A1b | .03 | .00 | ||||
| A2 | -.06 | -.04 | ||||
| A3 | .04 | .00 | ||||
| A4 | .13^** | .01 | ||||
| M1 | .08 | .14^*** | .13^*** | .10^** | ||
| M2 | .05 | .09^** | .14^** | .12^** | ||
| N1 | .07 | .12^** | .09^** | .09^** | .22^*** | .14^** |
| N2 | .22^*** | .17^*** | ||||
| R1 | .13^** | .19^*** | ||||
| R2 | .03 | .10^** | .16^*** | .10^* | ||
| R3 | .21^*** | .13^** | ||||
| R4 | .13^** | .11^* | ||||
| S1 | .11^** | .17^*** | .09^** | .10^** | ||
| S2 | .07 | .10^** | .18^*** | .12^** | ||
| S3 | .14^** | .17^*** | ||||
| V1 | .05 | .09^** | ||||
| V1b | .11^* | .06 | ||||
| V2 | .15^** | .09 | ||||
| V3 | .12^* | .09 | ||||
| TAD | .14^*** | .13^*** | -.02 | -.01 | ||
| TGP | .21^*** | .18^*** | ||||
| Note. *: significant at 5%. **: significant at 1%. ***: significant at 0.1%. Sample sizes are N=556, N=701 and N=412. | ||||||
This document was translated from LATEX by HEVEA.