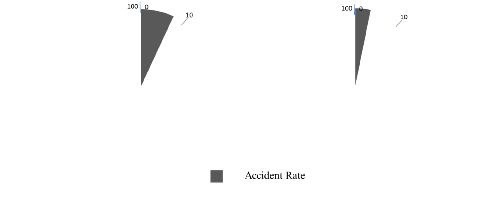
| Figure 1: Different graphic formats used in Stone et al. (2003). |
Judgment and Decision Making, Vol. 9, No. 1, January 2014, pp. 83-89
Foreground-background salience effect in traffic risk communicationTian-Yi Hu* # Xin-Wen Jiang# Xiaofei Xie% Xiao-Qin Ma% Chao Xu% |
Pie charts are often used to communicate risk, such as the risk of driving. In the foreground-background salience effect (FBSE), foreground (probability of bad event) has greater salience than background (no bad event) in such a chart. Experiment 1 confirmed that the displays format of pie charts showed a typical FBSE. Experiment 2 showed that the FBSE resulted from a difference in cognitive efforts in processing the messages and that a foreground-emphasizing display was easier to process. Experiment 3 manipulated subjects’ information processing mindset and explored the interaction between displays format and information processing mindset. In the default mindset, careless subjects displayed a typical FBSE, while those who were instructed to be careful reported similar risk-avoidant behavior preference reading both charts. Suggestions for improving risk communication are discussed.
Keywords: foreground-background salience effect, information processing, traffic risk.
Personal risk perception is sometimes a prerequisite for behavior change (Schwarzer, 2001) and a catalyst of prevention behavior (Floyd, Prentice-Dunn, & Rogers, 2000; Milne, Sheeran, & Orbell, 2000; Sheeran, Harris, & Epton, in press). Thus it is useful to understand people’s reactions to risk information. The foreground-background salience effect (FBSE, Stone, Sieck, Bull, Yates, Parks, & Rush, 2003) may help to explain how people perceive risk under various presentation formats and thus to improve low-probability risk communication. The current study further explored this effect on pie charts. We tried to find better displays formats for effective risk communication about traffic.
Display formats of risk information vary in communication effects. Graphic format is usually regarded as good assistance for people to understand risk information (e.g., Garcia-Retamero & Galesic, 2010). Gamliel and Kreiner (2013) found that a visual display served as complementary information for sufficient understanding. Stone et al. (2003) defined a foreground-background salience effect (FBSE) in risk comparison. Risk communication messages usually involve two risks (corresponding to two choices) in the form of ratios, such as x out of y people are harmed (x/y). The total amount of people at risk of harm (y) will be referred as “background”, and the number of people being harmed (x) will be referred as “foreground”. Many graphic formats usually highlight only the foreground information of the two choices, for example a decrease of victims from 30 to 15 (out of a population of 1000). People would likely perceive a more significant risk reduction compared with a numeric format, when foreground information and background information were equally represented. In Stone et al. (2003)’s study, when graphic formats were used to equally present both foreground and background information, graphic formats no longer increased risk-avoidant behavior. Figure 1 shows an example of different graphic formats used in Stone et al. (2003).
Figure 1: Different graphic formats used in Stone et al. (2003).
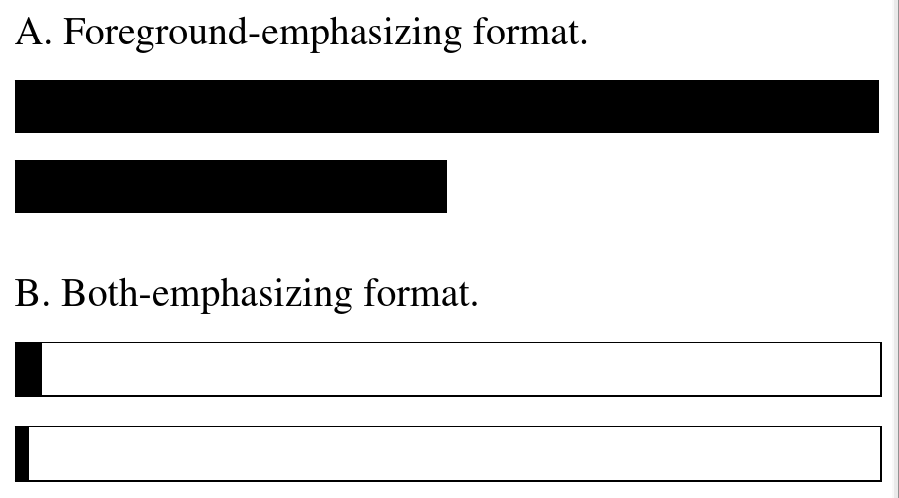
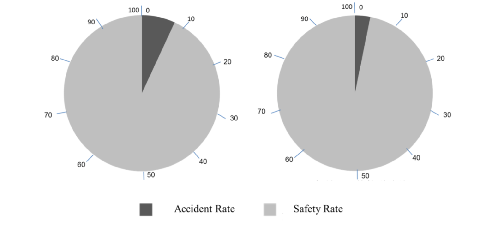
Pie charts are regarded as a common form of risk communication and can be seen in varied public media and promotion materials. Stone et al. (2003) observed that the graphical foreground information in the foreground-emphasizing condition and the both-emphasizing condition were of the same size for pie charts. And thus the researchers argued that it is not appropriate to use pie chart as materials in discussing the FBSE and did not directly test the FBSE in pie charts. However, we argued that the change of foreground size only contributed partly to foreground-background salience. The existence of the background could also affect the relative salience of the foreground information and the total contrast of the foreground versus background information. As a result, pie chart could be used to further explore the FBSE. Moreover, a pie chart is a good choice to control the absolute size of the foreground information and manipulate the relative salience of the foreground versus background information. Figure 2 shows an example of different pie chart displays.
A. Foreground-emphasizing format
Figure 2: Different pie chart displays.
B. Both-emphasizing format
People’s perceptions and evaluations are easily distorted by the presentation of the information. Burson, Larrick, and Lynch (2009) reported an effect that the ratio scales used to present the attributes of two options altered people’s subjective perception of the option difference (e.g., 20-point difference in a 100-point scale versus 1-point difference in a 5-point scale) and resulted in preference reversals. Sun, Li, and Bonini (2010) manipulated the scale in graphs to change the relative distance of the options on a particular attribution. They found that such attribute salience difference in graphical representations changed people’s evaluation of the options.
Many researchers believe that such perceptual or judgmental biases are mostly due to people’s tendencies to think in automatic ways (e.g., Hastie & Dawes, 2010). Because people usually prefer to use shortcuts in making judgments, they would try to extract the gist of the message they encounter. People usually use simplifying heuristics in making judgments and decisions concerning risk (Lloyd, 2001). For example, Sun, Li, Bonini, and Su (2012) proposed an equate-to-differentiate approach, along with which people focus on the dimensions indicating greater differences among options and eliminate the dimensions with small differences.
With respect to the FBSE in risk comparison, people would get the essence of the risk information as which one is higher and the amount of the rough difference between two risks. Foreground-emphasizing graphical format contains less information, and thus requires less cognitive resource to process and reach the conclusion. In this way, highlighting the foreground information could help people more easily grasp the gist of the information and people would accept the risk reduction more readily. As mentioned before, people usually tend to process the information with automatic thinking, which would easily cause bias. So the manner in which people process the messages would be important in shifting the judgment. A “default” automatic processing of the information would result in an FBSE. Moreover, when people are instructed to process the information in a careful manner, i.e., with enough cognitive efforts concerning both displays formats, such an effect of FBSE would diminished.
Traffic safety is a big problem in modern life (“World Day of Remembrance for Road Traffic Victims”, 2011) and traffic risk communication, as a typical low-probability risk, often seems to fail. Thus we used traffic risk as the main scenario in the current study. We conducted Experiment 1 to explore the FBSE in pie charts. In Experiment 2, we compared the information processing speed of the two displays to reveal the relative salience of the foreground-background information. In Experiment 3 we manipulated the manner in which subjects process the information to uncover the marginal condition of the FBSE.
Experiment 1 asked whether the FBSE exists in pie charts. Although the absolute sizes of the foreground information in pie charts are identical in both the foreground-emphasizing and the both-emphasizing formats, we predicted that the presence of the background information would also affect people’s risk perception, resulting in a typical FBSE. In Stone et al. (2003)’s study, different types of graphs were studied with or without labels. To provide consistent evidence, we studied pie charts both with and without labels. Therefore, we conducted a 2 (displays format: foreground-emphasizing / both-emphasizing) × 2 (with or without labels on the chart) between-subjects experiment. Risk-avoidant behavior preference was measured as a dependent variable.
Subjects were 115 adults (44 males, 70 females, and 1 unknown) recruited in Peking University for cash rewards. They were randomly assigned to one of the four conditions and gender had been balanced among the groups.
We adapted Stone et al. (2003)’s willingness-to-pay paradigm and adjusted the probability figure according to the road accident rate in China. Subjects were invited to the laboratory and completed a questionnaire. They were told to imagine a scenario of driving a long way to work every day. Subjects were asked to decide whether or not to pay some money for a road with less risk. Specifically, there were two road options and the descriptions were as follows. “Road A is free but there is a steep slope on the way. Road B takes a detour and charges 5 RMB per day. The risks of traffic accidents in previous year are shown in the following charts [see Figure 2 for an example]. Except for the accident rate the two roads were almost the same.” After reading the charts, subjects were asked to report risk-avoidant behavior preference. All materials were presented on paper.
Risk-avoidant behavior preference. Subjects were measured on an 11-point question “Which road will you choose between A and B?” from −5 (Choosing Road A) to 5(Choosing Road B). Higher score represented subjects’ preference on a safer choice and risk-avoidant behavior. This measurement was different from the previous willingness-to-pay question, in which subjects were asked to decide how much to pay for a safer choice using a price of a less safe option as an anchor. We made such adaptation considering this changed decision mode was closer to real-life decisions that people choose from two options offered instead of directly giving their own offer for one choice.
Demographic variables. Subjects’ gender, age, monthly expense, driving age and road traffic accident experience were recorded.
We found no significant correlations between risk-avoidant behavior preference and all of the demographic variables. Therefore, no demographic variable was included as a covariate in the following analysis.
Taking risk-avoidant behavior preference as the dependent variable, displays formats and labels as independent variables, ANOVA showed a significant main effect of displays formats (F(1, 111) = 4.16, p = .04, η 2 = .04). Subjects in the foreground-emphasizing format reported more risk-avoidant behavior (M = 4.85, SE = .40) than those in both-emphasizing format (M = 3.68, SE = .41), indicating that displays formats affect risk-avoidant behavior preference. This result revealed a typical FBSE and was consistent with our hypothesis. Results were not significant for label’s main effect, or the formats-label interaction (ps > .10).
In Experiment 1, we found that regardless of whether labels were on the chart or not, the foreground-emphasizing format induced more risk-avoidant behavior preference than the both-emphasizing format. It provided evidence for the FBSE in pie chart and was consistent to our prediction. This result indicated that, although the absolute size difference of the foreground information served as a main account of FBSE found in previous studies, the existence of background information, which influences the relative salience of the foreground information, also resulted in an FBSE. People usually use automatic thinking in processing the information and are thus easily influenced by noise such as the displays formats. A foreground-highlighting display contains less information and thus requires less cognitive effort to process the information. In Experiment 2, we investigated this ease of information-processing through information processing speed.
Compared with the foreground-emphasizing graphical format of risk communication messages, the both-emphasizing format contains more elements, needs more cognitive effort to process, and thus increases the difficulty of extraction of the gist of the message. The difficulty might lead to lower processing speed. In Experiment 2 we adapted a cognitive paradigm and predicted that information processing speed would be higher when subjects are presented with the foreground-emphasizing pie charts compared with both-emphasizing ones.
Table 1: Mean log reaction times (s.d. in parentheses) in 6 pairs of risk probabilities in Experiment 2. N=30 for each group.
Pairs of risk probabilities Foreground-emphasizing Both-emphasizing
Subjects were 60 adults (22 males, 36 females, and 2 unknown) recruited in Peking University for cash rewards. They were randomly assigned to one of the two experiment groups (foreground-emphasizing / both-emphasizing) with gender balanced between the groups.
Materials were presented via E-prime 1.0. The formats were identical to those with labels in Experiment 1. We designed 6 pairs of risk probabilities to examine consistency of the influence: (a) 1.5%, 3.0%; (b) 2.0%, 4.0%; (c) 2.5%, 5.0%; (d) 3.0%, 6.0%; (e) 3.5%, 7.0%; (f) 4.0%, 8.0%. For each trial, one pair of risks was displayed on the screen, either in a foreground-emphasizing format or a both-emphasizing format. Subjects were instructed to press buttons as fast as possible to identify a more risky one from the two pie charts presenting the accident rate of two roads in the previous year. After practice, they completed a 12-trial formal task. Each pair of risk probability appeared twice. The sequence of the trails and the correct sides were counterbalanced across subjects in the computer program. Reaction times and error rates were recorded.
All of the subjects responded correctly in all of trials and thus reaction time was the major dependent variable. We averaged the two reaction times of each subject for each pair of risk comparison, resulting in one reaction time for each pair of risk comparison and 6 reaction times for each subject. Reaction times were then converted to logs and the log RTs in 6 pairs of risk probabilities of the two experimental groups were shown in Table 1.
We conduct a repeated measure analysis with risk probability as a within-subject variable and displays format as a between-subject variable. Results revealed a significant main effect of displays formats (F(1,58) = 7.43, p = .01, η 2 = .11). The subjects presented with the foreground-emphasizing format generally responded more quickly than those presented with the both-emphasizing format. The main effect of risk probability reached significance (F(5, 290) = 3.00, p = .01, η 2 = .05). Bonferroni post-hoc analysis showed that the only significant differences were that the log RT of the (1.5%, 3.0%) pair was higher than that of the (2.5%, 5.0%) pair (p = .01), and that the log RT of the (1.5%, 3.0%) pair was higher than that of the (3.0%, 6.0%) pair (p = .01). There was no significant interaction between displays format and risk probability.1
Consistent to the prediction, people displayed lower reaction time when processing the information presented in the format of foreground-emphasizing graphs compared with both-emphasizing graphs. The results provided evidence that the former display format contained fewer elements and required less cognitive resource to process.
When people are not careful in processing information, the different cognitive effort needed to extract the gist of information between the two displays format can cause the typical FBSE. However, when people process the information in a precise-processing mode, they would carefully examine and remember the information instead of simply getting the essence. In such cases, the typical FBSE caused by a distortion of displays format would diminish. Experiment 3 is designed to test this hypothesis.
In Experiment 3, we explicitly manipulated information-processing mindset (default vs. precise) and explored the interaction between displays formats and mindset. We predicted that with the default careless manner the subjects would respond to the message under the pattern of a typical FBSE, which is similar with the result of Experiment 1. However, with precise processing mindset instructions, such an effect would diminish. Because there was no effect of labels found in Experiment 1, we did not manipulate this variable in Experiment 3. Therefore, a 2 (displays format: foreground-emphasizing/ both-emphasizing) × 2 (processing mindset: default / precise) between-subjects experiment was conducted.
Subjects were 82 adults (28 males and 54 females) recruited in Peking University for cash rewards. They were randomly assigned into 4 groups and gender was balanced among different groups.
Subjects read the scenario on paper. Identically with Experiment 1, they were asked to read pie charts showing risk of traffic accidents in two roads and to make a choice from the two roads. However, instructions were different between the default and precise processing groups. The precise group was asked to “read the probability carefully and remember the exact size of accident rates in both roads.” The default group was merely asked to “compare the accident rates in both roads.” After that, subjects were measured for risk-avoidant behavior preference, as in Experiment 1. Also, demographic variables were recorded, including gender, age, monthly expense, driving age and road traffic accident experience.
At the end of the experiment, subjects were instructed to answer two questions for a manipulation check of mindset priming: which road they viewed had a higher risk for accidents (road comparison), and the risk probabilities of the two roads (road risk) according to their memory.
Figure 3: Formats ×processing mindset interaction in Experiment 3. 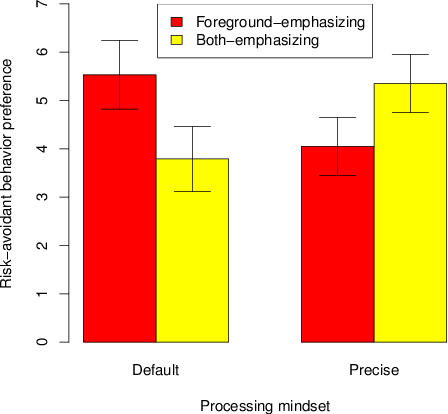
As for the manipulation check, five of the subjects did not correctly answer the road comparison question and one did not answer this question. These six subjects were not included in the following analysis, resulting in a final sample of 76 subjects. Then we computed the absolute values of the differences between the road risks displayed and the road risks the subjects reported. And thus we got two values for each subject’s memory of the road risks, higher value indicating less accuracy. Two-way ANOVA of the two values revealed that the subjects in the default processing group had a significantly less accurate memory of the road risks (road A: F(1,72) = 4.96, p = .03, η 2 = .06; road B: F(1,58) = 5.20, p = .03, η 2 = .07). These results indicated a success in the mindset manipulation.
We found no significant correlations between risk-avoidant behavior preference and any of the demographic variables. Therefore, no demographic variable was included as a covariate in the following analysis.
Taking risk-avoidant behavior preference as the dependent variable, two-way ANOVA revealed a significant interaction between displays format and processing mindset (F(1,72) = 5.55, p = .02, η 2 = .07) (see Figure 3). Simple effect analysis showed that for the subjects using a default processing mindset, a typical FBSE occurred. Specifically, those who read the road accident risk message displayed in foreground-emphasizing format reported higher safe behavior preference (M = 5.53, SD = 3.02) than those read the message in both-emphasizing format (M = 3.79, SD = 2.84). The difference was almost significant (F(1, 34) = 3.17, p = .08, η 2 = .09). For the subjects using a precise processing mindset, the difference between two displays format diminished (p = .14).
Results suggested that information processing mindset moderated the relation between displays formats and risk perception, which supported our hypothesis. With the default careless processing, subjects were more likely to be influenced by the presentation format and displayed a typical FBSE. In contrast, with precise processing, the information was more thoroughly processed and the effect of format diminished. Experiment 3 also offered consistent evidence for the FBSE with pie chart in the default processing mode.
This study aimed to help improve risk communication of low probability risk. Within the context of traffic risk communication, we examined the foreground-background salience effect, using pie charts. In Experiment 1, we designed a traffic risk scenario to confirm the FBSE in pie charts. The foreground-emphasizing format induced more risk-avoidant behavior preference than the both-emphasizing format. Experiment 2 verified that reaction time was significantly lower in the foreground-emphasizing graph than in the both-emphasizing graph. Experiment 3 manipulated subjects’ information processing mindset and explored the interaction between display formats and information processing mindset. We found that precise processing subjects reported similar risk-avoidant behavior preference in response to both charts.
These results lead to some suggestions for altering real-life risk judgment and decision making. One would be that foreground information should be salient, for better risk communication. The salient part will be easier for attention attraction and information extraction. Prioritizing the foreground information by highlights and de-prioritizing the background information by hiding or weakening are both potential practical implications.
A more detailed suggestion would be that such salient effect would be more effective when readers are not carefully examining the messages. This conclusion is prospective, because as mentioned above, people are “in default” probably process these messages carelessly. And this is usually the case during our daily risk communication. Moreover, when people are either motivated or primed to process information in a precise manner, such a graphical “trick” might be ineffective. In this case, risk communication campaigns need to be more sophisticated to match this mindset and maximize the effect of risk communication, and thus to help people make wise safe decisions. This suggestion is consistent with the classic elaboration likelihood model of persuasion, which emphasizes the match between the route of persuasion and the arguments presented (Petty & Cacioppo, 1986).
However, risk communication is not always meant to increase people’s risk perception. In some medical or financial cases, it is not obvious whether it is helpful for people to be slightly biased or to be fully accurate. For example, on the one hand, concern about certain disease would increase disease screening behavior (Vernon, 1999). On the other hand, overreaction to potential dangerous factors would result in unnecessary fear (Xie & Zheng, 2003). In other cases such as genetically modified food, it seems that people usually developed an irrational over-evaluation of the risk and risk communication is designed to lower risk perception (e.g., Costa-Font, 2013). A good solution might be to first uncover the possibilities of different communication methods and the related outcomes and then choose those methods that would lead to better outcomes.
In the current study, we treat subjects’ self-report of risk-avoidant behavior preference as an important indicator of real risk-taking or risk-avoidant behavior. However, recent research indicates that these are affected by a variety of factors, such as arousal, affect, cognitive capacity and motivation (Roets & Van Hiel, 2011). Another dual processing theory suggested that risk-taking behavior can be affected by either affective system or cognitive system (Figner, Mackinlay, Wilkening, & Weber, 2009). Thus, the path between a behavior preference, or an on-paper decision, to real behavior may still be affected by many factors. This is also proved by biological development evidence (Casey, Getz, & Galvan, 2008; Steinberg, 2008) and neuroscience studies (Cohen, 2005; Steinberg, 2008). A meta-analysis study of 47 experiments also showed that behavioral change intention did not always lead to real behavioral change (Webb & Sheeran, 2006). In our research, behavior preference is no doubt an important factor that affects real risk avoidant behavior, but further psychological factors should be included when we are discussing the effect of traffic risk communication in the real world. Whether the effect of different process mindset is robust in predicting real world safe decision needs more clarification.
Another direction will be optimizing the research method for increased ecological validity. For example, virtual reality technology could provide a real-time sensation and perception of the risk scenario (Fox, Arena & Bailenson, 2009), which could induce subjects’ reaction more effectively and preciously. As intelligent techniques are more and more highlighted in risk communication (e.g., Bissett, Wood, Cox, Scott, & Cassell, 2013), it is also promising in combining safe-driving training with properly visualized risk communication messages.
In conclusion, our research concerns the difficulties of low probability risk communication and the role of the foreground-background salience effect. In the context of traffic risk, we examined people’s risk judgment and decision making with different display formats and processing mindsets in pie charts. We extended the understanding of the FBSE and found a significant interaction of displays formats and mindset manipulation in risk preference. Practical suggestions are discussed, which is meaningful for improvements in low probability risk communication.
Bissett, S., Wood, S., Cox, R., Scott, D., & Cassell, J. (2013). Calculating alcohol risk in a visualization tool for promoting healthy behavior. Patient Education and Counseling, 92, 167–173.
Burson, K. A., Larrick, R. P., & Lynch, J. G. (2009). Six of one, half dozen of the other: Expanding and contracting numerical dimensions produces preference reversals. Psychological Science, 20, 1074–1078.
Casey, B. J., Getz, S., & Galvan, A. (2008). The adolescent brain. Developmental Review, 28, 62–77.
Cohen, J. D. (2005). The vulcanization of the human brain: A neural perspective on interactions between cognition and emotion. Journal of Economic Perspectives, 19, 3–24.
Costa-Font, M. (2013). Understanding food scares: The role of ambiguity aversion and analogical reasoning. Human and Ecological Risk Assessment: An International Journal, 19, 661–673.
Floyd, D. L., Prentice-Dunn, S., & Rogers, R. W. (2000). A meta-analysis of research on protection motivation theory. Journal of Applied Social Psychology, 30, 407–429.
Figner, B., Mackinlay, R. J., Wilkening, F., & Weber, E. U. (2009). Affective and deliberative processes in risky choice: Age differences in risk taking in the Columbia Card Task. Journal of Experimental Psychology: Learning, Memory, and Cognition, 35, 709–730.
Fox, J., Arena, D., & Bailenson, J. N. (2009). Virtual reality: A survival guide for the social scientist. Journal of Media Psychology, 21, 95–113.
Gamliel, E., & Kreiner, H. (2013). Is a picture worth a thousand words? The interaction of visual display and attribute representation in attenuating framing bias. Judgment and Decision Making, 8, 482–491.
Garcia-Retamero, R., & Galesic, M. (2010). Who profits from visual aids: Overcoming challenges in people’s understanding of risks. Social Science and Medicine, 70, 1019–1025.
Hastie, R., & Dawes, R. M. (2010). Rational choice in an uncertain world: The psychology of judgment and decision making (2nd ed.), pp. 3–6.
Lloyd, A. J. (2001). The extent of patients’ understanding of the risk of treatments. Quality in Health Care, 10, i14–i18.
Milne, S., Sheeran, P., & Orbell, S. (2000). Prediction and intervention in health-related behavior: A meta-analytic review of Protection Motivation Theory. Journal of Applied Social Psychology, 30, 106–143.
Petty, R. E., & Cacioppo, J. T. (1986). Communication and persuasion: Central and peripheral routes to attitude change. New York: Springer-Verlag.
Roets, A., & Van Hiel, A. (2011). An integrative process approach on judgment and decision making: The impact of arousal, affect, motivation, and cognitive ability. Psychological Record, 61, 497–520.
Schwarzer, R. (2001). Social-cognitive factors in changing health-related behavior. Current Directions in Psychological Science, 10, 47–51.
Sheeran, P., Harris, P. R., & Epton, T. (in press). Does heightening risk appraisals change people’s intentions and behavior? A meta-analysis of experimental studies. Psychological Bulletin. http://dx.doi.org/10.1037/a0033065.
Steinberg, L. (2008). A social neuroscience perspective on adolescent risk-taking. Developmental Review, 28, 78–106.
Stone, E. R., Sieck, W. R., Bull, B. E., Yates, J. F., Parks, S. C., & Rush, C. J. (2003). foreground:background salience: Explaining the effects of graphical displays on risk avoidance. Organizational Behavior and Human Decision Processes, 90, 19–36.
Sun, Y., Li, S., & Bonini, N. (2010). Attribute salience in graphical representations affects evaluation. Judgment and Decision Making, 5, 151–158.
Sun, Y., Li, S., Bonini, N., & Su, Y. (2013). Graph-framing effects in decision making. Journal of Behavioral Decision Making, 25, 491–501.
Vernon, S. W. (1999). Risk perception and risk communication for cancer screening behaviors: A review. Journal of the National Cancer Institute Monographs, 25, 101–119.
Webb, T. L., & Sheeran, P. (2006). Does changing behavioral intentions engender behavior change? A meta-analysis of the experimental evidence. Psychological Bulletin, 132, 249–268.
World Day of Remembrance for Road Traffic Victims. (2011, November). Retrieved 1st February, 2013, from http://www.unric.org/en/latest-un-buzz/27139-world-day-of-remembrance-for-road-traffic-victims.
Xie, X., & Zheng, R. (2003). Risk communication and public rationality. Advances in Psychological Science, 11, 375–381.
This research was financed by the National Natural Science Foundation of China (Project Number: 70522202) and was financed partially by National Natural Science Foundation of China (Project Number 1: 91224002; Project Number 2: 71172024).
Copyright: © 2013. The authors license this article under the terms of the Creative Commons Attribution 3.0 License.
This document was translated from LATEX by HEVEA.