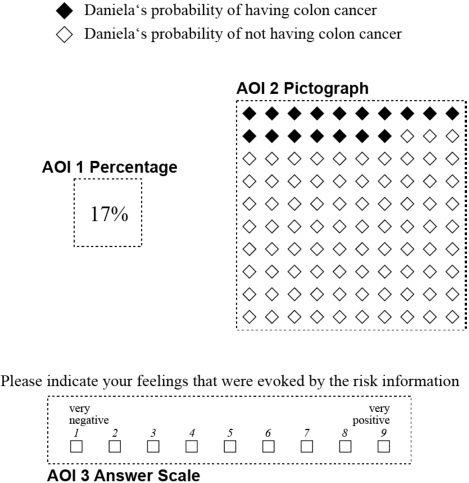
| Figure 1: Computer screen with presented risk information and answer scale. Areas of interest (AOIs 1–3) show the relevant information (the titles and boxes of the AOIs were not presented to the participants). |
Judgment and Decision Making, Vol. 9, No. 5, September 2014, pp. 420-432
Numeric and graphic risk information processing of high and low numerates in the intuitive and deliberative decision modes: An eye-tracker studyCarmen Keller* Christina Kreuzmair# Rebecca Leins-Hess# Michael Siegrist# |
The influence of numeracy on information processing of two risk communication formats (percentage and pictograph) was examined using an eye tracker. A sample from the general population (N = 159) was used. In intuitive and deliberative decision conditions, the participants were presented with a hypothetical scenario presenting a test result. The participants indicated their feelings and their perceived risk, evoked by a 17% risk level. In the intuitive decision condition, a significant correlation (r = .30) between numeracy and the order of information processing was found: the higher the numeracy, the earlier the processing of the percentage, and the lower the numeracy, the earlier the processing of the pictograph. This intuitive, initial focus on a format prevailed over the first half of the intuitive decision-making process. In the deliberative decision condition, the correlation between numeracy and order of information processing was not significant. In both decision conditions, high and low numerates processed pictograph and percentage formats with similar depths and derived similar meanings from them in terms of feelings and perceived risk. In both conditions numeracy had no effects on the degree of attention on the percentage or the pictograph (number of fixations on formats and transitions between them). The results suggest that pictographs attract low numerates’ attention, and percentages attract high numerates’ attention in the first, intuitive, phase of numeric information processing. Pictographs thus ensure low numerates’ further elaboration on numeric risk information, which is an important precondition of risk understanding and decision making.
Keywords: numeracy, information processing, eye tracker, intuitive and
deliberative decision making, risk communication.
One important goal of medical risk communication is to provide laypeople and patients with numeric and probabilistic information. The correct use of this numeric information is determined by people’s numeracy or their ability to deal with numbers (Peters et al., 2006). An information processing approach to numeracy suggests that processing numbers and thus risk information starts with an intuitive process, which determines the extent to which individuals pay further attention to, think about, and thus comprehend numbers and numeric risk information (Lipkus & Peters, 2009). Therefore, for risk communication with low numerates, formats should be used that attract their attention in this first intuitive phase of numeric processing and make them think further about the numeric information required for decision making. Otherwise, this group is likely to neglect the numeric information and make poor decisions.
To address low numerates’ difficulties in understanding numeric risk information (Reyna, Nelson, Han, & Dieckmann, 2009), graphic formats (Lipkus, 2007) and particularly pictographs have been recommended (Ancker, Senathirajah, Kukafka, & Starren, 2006; Garcia-Retamero, & Cokely, 2013; Hawley et al., 2008; Tait, Voepel-Lewis, Zikmund-Fisher, & Fagerlin, 2010a, 2010b; Zikmund-Fisher, Fagerlin, & Ubel, 2010). However, to date, little is known about the information processing of pictorial and numeric risk communication formats by low and high numerates. With reference to the information processing approach to numeracy (Lipkus & Peters, 2009), this study’s main goal was to examine the extent to which pictorial and numeric formats attract low and high numerates’ initial intuitive attention, making them process the information further so that they comprehend the relevant risk information. We used the eye-tracker methodology, since this was found to be a helpful tool for unobtrusively examining information processing while participants were making decisions (Glöckner & Herbold, 2011; Horstmann, Ahlgrimm, & Glöckner, 2009; Schulte-Mecklenbeck, Kühberger, & Ranyard, 2011).
The dual-mode information processing approach to numeracy (Lipkus & Peters, 2009) distinguishes between two modes of thinking. The intuitive system 1 mode is automatic, fast, and based on intuitive representations. The deliberative system 2 mode, which is conscious, analytical, reason based, and relatively slow (Lipkus & Peters, 2009). In line with the view of numeric cognition researchers (for an overview, see Lipkus & Peters, 2009), the core assumption of the information processing approach to numeracy (Lipkus & Peters, 2009) is that the first phase of numeric processing is determined by the system 1 intuitive mode. This first phase of numeric processing determines whether and to what extent individuals attend to and further process the numeric information. In the second phase of numeric processing they derive meaning from the numeric information. This phase of interpretation and understanding may involve the intuitive system 1 mode, or the deliberative system 2 mode (e.g., manipulation and computation of numbers), or both systems working in parallel (Lipkus & Peters, 2009). The term phase thus refers to the time or step of processing, whereas the term mode refers to the way of operation while processing.
Research found high numerates to have more precise, intuitive representations of numbers (Peters, Slovic, Vastfjall, & Mertz, 2008), pay more attention to numbers and use them (Peters et al., 2006), draw affective meaning from them, and have a better understanding of them, compared to low numerates, who tend to use less relevant sources of information like mood or trust in others (Peters, 2012; Peters et al., 2006). Accordingly, high numerates were found to have a better understanding of numeric risk communication formats than low numerates had (Lipkus & Peters, 2009; Reyna et al., 2009). Thus, theoretical reasoning and empirical evidence suggest that high numerates’ greater initial attention to numeric information makes them process it further and understand it better (Lipkus & Peters, 2009). However, initial attention and numeric information processing have not yet been empirically examined. The eye-tracker methodology provides a beneficial tool to examine the initial attention to and processing of numeric and graphic formats.
Several experimental studies comparing various risk communication formats suggest that low numerates understand pictographs (also called icon arrays) better than other graphic formats or pure numeric presentations such as percentages (Hawley et al., 2008; Tait et al., 2010a, 2010b; Zikmund-Fisher et al., 2010), especially when they are combined with numeric information (Garcia-Retamero & Cokely, 2013). Pictographs with a denominator of 1000 were less understood by high and low numerates (Keller & Siegrist, 2009) than those with a denominator of 100 (Hess, Visschers & Siegrist, 2011).
What features of the pictograph may explain the good understanding of low numerates? The fuzzy trace theory suggests that pictographs make gist salient (Reyna et al., 2009). They represent the relevant information by making part-to-whole relationships visually available (Ancker et al., 2006; Garcia-Retamero & Cokely, 2013). Thus, pictographs do not guide low numerates toward numbers; instead, the part-to-whole relationship can be captured in a holistic and gist-based way and makes the nonnumeric processing of numeric information possible. Therefore, compared to percentages, pictographs may be more helpful for low numerates to translate the quantitative meanings of probabilities (e.g., high versus low, many versus few) into affective meanings (bad versus good, risky versus not risky). A recent experimental study (Hess, Visschers, & Siegrist, 2011) suggests that high and low numerates have a similar good understanding of pictographs but may process them differently. High numerates may rely more on the numeric information depicted in the pictograph, whereas low numerates may process the pictograph in a more holistic and nonnumeric way.
Intuitive processes are defined as automatic; operating at least partially without people’s awareness; and resulting in feelings, interpretations, and affects toward options (Glöckner & Witteman, 2010). It is assumed that, by interacting with their environment, individuals unconsciously acquire information such as affective evaluations of stimuli or decision options (Glöckner & Witteman, 2010). When individuals are confronted with similar situations, this information is automatically retrieved and results in simple feelings such as liking or disliking the stimuli in question (Finucane, Alhakami, Slovic, & Johnson, 2000; Glöckner & Witteman, 2010; Slovic, Finucane, Peters, & MacGregor, 2007). Intuitive retrieval of information may (but need not) take place before explicit understanding (Glöckner & Witteman, 2010).
Previous eye-tracker studies (Bridgeman, 1992; Holm, 2008; Ryan & Cohen, 2004) provided empirical support for intuitive retrieval of information before explicit understanding. They found that with attention shifts, an intuitive preference for the to-be-chosen option was observed before a conscious preference for this option had completely evolved (Norman & Schulte-Mecklenbeck, 2010). Eye tracking had also been used to compare information processing in the intuitive and deliberative decision-making modes (Glöckner & Herbold, 2011; Horstmann et al., 2009; Rubaltelli, Dickert, & Slovic, 2012). The results of Horstmann and colleagues’ study (2009) indicated no differences in the mean fixation durations (a reliable proxy for the level or depth of information processing), but a more comprehensive information search and a higher number of fixations were found in the deliberative condition, compared to the intuitive condition. This finding supports the notion that qualitatively similar automatic processes are activated in the intuitive and deliberative decision modes, but a greater amount of information is searched and processed in the latter (Glöckner & Herbold, 2011; Horstmann et al., 2009; Rubaltelli et al., 2012). Apart from a few exceptions that examined other risk communication formats (Hess, Visschers, Siegrist, & Keller, 2011; Keller, 2011), to our best knowledge, information processing of pictorial and numeric communication formats has not been examined by means of the eye tracker.
Figure 1: Computer screen with presented risk information and answer scale. Areas of interest (AOIs 1–3) show the relevant information (the titles and boxes of the AOIs were not presented to the participants).
Referring to the information processing approach to numeracy (Lipkus & Peters, 2009), the present study aimed to examine the first intuitive phase of numeric information processing that determines the extent to which individuals pay attention to, process further, and thus understand numeric information. Using the eye tracker, we particularly examined whether pictographs (rather than numeric formats) attract low numerates’ initial attention in this first intuitive process. We therefore examined the initial attention and further processing in the intuitive decision mode and compared them with numeric processing in the deliberative decision mode. We induced the intuitive decision mode in one experimental condition and the deliberative mode in the other experimental conditions. In the intuitive condition, we induced the intuitive mode of thinking by instructing people to decide as quickly as possible and based on gut feeling. In the deliberative condition, we induced the deliberative mode by instructing people to take as much time as needed and to think carefully about the information before making a decision (Horstmann, Hausmann, & Ryf, 2010). To facilitate tracing of information processing, we presented the participants with a combined risk format that included a percentage and a pictograph; thus, they were free to choose the format and the order of processing (see Figure 1).
Pictographs convey numeric information in a nonnumeric way. The visual availability of the part-to-whole relationship (Ancker et al., 2006; Garcia-Retamero & Cokely, 2013) facilitates low numerates’ holistic (Hess, Visschers, & Siegrist, 2011), nonnumeric, and gist-based (Reyna et al., 2009) processing of pictographs. Due to the availability of the part-to-whole relationship, especially for low numerates, pictographs may evoke feelings of being able to understand the enclosed numeric information and may thus be associated with a positive affective tag (Glöckner & Witteman, 2010; Slovic et al., 2007). The pictograph may therefore attract low numerates’ attention in the first intuitive phase of numeric information processing. In contrast, due to their precise, intuitive representations of numbers (Peters et al., 2008), high numerates may feel able to understand pure numeric information. Percentages may therefore be associated with a positive affective tag and attract high numerates’ attention in the initial, intuitive phase of numeric processing (Lipkus & Peters, 2009). Therefore, when participants are presented with numeric information in pictograph and percentage formats, we hypothesized that in the intuitive decision condition, low numerates initially focus on the pictograph before the percentage, and high numerates initially focus on the percentage before the pictograph. We assumed the initial focus in the first intuitive phase of numeric processing to be automatic. Previous research (Horstmann et al., 2009) found qualitatively similar automatic processes in both the deliberative and intuitive modes of information processing and decision making. However, in the intuitive condition, the automatic processes might occur immediately and in the beginning of the course of information processing. In contrast, in the deliberative condition, automatic processes might occur later in the course of decision making. Therefore, we expected the effect of numeracy on the order of information processing to be attenuated in the deliberative condition, compared to the intuitive condition.
The participants were randomly assigned to one of the two conditions, with an approximately equal number of women and men in each group. In the intuitive condition, the participants were instructed to decide as quickly as possible, based on their gut feeling. In the deliberative condition, the participants were instructed to take as much time as they needed to think carefully about the presented information before they made their decision (Horstmann et al., 2010).
We used a hypothetical scenario describing a person’s risk of contracting a disease (colon cancer). The participants had to answer a simple rating task by indicating the valence of their feelings and risk perception of the presented probability of a hypothetical friend having colon cancer. This scenario resulted in similar responses by low and high numerates in a previous study (Hess, Visschers, & Siegrist, 2011). The scenario that was used described a person named Daniela (a hypothesized, well-known friend of the participants) who had received personalized test results from her physician. The test results showed a 17% probability that she had colon cancer, presented as a percentage and a pictograph alongside each other on the same screen (Figure 1). The depiction of the risk formats (percentage left/pictograph right versus pictograph left/percentage right) was counterbalanced.
The participants were seated in front of a computer monitor in our laboratory. The interviewer explained the function of the eye tracker (iViewX™ Red System; SensoMotoric Instruments). The eye tracker was equipped with an infrared sensitive camera located at the bottom of the computer monitor. The participants were given written information about the eye-tracker study and asked for their informed consent. After the eye tracker was calibrated, the scenario was presented on the computer screen. The participants were informed that they would receive numeric and graphic information, with highlighted dots for having colon cancer and non-highlighted dots for not having colon cancer. Subsequently, the instruction to manipulate the intuitive or the deliberative mode, respectively, appeared on the computer screen. Then the risk information was provided on the computer screen, together with the rating task (see Figure 1). The participants had to say a number (between 1 and 9) to indicate their feelings. When the participants said the number, the experimenter pressed the space bar to change the slides and take a time stamp. The experimenter noted the number that each participant said on a separate sheet. On the next slide, the participants were again presented with the same percentage and pictograph but with a different question, asking them to indicate how they assessed the risk of Daniela’s having colon cancer. The participants could indicate the risk on a scale of 1 (very low) to 9 (very high). The experimenter again noted the numbers on a separate sheet. After the eye-tracking component of the experiment was completed, the participants filled out a paper-and-pencil questionnaire (numeracy and sociodemographic variables). The participants received US$42 (40 Swiss francs, CHF) for travel expenses and were debriefed and thanked.
Numeracy was assessed using the 8-item Rasch-based scale developed by Weller and colleagues (Weller et al., 2013), which included items from existing numeracy measures (Frederick, 2005; Lipkus, Samsa, & Rimer, 2001; Peters, Hibbard, Slovic, & Dieckmann, 2007) but assessed a broad range of difficulties. Cronbach’s α in the present study was .68.
The AOIs refer to the regions that participants could consider while looking at the presented information. We aimed to separate the processing of risk information from reading (e.g., legend or question). The three AOIs with the relevant information, AOI 1 (percentage), AOI 2 (pictograph), and AOI 3 (answer scale), were analyzed (Figure 1).
The first fixations on the computer screen were excluded to avoid methodological artifacts (Horstmann et al., 2009). SMI BeGazeTM 3.0 was used for the analysis. The fixations were calculated by the software when the participant’s gaze remained stable for at least 80 ms (standard setting in BeGaze). The number of fixations on the AOIs and the number of transitions between the AOIs were used as proxies for the amount or degree of attention to the AOIs (Horstmann et al., 2009; Rubaltelli et al., 2012). The mean fixation duration (total fixation duration on the AOI divided by the number of fixations on the AOI) was used to measure the depth of information processing (Horstmann et al., 2009). The order of the information processing was calculated based on the time that elapsed between the start of viewing the stimulus slide and the first fixation that hit each AOI. The order of the AOIs was derived from the comparison of these times for each person.
Data were analyzed using SPSS (version 22, SPSS Inc.). To examine the associations between numeracy and order of information processing, we computed point-biserial correlations with 95% confidence intervals calculated using bootstrapping. For further significance testing, separate linear regression analyses with decision times, the mean fixation durations or number of fixations, respectively, as the dependent variable and numeracy (as continuous variable), condition and the interaction term between numeracy and condition as independent variables were conducted. The condition was recoded as 0 for the intuitive decision condition and 1 for the deliberative decision condition. Numeracy was centered around the grand mean. The interaction term was the product of the condition and the centered numeracy. As the distribution of the mean fixation durations and the number of fixations were positively skewed, the dependent variables were log-transformed for regression analyses. When we conducted several comparisons, we used the Bonferroni correction to adjust the alpha level.
For one-tailed significance testing of correlations (between numeracy and order of processing) of medium effect size (r = 0.30) on an alpha level of 0.05 and a power of 0.80, a sample size of n = 64 is required per condition (Faul, Erdfelder, Buchner, & Lang, 2009; Faul, Erdfelder, Lang, & Buchner, 2007). We used a sample from the general population of a large Swiss city (Zurich) and agglomeration. Advertisements about participating in the study were placed on Internet platforms and on billboards of large stores. Letters were sent to a random sample from the telephone book covering several districts and comprising inhabitants with different education and income levels. Due to the potentially high rate of exclusion of participants in eye-tracker studies, we invited more people than we required. Out of the 171 participants, the eye-tracker data for 11 participants had to be excluded due to bad calibration values (mean deviation on X or Y axes larger than 1.5°) or a tracking ratio below 70%. Another participant was excluded due to a three times larger number of fixations caused by talking while looking at the computer screen. The final sample included data on 159 people (78 women), with a mean age (M) of 36.5 years and a standard deviation (SD) of 12.5. The education levels ranged from primary school (1.3%, n = 2), lower secondary school (10.1%, n = 16), upper secondary vocational school (42.1%, n = 67), upper secondary university preparation school (21.4%, n = 34) to college or university (25.2%, n = 40).
After exclusion, the genders were equally distributed in both conditions (intuitive condition: n = 78, 40 women; deliberative condition: n = 81, 38 women, χ2(1) = 0.30; p =.58). After exclusion, numeracy unexpectedly differed significantly between the two conditions (intuitive: M = 4.82, SD = 1.88; deliberative: M = 4.21, SD = 1.73; t(157) = 2.13; p = .03). The difference was rather small, and the decision outcome (see the Results section) did not differ between the conditions. Since our hypotheses mainly concern correlations of numeracy with other factors instead of mean differences, we argue that this unintended difference between conditions is unlikely to have crucially influenced our findings.
We conducted a regression analysis with the log transformed decision times as a dependent variable and our manipulation of decision mode condition (0 = intuitive, 1 = deliberative), numeracy (centered) and their interaction as predictors. We observed a significant effect of the condition (β = .52, t(155) = 7.61, p < .001); intuitive: M = 12.74 s, SD = 6.10 s; deliberative: M = 23.42 s, SD = 12.20 s), indicating that the manipulation was successful at affecting decision time. Additionally, the effects of numeracy (β = −.23, t(155) = −2.51, p = .013) and the interaction of condition and numeracy (β = .20, t(155) = 2.18, p = .031) were also significant. Overall, with increasing numeracy decision time decreased although this effect was mainly driven by differences in the intuitive condition. In the intuitive condition, numeracy was significantly negatively associated with total decision times, indicating that the higher the numeracy, the shorter the decision times. To test the simple slope in the deliberative condition, we conducted a separate regression analysis, with the deliberative condition as a baseline (comparison) group (Aiken & West, 1991). Numeracy was not associated with decision times (β = .06, t(155) = 0.64, p =.53) in the deliberative condition.
Table 1: Initial focus: correlations (95% confidence interval, n) between order of AOIs and numeracy.
Numeracy
(n = 60)
(n = 61)
(n = 72)
(n = 76)
To test our hypothesis, we analyzed the order of processing the AOIs with relevant numeric information. We found two orders of processing for the three relevant AOIs: 55% (n = 87) of the participants looked at the pictograph first, the percentage second, and the answer scale third; 21% (n = 34) looked at the percentage first, the pictograph second, and the answer scale third; and 24% (n = 38) did not look at all three AOIs. This distribution did not differ between the two conditions (χ2(1) = .57, p = .45). In the intuitive condition, numeracy was significantly correlated with the order of processing the three AOIs. The higher the numeracy, the more often the participants processed the percentage before the other information; the lower the numeracy, the more often the participants processed the pictograph before the other information. Table 1 shows the correlations with 95% confidence intervals (calculated using bootstrapping). The non-overlapping confidence intervals indicated that the correlations differed between the two conditions. In the deliberative condition, the correlation was not significant.
Analyzing only the order of the risk formats indicated that 65% of the participants (n = 103) looked at the pictograph before the percentage, and 28% (n = 45) looked at the percentage before the pictograph (7% [n = 11] looked only at the pictograph or the percentage). These results did not differ between the two conditions (χ12 = .10, p = .75). In the intuitive condition, numeracy was significantly correlated with the order of risk information (Table 1), indicating that the participants with higher numeracy processed the percentage information before the pictograph, and those with lower numeracy processed the pictograph before the percentage information. The confidence intervals marginally overlapped. Nevertheless, overall, the results suggested that in the intuitive condition, the pictograph attracted the initial focus of low numerates, and the percentage attracted the initial attention of high numerates. In the deliberative condition, this automatic initial attraction toward a format seemed to disappear or at least be attenuated.
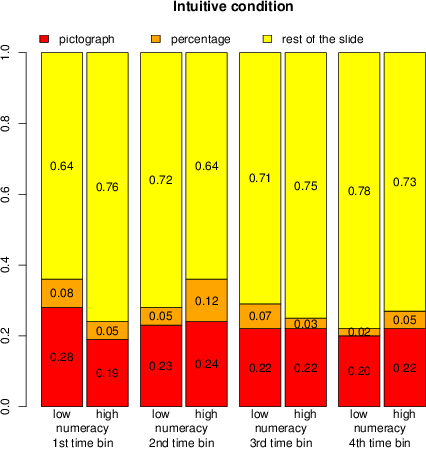
Figure 2: Mean relative frequencies of fixations on the pictograph, the percentage, and the rest of the whole slide in the four quarters of information processing time while making a decision (N = 159). 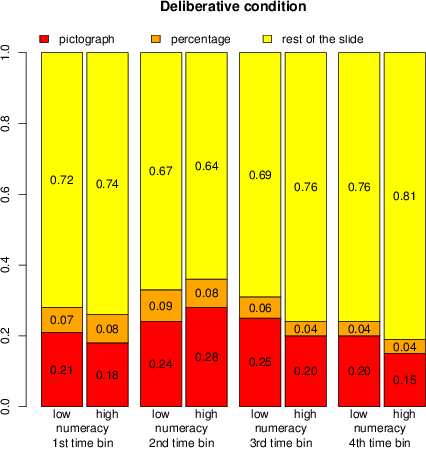
To explore how long the participants’ initial focus on a format lasted, we examined what format they processed, relative to processing the information on the whole slide (see Figure 1). For each participant, we calculated the relative frequencies of fixations on the pictograph, on the percentage, and on the rest of the slide (e.g., the number of fixations on the pictograph divided by the number of fixations on the whole slide) in the four quarters of the time of information processing while making a decision (the sum of the fixation durations on the whole slide divided by four). We conducted a median split (Mdn = 5.00) on numeracy to present graphically the relative frequencies for high and low numerates. Figure 2 illustrates that, in the intuitive condition in the first quarter of the information processing time, low numerates had higher relative frequencies of fixations on the pictograph than those of high numerates. Accordingly, the correlation (Spearman’s ρ) between relative frequencies of fixations on the pictograph and numeracy was significantly negative for the first time bin (rs = −.21, p = .04, one-tailed, n = 78), indicating that relative to all information that the participants could observe, the lower the participants’ numeracy, the more often they looked at the pictograph. In the second quarter of the information processing in the intuitive condition, high numerates had higher relative frequencies of fixations on the percentage than those of low numerates. This correlation between relative frequencies of fixations on the percentage and numeracy was significantly positive (rs = .33, p < .01, one-tailed, n = 78), indicating that, relative to all information that the participants could observe, the higher the numeracy, the more often they looked at the percentage. In the third and fourth quarters of information processing, high and low numerates had similar relative frequencies of fixations on the two formats and the rest of the slide. This was also the case in the four quarters of information processing in the deliberative condition. Overall, in both conditions, high and low numerates looked at the pictograph, as well as at the percentage. However, on average, the relative frequencies of fixations on the pictograph were larger than those on the percentage.
Table 2: Depth of information processing: mean fixation durations (with SD).
Percentage Pictograph
(n = 80)Answer scale
(n = 75)* p < .05
However, relative to all information that the participants could observe, in the first quarter of information processing in the intuitive condition, low numerates looked more often at the pictograph than high numerates did; in the second quarter of information processing, high numerates looked more often at the percentage than low numerates did. These results suggest that in the intuitive condition, relative to all information that the participants could consider, the initial focus of low and high numerates on their preferred format prevailed over half of the time of information processing. In the deliberative condition, both groups showed no preference for any format.
To gain further insights into the information processing of numeric and pictorial risk communication formats, we explored the effect of numeracy on mean fixation durations, which is a proxy for the depth of processing the formats. We calculated the mean fixation duration for each AOI of the participants who looked at the particular AOI. (Eleven participants did not look at the percentage, one person did not look at the pictograph, and three participants did not look at the answer scale but expressed their decision by reading the question only, which is not analyzed here.) Table 2 depicts the mean fixation durations. The t-tests revealed that the mean fixation durations for the percentage (t(146) = −.65, p = .52) and the pictograph (t(156) = −.54, p = .59) were not significantly different between the two conditions, indicating that in both conditions, risk information was processed with similar depths. The mean fixation durations on the answer scale significantly differed between the two conditions (t(154) = −2.38, p = .02). However, the difference was not significant after the Bonferroni correction, which was necessary because tests were post-hoc and we did not have clear hypotheses concerning where to expect differences. Mean fixation durations were not associated with numeracy (percentage: r = −.07, p = .42, n = 147; pictograph: r = −.04, p = .63, n = 158; answer scale: r = .04, p = .64, n = 156), indicating that numeracy did not affect the depth of information processing. The results thus do not allow to reject the hypothesis that in both conditions, high and low numerates processed the presented information, particularly numeric and pictorial, with similar depths and that both formats required similar efforts to be understood by high and low numerates.
Table 3: Number of fixations and transitions (M (SD)).
Number of fixations on AOIs Number of transitions between AOIs
Table 4: Results of regression models (standardized coefficients) with numbers of fixations on relevant AOIs, number of transitions between relevant AOIs as dependent variables. (N=159).
Log number of fixations on: Log number of transitions: Percentage Pictograph Answer scale AOI→AOI Answer scale→pictograph Condition (intuitive, deliberative) .38*** .35*** .41*** .34*** .21** Numeracy .04 -.15 -.19+ -.20* -.22* Interaction condition X numeracy -.002 .08 .23* .14 .14 F3,155 8.60*** 8.68*** 12.98*** 8.95*** 4.35** Adj. R2 .13 .13 .19 .13 .06 Condition (0 = intuitive, 1 = deliberative. *** p < .001, ** p < .01, * p < .05, + p = .054.
We also explored the effect of numeracy on the degree of attention by analyzing the number of fixations on relevant AOIs and the number of transitions between AOIs. Table 3 shows the mean values of the number of fixations on the three AOIs and between the AOIs.
To test the effects of condition and numeracy, we conducted a separate regression analysis for each AOI, with the log transformed total number of fixations on the AOI as a dependent variable (see Table 4). For all three AOIs, we found a significant effect of the condition on the number of fixations. However, we found no significant effect of numeracy on the number of fixations on the three AOIs. Nevertheless, we found a significant interaction between numeracy and condition for the answer scale. However, the effect of numeracy on the number of fixations on the answer scale was not significantly different from zero in the intuitive condition (p = .054) or in the deliberative condition (simple slope test of the separate regression analysis with this condition as a baseline (comparison) group (Aiken & West, 1991): (β = .14, t(155) = 1.31, p = .19)). In sum, although the association between numeracy and number of fixations significantly differed between the two conditions, the numeracy effect was not significantly different from zero in either condition.
The number of transitions between AOIs refers to the sum of transitions between the three AOIs in both directions. Regression analysis (Table 4) revealed a significant effect of condition. In the deliberative condition, we observed a significantly higher number of transitions. The effect of numeracy was significant, and the interaction was not significant, indicating that on average, low numerates had more transitions between the AOIs than high numerates. We observed similar results for transitions from the answer scale to the pictograph, indicating that in both conditions low numerates looked more often from the answer scale to the pictograph than high numerates did. However, the effects of numeracy on the number of transitions between AOIs and on the number of transitions from the answer scale to the pictograph were not significant anymore after the Bonferroni correction.
The results thus indicated that the participants in the deliberative condition looked more often at all kinds of information (i.e. the pictograph, the percentage, and the answer scale) and had more transitions between AOIs than the participants in the intuitive condition did, pointing to a higher degree of attention to information in the deliberative than in the intuitive condition, as one could expect based on the instruction. However, in both conditions, we found no differences between high and low numerates in their attention to different AOIs, pointing to similar degrees of attention, particularly to the percentage and the pictograph. Hence, although there were differences in the order of information processing due to numeracy, the overall amount of attention to numerical versus pictorial presentations of the same probability information did not depend on numeracy.1
To examine what meaning participants derived from the risk information presented as pictograph and percentage, participants were asked to indicate their feelings that were evoked by the presented risk information. They could answer on a scale ranging from very negative (1) to very positive (9). Feelings did not differ between the two conditions (intuitive: M = 5.59, SD = 2.08; deliberative: M = 5.48, SD = 2.13; t(157) = .32, p = .75). Feelings were not associated with numeracy (r = −.12, p = .15).
Participants were further asked to indicate their perceived risk evoked by the presented risk information on an answer scale ranging from very low (1) to very high (9). Results show that perceived risk did not differ between the two conditions (intuitive: M = 3.82, SD = 1.86; deliberative: M = 4.01, SD = 2.03; (t(157) = −.62, p = .54) and was not associated with numeracy (r = −.13, p = .11). The results indicated that in both conditions, high and low numerates derived similar meanings from the presented risk level in terms of feelings of concern and risk perception.
For risk communication with laypeople, it is important to use communication formats that attract initial attention in the first intuitive phase of numeric information processing, because the intuitive, initial focus determines whether people further attend to and think about and thus comprehend numeric information (Lipkus & Peters, 2009). Using the eye tracker, we examined this initial attention in both intuitive and deliberative information processing. In line with our hypothesis for the intuitive condition, we found a significant correlation between the order of format processing and numeracy. Having the choice to process percentage or pictograph formats, low numerates initially focused on the pictograph, while high numerates initially focused on the percentage.
Furthermore, relative to all information that the participants could observe, in the first quarter of intuitive decision making, low numerates looked more often at the pictograph than high numerates did. In the second quarter of intuitive decision making, high numerates looked more often at the percentage, compared to low numerates. These results suggested that considering all information that the participants could observe, low numerates tended to process pictographs further, and high numerates were inclined to continue processing percentages over the first half of the course of information processing in the intuitive decision mode. In the deliberative condition, we found no initial preference for any format.
These results are consistent with the information processing approach to numeracy (Lipkus & Peters, 2009), suggesting that high numerates pay attention to numbers in the first intuitive phase of numeric processing, making them process the percentage further. This initial attention and further processing explain their good understanding of numeric risk information (Lipkus & Peters, 2009; Reyna et al., 2009). Furthermore, our results indicate that the information processing approach to numeracy (Lipkus & Peters, 2009) may also apply to the processing of pictographs by low numerates. These findings suggest that the low numerates’ initial focus on the pictograph, which makes them process further the numeric information presented in it (Lipkus & Peters, 2009), may explain the good comprehension of pictographs that have been found in previous studies (Garcia-Retamero & Cokely, 2013; Hawley et al., 2008; Tait et al., 2010a, 2010b; Zikmund-Fisher et al., 2010).
Why do pictographs attract low numerates’ attention? Pictographs convey numeric information in a nonnumeric way. The visual availability of the part-to-whole relationship in pictographs (Ancker et al., 2006; Garcia-Retamero & Cokely, 2013) makes gist salient (Reyna et al., 2009) and does not guide low numerates toward numbers. On the contrary, it facilitates the nonnumeric, holistic, and gist-based translation from quantitative to qualitative meaning. Low numerates have been found to have less confidence in their mathematical and medical calculation abilities and to have higher mathematics anxiety, compared to high numerates (McMullan, Jones, & Lea, 2012). Pictographs may therefore evoke feelings of being able to understand the enclosed numeric information, which have been shown to be an important motivational precondition of cognitive engagement in and elaboration on the task (Ashcraft & Moore, 2009; Greene & Miller, 1996; Walker, Greene, & Mansell, 2006). Therefore, pictographs may be tagged with positive affect and may attract low numerates’ attention in the first intuitive process, thus ensuring further elaboration (Greene & Miller, 1996; Lipkus & Peters, 2009; Walker et al., 2006). To our knowledge, this is the first study providing empirical evidence for these underlying processes when participants are confronted with numeric and pictorial information.
This study’s results indicated that numeracy affected some processes underlying decision making (i.e., order of processing the relevant numeric and pictorial information) but not other processes for which plausible differences between high and low numerates could likewise be assumed, according to previous research. For example, based on previous results that low numerates have less precise intuitive representation of numbers, compared to high numerates (Peters et al., 2008), one might expect that low numerates pay less attention to the percentage than high numerates do. However, using a sample size with a test power of 80% to detect significant effects of medium size, we did not find any effect of numeracy on effort of processing, or degree of attention and derived meaning. Thus, this study provided insights into information processing in terms of the dependence on numeracy by ruling out some plausible assumptions concerning differences in processing.
However, in the intuitive condition, low numerates had longer total decision times than those of high numerates, indicating that, when asked to decide as quickly as possible, high numerates processed information more rapidly than low numerates did. This result is in line with those of previous research, suggesting that low numerates process information less efficiently than high numerates do (Hess, Visschers, Siegrist, et al., 2011; Keller, 2011) and might be due to the relationship between numeracy and working memory (Cokely, Galesic, Schulz, Ghazal, & Garcia-Retamero, 2012).
Numeracy had no effect on the meanings that participants derived from the presented information in terms of feelings of concern and perceived level of risk. Nevertheless, numeracy had an effect on the order of processing the pictograph and the percentage in the intuitive condition. These results suggest that despite differences in the order of processing, similar meanings can be derived. Moreover, the condition had no effect on the feelings of concern and perceived level of risk, indicating that in the intuitive and deliberative conditions, the participants derived similar meanings from the presented information. To our knowledge, this is the first high-powered, eye-tracking study that provides empirical evidence that similar meanings of risk information can be derived from different ways of processing information.
We found no effect of numeracy on the order of information processing in the deliberative condition. In line with previous research results (Horstmann et al., 2009), we found similar mean fixation durations indicating a similar depth of information processing in both conditions, pointing to the fact that this manipulation does not necessarily induce qualitatively different processes.
In the deliberative condition the correlation between the order of processing and numeracy was not significant. We therefore did not interpret this result. However, interestingly the correlation even tended to be in the opposite direction than in the intuitive condition. Hence, in the deliberate condition less numerate persons even tended to start information search more strongly with numerical percentage information, for which it is assumed that they cannot use it so easily. It would be interesting to examine whether this unexpected reversal that might be due to deliberate (over-) correction of spontaneous tendencies holds in replication studies.
In this study, we found no effect of numeracy on processing the highlighted part of the pictograph with the black icons depicting the probability of having colon cancer and non-highlighted part with the white icons depicting the probability of not having colon cancer. However, the study’s main goal was not to examine the processing of pictographs per se. Since pictographs were recommended for low numerates to overcome their difficulties in understanding pure numeric formats, this study’s primary goal was to compare the processing of numeric and pictorial information. Further eye-tracker studies need to examine whether high and low numerates use different strategies of extracting numeric information from pictographs. Low numerates may process the part-to-whole relationship in a holistic way, while high numerates may extract the number from the pictograph by counting the icons, for example (Hess, Visschers, & Siegrist, 2011). This new research requires a different study design. A single, large pictograph with large icons should be presented to participants, making it possible to track and examine their eye fixations on single icons.
We designed the pictograph larger than the percentage, since this looked more realistic. A percentage of the same size as that of the pictograph might have looked strange. It might be argued that low numerates looked at the pictograph first or more often only because it was larger. However, despite the high power of the study in the deliberative decision mode, we did not find any effect of numeracy on the order of information processing or on the relative fixations on the pictograph. This result is inconsistent with the possibility that low numerates looked at the pictograph first or more often only because it was larger.
A similar reasoning applies to the result that in absolute terms low and high numerates had more fixations on the pictograph than on the percentage. This might be due to the larger size of the AOI with the pictograph, compared to the size of the AOI with the percentage. A more likely explanation is, however, that this is due to the larger amount of information that the pictograph conveyed (100 icons, some highlighted and others non-highlighted), compared to the percentage (a single number). Thus, even if the percentage and the pictograph had the same size, the participants might have had more fixations on the pictograph than on the percentage. Therefore, we examined relative fixations on relevant information to determine the effect of numeracy. Although we found in absolute terms that high numerates also fixated on the pictograph more often than on the percentage, relative to all information they could observe, they showed a preference for the percentage in the second quarter of intuitive decision making. This rules out the argument that only the size of the pictograph or its higher amount of information drove the high numerates’ fixations.
Furthermore, in this study, we used simple numeric and graphic representation formats to present a simple rating task and nevertheless found an initial focus of low numerates on pictographs. In future studies, more complex tasks such as comparing the risks (or benefits) of two different treatments should be examined. However, more complex, numeric representation formats and tasks may exaggerate the effect of numeracy on the initial focus on numeric representation formats. If the low numerates’ belief in being unable to understand numeric information or even their mathematics anxiety predominates in the first intuitive phase of numeric processing, they may not (or not sufficiently) engage cognitively in processing numeric information (Ancker et al., 2006; Ashcraft & Moore, 2009; Greene & Miller, 1996; Lipkus & Peters, 2009; Walker et al., 2006) and may be prone to making a decision that is inconsistent with their preferences.
Moreover, we examined the initial intuitive focus on a pictograph, as opposed to a percentage. Further research should investigate whether low numerates initially focus on pictographs when other formats are presented as well. Previous research found that low numerates understood pictographs better, compared with other graphic formats (Hawley et al., 2008; Tait et al., 2010a, 2010b; Zikmund-Fisher et al., 2010), probably because of the visual availability of the part-to-whole relationship (Garcia-Retamero & Cokely, 2013). Pictographs thus facilitate the holistic processing of the risk information (Hess, Visschers, & Siegrist, 2011). Therefore, we presume low numerates’ initial and intuitive focus on pictographs, even if they are presented with other graphic formats.
In order not to lose the data of too many participants in this study, we generously set the calibration values of the eye-tracker data (mean deviation on X or Y axes smaller than 1.5°), challenging the reliability of the measurement. Nevertheless, we found a significant effect of numeracy on the order of information processing and on the relative frequencies of fixations on the percentage and the pictograph. However, in future studies, a chin rest might improve the calibration and measurement reliability.
This study’s results have practical implications for risk communication. Physicians may use pictographs for risk communication with low numerates to address their holistic, gist-based information processing and to ensure their further elaboration on risk information. Physicians may also combine the pictograph with a numerical format (Garcia-Retamero & Cokely, 2013) such as percentage to improve communication with patients with high or low numeracy skills, since both groups were found to process both formats. Especially in time-limited, medical risk communication with patients, a combined format should be used to enable high and low numerates to process their preferred formats. Furthermore, physicians’ instructions to think carefully about the presented information may open up and broaden patients’ focus and encourage them to take into account all the relevant information. Reminding people to review the information carefully and to take as much time as needed to make their decision may thus also help people to process and use the information that they may not have used at first glance.
This study provides empirical evidence that low numerates benefit from pictorial risk communication formats, because these attract their attention in the initial, intuitive phase of numeric information processing. Thus, it ensures further elaboration on risk information, which is an important precondition of (medical) risk understanding and informed decision making (Lipkus & Peters, 2009). This high-powered study provided new insights into information processing in terms of the dependence on numeracy by ruling out some plausible assumptions concerning differences in processing. Despite the fact that there were differences in the order of information processing due to numeracy, no effect of numeracy on overall amount of attention to the percentage and the pictograph of the same probability information or on effort of processing the percentage and the pictograph was found. The study also showed that similar meanings of risk information can be derived from different ways of processing the information.
Aiken, L. S., & West, S. G. (1991). Multiple Regression: Testing and Interpreting Interactions. Thousand Oaks, CA: Sage Publication.
Ancker, J. S., Senathirajah, Y., Kukafka, R., & Starren, J. B. (2006). Design features of graphs in health risk communication: A systematic review. Journal of the American Medical Informatics Association, 13, 608–618.
Ashcraft, M. H., & Moore, A. M. (2009). Mathematics Anxiety and the Affective Drop in Performance. Journal of Psychoeducational Assessment, 27(3), 197–205. http://dx.doi.org/10.1177/0734282908330580.
Bridgeman, B. (1992). Conscious vs. unconscious processes - The case of vision. Theory & Psychology, 2(1), 73–88.
Cokely, E. T., Galesic, M., Schulz, E., Ghazal, S., & Garcia-Retamero, R. (2012). Measuring Risk Literacy: The Berlin Numeracy Test. Judgment and Decision Making, 7(1), 25–47.
Faul, F., Erdfelder, E., Buchner, A., & Lang, A. G. (2009). Statistical power analyses using G*Power 3.1: Tests for correlation and regression analyses. Behavior Research Methods, 41(4), 1149–1160. http://dx.doi.org/10.3758/Brm.41.4.1149.
Faul, F., Erdfelder, E., Lang, A. G., & Buchner, A. (2007). G*Power 3: A flexible statistical power analysis program for the social, behavioral, and biomedical sciences. Behavior Research Methods, 39(2), 175–191. http://dx.doi.org/10.3758/Bf03193146.
Finucane, M. L., Alhakami, A., Slovic, P., & Johnson, S. M. (2000). The affect heuristic in judgments of risks and benefits. Journal of Behavioral Decision Making, 13(1), 1–17.
Frederick, S. (2005). Cognitive reflection and decision making. Journal of Economic Perspectives, 19, 25–42.
Garcia-Retamero, R., & Cokely, E. T. (2013). Communicating Health Risks With Visual Aids. Current Directions in Psychological Science, 22(5), 392–399. http://dx.doi.org/10.1177/0963721413491570.
Glöckner, A., & Herbold, A. K. (2011). An eye-tracking study on information processing in risky decisions: Evidence for compensatory strategies based on automatic processes. Journal of Behavioral Decision Making, 24(1), 71–98. http://dx.doi.org/10.1002/bdm.684.
Glöckner, A., & Witteman, C. (2010). Beyond dual-process models: A categorisation of processes underlying intuitive judgement and decision making. Thinking & Reasoning, 16(1), 1–25.
Greene, B. A., & Miller, R. B. (1996). Influences on achievement: Goals, perceived ability, and cognitive engagement. Contemporary Educational Psychology, 21(2), 181–192. http://dx.doi.org/10.1006/Ceps.1996.0015.
Hawley, S. T., Zikmund-Fisher, B., Ubel, P., Jancovic, A., Lucas, T., & Fagerlin, A. (2008). The impact of the format of graphical presentation on health-related knowledge and treatment choices. Patient Education and Counseling, 73(3), 448–455. http://dx.doi.org/10.1016/j.pec.2008.07.023.
Hess, R., Visschers, V. H. M., & Siegrist, M. (2011). Risk communication with pictographs: The role of numeracy and graph processing. Judgment and Decision Making, 6, 263–274.
Hess, R., Visschers, V., Siegrist, M., & Keller, C. (2011). How do people perceive graphical risk communication? The role of subjective numeracy. Journal of Risk Research, 14(1), 47–61.
Holm, Linus; Eriksson, Johan; Andersson, Linus. (2008). Looking as if you know: Systematic object inspection precedes object recognition. Journal of Vision, 8(4), 1–4.
Horstmann, N., Ahlgrimm, A., & Glöckner, A. (2009). How distinct are intuition and deliberation? An eye-tracking analysis of instruction-induced decision modes. Judgment and Decision Making, 4, 335–354.
Horstmann, N., Hausmann, D., & Ryf, S. (2010). Methods for inducing intuitive and deliberative processing modes. In A. Gloeckner & C. Witteman (Eds.), Foundations for Tracing Intuition. New York: Psychology Press.
Keller, C. (2011). Using a familiar risk comparison within a risk ladder to improve risk understanding by low numerates: A study of visual attention. Risk Analysis, 31(10), 1572–1589.
Keller, C., & Siegrist, M. (2009). Effect of risk communication formats on risk perception depending on numeracy. Medical Decision Making, 29, 483–490.
Lipkus, I. (2007). Numeric, verbal, and visual formats of conveying health risks: Suggested best practices and future recommendations. Medical Decision Making, 27, 696–713.
Lipkus, I., & Peters, E. (2009). Understanding the role of numeracy in health: Proposed theoretical framework and practical insights. Health Ecucation & Behavior, 36(6), 1065–1081.
Lipkus, I., Samsa, G., & Rimer, B. K. (2001). General performance on a numeracy scale among highly educated samples. Medical Decision Making, 21, 37–44.
McMullan, M., Jones, R., & Lea, S. (2012). Math anxiety, self-efficacy, and ability in British undergraduate nursing students. Research in Nursing & Health, 35, 178–186.
Norman, E., & Schulte-Mecklenbeck, M. (2010). Take a quick click at that! Mouselab and eye-tracking as tools to measure intuition. In A. Glöckner & C. Witteman (Eds.), Foundations of Tracing Intuition (pp. 24-44). Hove: Psychology Press.
Peters, E. (2012). Beyond comprehension: The role of numeracy in judgments and decisions. Current Directions in Psychological Science, 21(1), 31–35.
Peters, E., Hibbard, J., Slovic, P., & Dieckmann, N. (2007). Numeracy skill and the communication, comprehension, and use of risk-benefit information. Health Affairs, 26, 741–748.
Peters, E., Slovic, P., Vastfjall, D., & Mertz, C. K. (2008). Intuitive numbers guide decisions. Judgment and Decision Making, 3(8), 619-635.
Peters, E., Västfjäll, D., Slovic, P., Mertz, C. K., Mazzocco, K., & Dickert, S. (2006). Numeracy and decision making. Psychological Science, 17, 407–413.
Reyna, V. F., Nelson, W. L., Han, P. K., & Dieckmann, N. F. (2009). How numeracy influences risk comprehension and medical decision making. Psychological Bulletin, 135(6), 943–973. http://dx.doi.org/10.1037/a0017327.
Rubaltelli, E., Dickert, S., & Slovic, P. (2012). Response mode, compatibility, and dual-processes in the evaluation of simple gambles: An eye-tracking investigation. Judgment and Decision Making, 7(4), 427–440.
Ryan, J., & Cohen, N. (2004). The nature of change detection and online representations of scenes. Journal of Experimental Psychology: Human Perception and Performance, 30, 988–1015.
Schulte-Mecklenbeck, M., Kühberger, A., & Ranyard, R. (2011). The role of process data in the development and testing of process models of judgment and decision making. Judgment and Decision Making, 6(8), 733–739.
Slovic, P., Finucane, M. L., Peters, E., & MacGregor, D. G. (2007). The affect heuristic. European Journal of Operational Research, 177(3), 1333–1352. http://dx.doi.org/10.1016/j.ejor.2005.04.006.
Tait, A. R., Voepel-Lewis, T., Zikmund-Fisher, B. J., & Fagerlin, A. (2010a). The effect of format on parents’ understanding of the risks and benefits of clinical research: A comparison between text, tables, and graphics. Journal of Health Communication, 15(5), 487–501. http://dx.doi.org/10.1080/10810730.2010.492560.
Tait, A. R., Voepel-Lewis, T., Zikmund-Fisher, B. J., & Fagerlin, A. (2010b). Presenting research risks and benefits to parents: Does format matter? Anesthesia and Analgesia, 111(3), 718–723. http://dx.doi.org/10.1213/ANE.0b013e3181e8570a.
Walker, C. O., Greene, B. A., & Mansell, R. A. (2006). Identification with academics, intrinsic/extrinsic motivation, and self-efficacy as predictors of cognitive engagement. Learning and Individual Differences, 16(1), 1–12. http://dx.doi.org/10.1016/J.Lindif.2005.06.004.
Weller, J. A., Dieckmann, N. F., Tusler, M., Mertz, C. K., Burns, W. J., & Peters, E. (2013). Development and testing of an abbreviated numeracy scale: A Rasch analysis approach. Journal of Behavioral Decision Making, 26(2), 198–212. http://dx.doi.org/10.1002/bdm.1751.
Zikmund-Fisher, B., Fagerlin, A., & Ubel, P. (2010). A demonstration of “less can be more” in risk graphics. Medical Decision Making, 30(6), 661–671. http://dx.doi.org/DOI:10.1177/0272989X10364244.
Copyright: © 2014. The authors license this article under the terms of the Creative Commons Attribution 3.0 License.
This document was translated from LATEX by HEVEA.