The environment matters: Comparing individuals and dyads in their adaptive use of decision strategies
Juliane E. Kämmer*
Wolfgang Gaissmaier#
Uwe Czienskowski%
Individuals have been shown to adaptively select decision strategies
depending on the environment structure. Two experiments extended this
research to the group level. Subjects (N = 240) worked
either individually or in two-person groups, or dyads, on a
multi-attribute paired-comparison task. They were randomly assigned to
two different environments that favored one of two prototypical
decision strategies—weighted additive or take-the-best
(between-subjects design in Experiment 1 and within-subject design in
Experiment 2). Performance measures revealed that both individuals
and dyads learned to adapt over time. A higher starting and overall
performance rate in the environment in which weighted additive
performed best led to the conclusion that weighted additive served
as a default strategy. When this default strategy had to be replaced,
because the environment structure favored take-the-best, the
superior adaptive capacity of dyads became observable in the form of a
steeper learning rate. Analyses of nominal dyads indicate that real
dyads performed at the level of the best individuals. Fine-grained
analyses of information-search data are presented. Results thus point
to the strong moderating role of the environment structure when
comparing individual with group performance and are discussed within
the framework of adaptive strategy selection.
Keywords: adaptive strategy selection, group decision making, environment structure.
1 Introduction
Imagine a group of geologists searching for profitable oil-drilling
sites for an oil company. Before this group can pick one of several
possible sites, it has to decide how to make this
decision. First, it needs to decide what information to search for and
in what order. Different methods are available for inferring the
quality of the available sites, such as chemical and seismic analyses,
which differ in their success rate. Second, the group needs to decide
when to stop searching for information and, third, how to integrate
the pieces of information to make a decision. For example, it could
commission all available analyses and weight and add the
results. Alternatively, it could proceed sequentially, starting with
the most successful method and deciding as soon as one result clearly
favors one site.
This example illustrates the idea that decision makers can choose from
a repertoire of different decision strategies, for which Gigerenzer,
Todd, and the ABC Research Group (1999) coined the term “adaptive
toolbox”. This idea goes back to Herbert A. Simon (1956), who saw
cognition as an adaptation to the environment. Different environments
require the use of different decision strategies to be successful, as
no single strategy will be universally superior (Gigerenzer &
Gaissmaier, 2011). A strategy is considered ecologically
rational to the degree that it matches the environment
structure. The important questions are whether people are good at
deciding how to decide, and how they do so. This fundamental problem
is known in the literature as the strategy selection problem (e.g.,
Payne, Bettman, & Johnson, 1988, 1993; Rieskamp & Otto, 2006).
Within the existing literature on adaptive strategy selection in
humans (e.g., Bröder, 2003; Christensen-Szalanski, 1978, 1980;
Marewski & Schooler, 2011; Payne et al., 1988, 1993; Rieskamp &
Hoffrage, 2008; Rieskamp & Otto, 2006), most of the research has
focused on adaptive decision making in individuals (for rare
exceptions see Kämmer, Gaissmaier, Reimer, & Schermuly, 2013;
Reimer & Katsikopoulos, 2004). Many decisions in real life, however,
are made in a social context, for example, under the advice of another
person (e.g., Bonaccio & Dalal, 2006) or in a group of people (Kerr
& Tindale, 2004; Levine & Smith, in press). In fact, teams are
ubiquitous in all sectors of organizations today, such as in the
healthcare system or aviation (Manser, 2009; Waller, 1999). Reasons
for this prevalence are mainly seen in (a) their potential superiority
to individuals, as they can combine multiple perspectives, areas of
expertise, and resources to work on complex problems (Larson,
Foster-Fishman, & Keys, 1994; Stasser, 1992) and (b) their large
potential for adaptation to a dynamic environment (Burke, Stagl,
Salas, Pierce, & Kendall, 2006; Randall, Resick, & DeChurch,
2011). The current study extends research on
the adaptive use of decision strategies to the group level and
addresses the following questions: Do groups learn to select the
decision strategy that fits best to a novel environment structure, and
how well do they do so in comparison to individuals?
Although we take the perspective of the adaptive toolbox, there are
alternative approaches. For example, a lively debate concerns
whether a Bayesian approach to cognition could be a universal strategy
(see, e.g., Jones & Love, 2011; for comments see Bowers & Davis,
2012a, 2012b; Griffiths, Chater, Norris, & Pouget, 2012). Other
single-strategy process models that are discussed are the parallel
constraint satisfaction (PCS) models (Glöckner & Betsch, 2008a;
Glöckner, Betsch, & Schindler, 2010; for a debate see Glöckner &
Betsch, 2010; Marewski, 2010) and sequential-sampling process models
such as the adaptive spanner perspective (Newell, 2005) and decision
field theory (Busemeyer & Townsend, 1993). Note that our goal was not
to test these perspectives against each other (see, e.g., Newell &
Lee, 2011) but to better understand performance differences between
individuals and groups in distinctive environments, for which we apply
the ecological rationality framework.
1.1 Comparing individuals with groups
Comparing individual with group performance has a long tradition in
psychology (e.g., Watson, 1928), which has documented both the
superiority of groups to individuals and their inferiority under
certain conditions. Some of the inconsistencies can be resolved by
taking the specific task context and methodology into account, as
performance of individuals and groups is a function of the available
resources, strategies for their use, task context, and methodology
(Bottger & Yetton, 1988; Hill, 1982) and—as we will show—the
environment structure (as also argued by Gigerenzer et al., 1999).
For a fair comparison between individual and group performance, it is
also important to specify the dependent measure: The performance of an
interactive (i.e., collective) group can be compared to (1) the
average individual performance, (2) the most competent member of a
statistical aggregate or nominal group (Hill, 1982), and/or (3) a
statistically pooled response (e.g., averaging continuous guesses in
research on the wisdom of crowds, see, e.g., Lorenz, Rauhut,
Schweitzer, & Helbing, 2011). For example, research shows that
collective groups outperform the average individual on intellective
tasks, which are tasks for which a correct answer exists and is
demonstrable (for an overview, see Kerr & Tindale, 2004). In tasks
with highly demonstrable answers, groups are likely to adopt the
opinion of the best member (“truth wins”) and may perform at the
level of that best member. Very few studies have shown that groups may
outperform their best members (e.g., Laughlin, Bonner, & Miner,
2002). In brainstorming research, on the other hand, collective groups
have been shown to underperform nominal groups in terms of quantity of
generated ideas (for an overview, see Stroebe, Nijstad, & Rietzschel,
2010). In terms of memory capacity, collective groups were shown to
remember more than the average individual but less than nominal groups
(Betts & Hinsz, 2010). These few examples illustrate that no general
conclusion concerning group superiority can be drawn and that the
comparison measure matters.
To assess group performance in our experiments, we therefore compared
it with the average as well as the best individual of a nominal group.
Besides providing a statistical benchmark, nominal groups can be seen
as simulating a group decision process, in which members observe each
other’s performance on the first trials or receive feedback about each
other’s performance in a similar task, and then agree on following the
suggestions of the best member instead of deciding on every trial
jointly. If collective groups perform below the level of nominal
groups, it may be due to coordination difficulties (Steiner, 1972),
production blocking (Diehl & Stroebe, 1987), or distraction (Baron,
1986). (A more comprehensive list of factors influencing group
performance positively as well as negatively can be found in Lamm &
Trommsdorff, 2006, and Steiner, 1972.)
By studying how well groups learn to use the appropriate strategy in
an unknown task environment, we extend research that compares
individual with group performance to a strategy-learning task. At the
same time we aim to broaden the decision-making literature, which has
focused on adaptive strategy selection in individuals (Bröder, 2003;
Rieskamp & Otto, 2006). For example, task characteristics such as
costs of information search or time pressure were found to foster
limited information search and noncompensatory ways of integrating
information (e.g., Bröder, 2003; Christensen-Szalanski, 1978, 1980;
Payne et al., 1988, 1993). Moreover, environment characteristics such
as the dispersion of cue validities and information redundancy have
been found to influence decision making in a systematic way (e.g.,
Dieckmann & Rieskamp, 2007; Rieskamp & Hoffrage, 1999; Rieskamp &
Otto, 2006). As groups can be conceptualized as information-processing
entities where cognition is distributed across individuals (De Dreu,
Nijstad, & van Knippenberg, 2008; Hinsz, Tindale, & Vollrath, 1997;
Levine & Smith, in press), and groups and individuals face similar
conditions when making decisions, we expect that the same principles
found for individuals also hold for groups. Our first hypothesis is
therefore that groups are able to learn to use appropriate decision
strategies contingent on the task environment. We ground this
prediction also on research on group decision making that has shown
that groups apply similar decision strategies to those applied by
individuals (Reimer, Hoffrage, & Katsikopoulos, 2007; Reimer &
Katsikopoulos, 2004). Last, we base our prediction on organizational
psychology research on the adaptive capacity of teams (i.e., the
capacity to gather information from the environment and “to make
functional adjustments”; Randall et al., 2011, p. 526) that
certifies groups adaptive performance when encountering novel
conditions in a number of applied settings (such as by airline crews,
Waller, 1999; see also Burke et al., 2006; LePine, 2003). We ran
exploratory analyses to test whether they would perform as well as the
best individual.
How quickly do groups learn to adapt their decision strategy? One
important mechanism behind strategy selection is learning from
feedback (Rieskamp & Otto, 2006). Although feedback generally
enhances learning and motivation (Nadler, 1979), studies in psychology
(e.g., Davis, 1969; Laughlin & Shippy, 1983; Tindale, 1989; see Hill,
1982, and Hinsz et al., 1997, for reviews) and behavioral economics
(Kocher & Sutter, 2005; Maciejovsky, Sutter, Budescu, & Bernau,
2010) have shown that groups require fewer feedback trials than the
average individual to reach asymptotic levels of learning. Reasons for
this superiority of groups may be a stronger reliance on memorization
(Olsson, Juslin, & Olsson, 2006) and better processing of feedback
information (Hinsz, 1990). This leads us to our second hypothesis that
groups will learn to adapt their decision strategy to an unfamiliar
environment over time faster than the average individual.
1.2 Two prototypical decision strategies
To investigate these hypotheses, we conducted two experiments with a
two-alternative forced-choice task, in which subjects had to select
the more profitable oil-drilling site. Each alternative (i.e.,
oil-drilling site) was described on a range of attributes (henceforth:
cues), such as the results of seismic analysis. In line with research
on individuals (e.g., Rieskamp & Otto, 2006), our focus was on
environments in which two prototypical decision strategies work well:
take-the-best (Gigerenzer & Goldstein, 1999) and weighted additive
(WADD). Both strategies make predictions about the information search
and choice behavior (Bröder, 2003; Payne et al., 1988; Rieskamp &
Otto, 2006), and their success depends on the environment structure.
Take-the-best looks up the best (i.e., most valid) cue for both
alternatives. If this cue discriminates between them (i.e., is
positive for one but negative for the other), take-the-best selects
the alternative with the positive cue value and ignores all other cues
(Gigerenzer & Goldstein, 1999). Think of our introductory example:
if the group considers seismic analysis as the most valid cue and if
this indicates a high quality for oil-drilling site X but not for Y,
the group would administer no further tests and would choose
oil-drilling site X. But if seismic analysis showed positive results
for both sites, a group using take-the-best would acquire the
next-best cue, and so on, until a discriminating cue was found. A
frequent criticism is that people violate the stopping rule and search
for more information than necessary, that is, acquire information
after the first discriminating cue (Newell & Shanks, 2003; Newell,
Weston, & Shanks, 2003). This is particularly common when information
search does not incur any costs (e.g., Dieckmann & Rieskamp,
2007). However, others have argued that it does not rule out
take-the-best when people look up too many cues as long as the final
choice is based on a single cue (see Hogarth & Karelaia, 2007). In
this regard, our experiment constitutes a challenging test bed as
information search did not incur any costs. We report a method for
testing whether unnecessarily acquired information influenced the
decision, which would more strictly speak against a consistent use of
take-the-best than the mere number of acquired cues (which is usually
taken, as done by: Newell & Shanks, 2003; Rieskamp & Dieckmann,
2012).
In contrast, WADD looks up all cues for both alternatives, multiplies
each cue value by its weight, and then selects the alternative with
the larger weighted sum. Variants of WADD take—instead of the
validities—chance-corrected validities (Glöckner & Betsch, 2008b)
or log odds as weights (termed naïve Bayes; Bergert & Nosofsky,
2007; Katsikopoulos & Martignon, 2006; Lee & Cummins,
2004). Strictly speaking, WADD is assumed to integrate all available
cues (e.g., Czerlinski, Gigerenzer, & Goldstein, 1999). However, WADD
also works with limited information search, if one assumes that WADD
searches cues sequentially according to their validity and stops
search as soon as no additional cue can overrule a preliminary
decision (as suggested by Rieskamp & Dieckmann, 2012). On this basis,
we can define “necessary information” as the minimum number of cues
WADD has to search for so that no additional cue could possibly
compensate for the decision based on the acquired cues. Searching for
fewer than necessary cues would violate the search rule of WADD
(Hogarth & Karelaia, 2007), but the predictions for choice do not
change. The advantage of these two models is that they formulate
testable predictions on information search, stopping, and choice
rules, which can also be tested in groups.
As this is the first study that examines the adaptive use of
take-the-best and WADD in groups, we also explored how groups
apply strategies as compared to individuals. Is accordance with the
strategy’s search and stopping rules higher in groups than in
individuals? Do groups apply strategies more consistently than
individuals (Chalos & Pickard, 1985)? We will explore these questions
on the basis of process and outcome data.
2 Experiment 1
Experiment 1 constitutes a first test bed for our assumptions on
adaptive strategy selection in groups as opposed to individuals. To
investigate whether subjects learn to select strategies adaptively,
that is, contingent on the environment structure, we randomly assigned
them to one of two environments, which were constructed to
discriminate between the use of take-the-best and WADD: Take-the-best
led to the highest performance in the take-the-best-friendly
environment and WADD in the WADD-friendly environment. In such
environments, people’s accordance with the best-performing (i.e.,
adaptive) strategy has been shown to increase over time when working
alone (Bröder, 2003; Bröder & Schiffer, 2006; Rieskamp & Otto,
2006). The task in each case was to select the more profitable of two
oil-drilling sites based on a range of cues, with outcome feedback
after each trial. Subjects were randomly assigned to work alone or in
same-sex two-person groups (hereafter: dyads).
2.1 Method
2.1.1 Subjects
Subjects included 120 people (60 females;
Mage = 26.3 years, SD = 3.7), of
whom 77% indicated being a student. Subjects received
€12.96 on average (SD = 0.83; €1
≈ $1.37 at the time). To complete the experimental task,
individuals took on average 36 min (SD = 12) and dyads 50 min
(SD = 21).
2.1.2 Design and procedure
The experiment had a 2 × 2 × 3 factorial design:
(Subject [individual, dyad] × Environment
[take-the-best-friendly, WADD-friendly] × Block). The first
two factors (Subject, Environment) were between subjects, the third
(Block) within subject. Upon arrival, subjects were randomly assigned
to one of the four between-subjects conditions, forcing equal cell
sizes of 20 units. Of the 120 subjects, 80 were assigned to the dyad
condition and 40 to the individual condition. For data analysis, each
dyad was counted as a unit, since the two subjects worked together.
Subjects were seated in front of a touch screen either individually or
in dyads. After answering demographic questions, subjects completed a
practice trial and then worked on the experimental task. Dyads were
encouraged to discuss their information search and to agree on a joint
decision (see Appendix A for instructions).
2.1.3 Experimental task
Figure 1: Screenshots of the task interface including six cues for each
oil-drilling site (X and Y) illustrating the search behavior of a
weighted additive strategy (WADD, left) and take-the-best
(right). WADD required looking up all cues to calculate the weighted
sum for each alternative. Take-the-best looked up the cue with the
highest validity (here: seismic analysis) first, and, as this one did
not discriminate, it looked up the cue with the second highest
validity (geophones) next. As this cue discriminated, take-the-best
reached a decision and ignored the remaining cues, which is why they
are still hidden (“?”).
The oil-drilling task (Czienskowski, 2004) is a MouseLab-like task
(Payne et al., 1988) that asks subjects to choose the more profitable
of two oil-drilling sites in a sequence of trials. Each oil-drilling
site was described by six cues and their validities (which correspond
to the actual validities in the set; see Figure 1). Validities in
decreasing order in both environments were (in percentages, with the
discrimination rates for the take-the-best-friendly and WADD-friendly
environment in parentheses): 78% (.35; .69), 71% (.54; .65), 65%
(.65; .77), 60% (.58; .58), 56% (.69; .69), and 53% (.58;
.58).1 Cues appeared in alphabetical
order. Cue validities and cue names were randomly paired once before
the experiment and stayed fixed throughout the experiment and for all
subjects. “Validity” was
described as the proportion of correct answers using that cue alone
when the cue was applicable (in German the word for "success" was used). The cues were framed as
tests that could be commissioned (i.e., clicked on) to inform
choice. Figure 1 illustrates the two decision strategies, WADD and
take-the-best, with screenshots of the task interface. At the
beginning of each trial, all boxes contained question marks. They
could be clicked on separately to reveal whether the cue had a
positive (“+”) or a negative (“−”) value, which remained visible
until a choice was made. Clicking on cues was cost free. Outcome
feedback followed each trial. For each correct choice, the subject’s
account increased by 1,000 petros, a fictitious currency,
equivalent to €0.10.
The task comprised three blocks, each consisting of the same set of
2 × 26 items (adapted from Rieskamp & Otto, 2006, Study 2; for
the complete item sets see Tables A.1 and A.2 in Appendix A). The
items within each block were randomly ordered for each subject with
the restriction that the oil-drilling sites on the left and right were
equally often correct. Overall, 50% of the total item set were
critical items, that is, items for which the two strategies make
opposing predictions. To create a WADD-friendly environment, items
were constructed by means of genetic algorithms such that WADD reached
an accuracy of 88%, while take-the-best reached an accuracy of only
62%. In the take-the-best-friendly environment, accuracies were
reversed: 88% for take-the-best and 62% for WADD.23
2.2 Results
The results section is structured as follows: We first investigate
whether subjects learned to adapt their strategy to the environment by
analyzing performance changes over the three trial blocks. If dyads were
faster than individuals, the performance difference should manifest itself
from the first to the second block. We thus compared the first with the
second and third block combined with a planned contrast. Performance
was measured as the percentage of correct trials out of the 156
trials. To better compare performance between individuals and dyads,
we also report analyses on nominal dyads. To evaluate the
adaptivity of strategy use, we focus on accordance rates with the
most appropriate strategy in each environment. Last, we test
how subjects conformed to the corresponding search and stopping
rules. Note that we have additionally analyzed the correspondence with
a range of alternative strategies (Tally, chance-corrected WADD, and
naïve Bayes). For clarity, we report the results of these extended
classification analyses only in Appendix C but summarize and discuss
them in the main text.
2.2.1 Performance
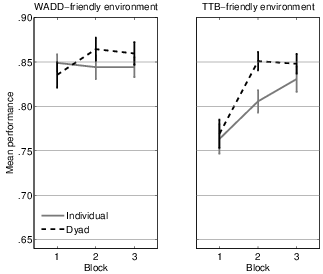
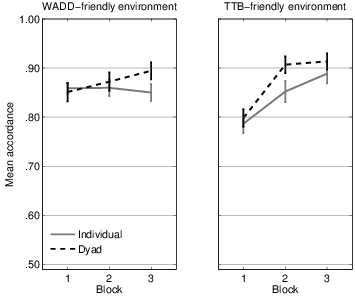
Figure 2: Mean performance per block of dyads (n =
20) and individuals (n = 20), in the WADD-friendly (left) and
take-the-best-friendly (TTB; right) environments. Error bars:
±1 SE.
To investigate performance changes over the three blocks, we conducted
a repeated-measures analysis of variance (ANOVA) with block
as a within-subject factor and environment and individuals vs.
dyads as between-subjects factors, and the accuracy per block as
dependent variable. Figure 2 depicts the results. Accuracy generally
increased over time, Fblock (1.65, 125.594) =
28.294, p< .001, ηp2 = .27
(Greenhouse-Geisser corrected). This improvement was more pronounced
in the take-the-best-friendly environment,
FBlock × Environment (2, 152) = 15.341,
p< .001, ηp2 = .17. Most importantly, we
observed a Block × Ind. vs. Dyad interaction,
FBlock × Ind. vs. Dyads (2, 152) =
4.588, p = .01, ηp2 =
.06. A planned contrast comparing block 1 with blocks 2 and 3 combined
revealed that individuals and dyads started from the same
level, but dyads then improved more quickly than individuals, F (1,
76) = 5.313, p = .02, ηp2 = .07. Overall, dyads were not better
than the average individual, however,
Find. vs. dyads (1, 76) = 1.84, p = .18,
ηp2 = .02. Last, mean
performance was lower in the take-the-best-friendly environment
(Mtake-the-best = .81, SD = .05) than in the
WADD-friendly environment (MWADD = .85,
SD = .05), Fenvironment (1, 76) =
11.779, p = .001, ηp2
= .13.
2.2.2 Comparison with the best individual
To create nominal dyads, all 20 individuals of the individual
condition in each environment were exhaustively paired, leading to 190
nominal dyads per environment. To determine the performance of each
nominal dyad, we took the performance of the “best” (i.e., most
accurate) member of a nominal dyad. “Best” was operationalized in
two ways: The best individual was the one who made more
accurate choices either (a) overall (“best member overall”) or (b) in the
first 26 trials, which equals half a block (“best member in 26
trials”). Measure (a) has been criticized for being accessible to
the researcher only a posteriori (Miner, 1984); Measure (b) is
supposed to reflect the idea that groups first determine their best
member and afterward adopt this person’s choices (Henry, 1995).
We found that in both environments real dyads
(Mtake-the-best = .82, SD = .05;
MWADD = .85, SD = .05) reached the
benchmark provided by the nominal dyads, be it by the best member
overall (Mtake-the-best = .83, SD = .04;
MWADD = .87, SD = .03) or by the
best member in 26 trials (Mtake-the-best = .82,
SD = .05; MWADD = .86, SD =
.04), but did not exceed it.4
2.2.3 Strategy use
To understand the reasons for the different learning curves, we next
explored the rates of accordance with the two best performing strategies,
take-the-best and WADD, in their respective environments. Accordance
rates measure how often the strategy predictions match the actual
choices and can be interpreted as a measure of consistency of using a
certain strategy. Accordance is highly correlated with performance
but differs conceptually: To illustrate, a consistent (100%) use of
the most appropriate strategy in each environment would have resulted
in a performance level of only 88%. Performance, on the other hand,
is a more neutral measure, being directly observable and allowing for
comparisons with other learning tasks.
Again, we conducted a repeated-measures ANOVA to study strategy use
over time. The three blocks were entered as the within-subject factor, the
two environments and individuals vs. dyads as between-subjects
factors, and the rate of accordance with the adaptive strategy as
dependent variable (Figure B.1 in Appendix B). Mirroring performance,
accordance generally increased over time,
Fblock (1.74, 132.40) = 41.530, p< .001, ηp2 = .35 (Greenhouse-Geisser
corrected). This increase was more pronounced in the
take-the-best-friendly environment, FBlock
× Environment (2, 152) = 22.695, p<
.001, ηp2 = .23. Again, we observed a Block × Ind. vs. Dyad
interaction,
FBlock × Ind. vs. Dyads (2, 152) = 3.284,
p< = .04, ηp2 = .04. A planned contrast comparing block 1 with
blocks 2 and 3 combined revealed that dyads adapted more quickly than
individuals in the take-the-best-friendly environment, F (1, 76) =
4.899, p< = .03, ηp2 = .06. A contrast comparing block 2 with
block 3 revealed in addition a three-way interaction: dyads were more
in accordance with WADD in the last block of the WADD-friendly
environment, F (1, 76) = 6.799, p = .01, ηp2 = .08.
No overall differences between individuals and dyads were revealed,
Find. vs. dyads (1, 76) = 2.195, p = .14,
ηp2 = .03.
2.2.4 Information search and stopping rule
As accordance rates have been criticized for being too imprecise to
reveal cognitive processes from behavioral data (Bröder & Schiffer,
2003), we provide in the following some additional measures to
validate the conclusion that subjects improved over time because they
learned to use the most appropriate strategy. In particular, we
looked at information search behavior and investigated how it accorded
with the information search and stopping rules predicted by
take-the-best and WADD. Before we could do that, however, we had to
determine the decision strategy each individual and dyad most likely
used. For this, we used Bröder and Schiffer’s (2003)
maximum-likelihood method of strategy classification. With this
method, the best-fitting model from take-the-best, WADD, Tally and
guessing5 can be determined,
where the fit is determined in reference to the likelihood of the
data given the model (see Bröder & Schiffer, 2003, for details).
In the take-the-best-friendly environment, 13 individuals and 18 dyads
were classified as adaptively using take-the-best, while in the
WADD-friendly environment 16 individuals and 18 dyads were classified
as adaptively using WADD.6 On the surface, they did
not differ in their information search, as these subjects searched in
both environments on average for 81.2% (SD = 15.6) of the available
information (ANOVA: all Fs < 2.9). The number of
cues was more than necessary for take-the-best (on average, 4.46 boxes
[SD = 2.01] were opened in addition to the first
discriminating cue in the take-the-best-friendly environment),
indicating that cost-free cues triggered extensive cue
acquisition. This is congruent with previous findings, which showed
that people may learn different strategies and apply different choice
rules even though they do not differ in their stopping rule
when there are no search costs (but they do differ as soon as search costs are
introduced; see Dieckmann & Rieskamp, 2007; Rieskamp & Dieckmann,
2012). In fact, searching for cues does not necessarily imply that the
cues are integrated; search is often continued to enhance confidence
in decisions already made (Harvey & Bolger, 2001; Newell et al.,
2003; Svenson, 1992).
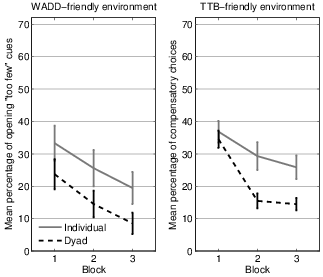
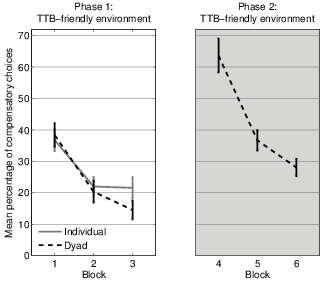
Figure 3: Two measures of strategy use concerning the stopping rule, in the
WADD-friendly environment (left) and in the take-the-best friendly
environment (right). The left panel depicts the relative frequency of
cases in which too few cues were looked up, that is, cues that should have been
opened so that the decision could not be overruled by additional
evidence. This measure was calculated for the 16 individuals and 18
dyads who were classified as adaptive WADD users. The right panel
depicts the proportion of those trials in which people decided against
the first discriminating cue based on less valid cues that were
additionally opened, although, according to take-the-best, these less
valid cues should not have overruled the first discriminating
cue. This measure was calculated for the 13 individuals and 18 dyads
who were classified as adaptive take-the-best users. Error bars:
±1 SE.
In a next step, we analyzed information search over time and now
introduce two more fine-grained measures of strategy use: (1) To
validate WADD as a choice rule, we checked how often subjects who were
classified as adaptive WADD users opened fewer cues than necessary, in
short “too few” (recall that necessary means that no further
evidence would overrule the decision based on the acquired cues). (2)
To validate take-the-best as choice rule, we analyzed those cases in
which subjects who were classified as adaptively using take-the-best
opened less valid cues that contradicted the first discriminating
(more valid) cue, and checked whether this less valid cue overruled
their decision—which, according to take-the-best, it should not. In
other words, we counted how often the decision of take-the-best users
was overruled by compensatory evidence (“compensatory choices”).
Figure 3 depicts the results for these two measures. In the left
panel, the results concerning the WADD users can be seen. It shows
that in the first block, WADD users opened fewer boxes
than necessary in about 30% of cases, which decreased over blocks to 16%,
Fblock (1.454, 46.531) = 16.907, p< .001, ηp2 = .35 (Greenhouse-Geisser corrected),
with no differences between individuals and dyads,
Find. vs. dyads (1, 32) = 3.104, p
= .09, ηp2 = .09. In other words, all WADD users became more
consistent with their search rule but still showed some deviations.
In the right panel of Figure 3, the results concerning the
individuals classified as adaptive take-the-best users can be seen. It
shows the percentages of those cases in which subjects saw
contradictory evidence7
that overruled the decision suggested by take-the-best. In the
first block, individuals and dyads decided in around 35% of cases, in
which they saw contradictory evidence, against take-the-best. Over
time, this proportion decreased, indicating a growing consistency in
using take-the-best, Fblock (2, 52) = 29.909,
p< .001, ηp2 = .54, and it did so more
strongly for dyads (where it decreased to about 15%) than for
individuals (where it decreased to about 25%),
FBlock × Ind. vs. Dyads (2, 52)
= 3.654, p = .03, ηp2 = .12. Again, dyads were faster,
which was revealed by a planned contrast comparing block 1 with
blocks 2 and 3 combined, F (1, 26) = 5.744, p = .02,
ηp2 = .18.
2.3 Summary
In Experiment 1 we sought to test how well
individuals and dyads performed in an unknown task environment and
if they learned to select the appropriate strategy. It provided some evidence
that not only individuals but also dyads are able to adapt to
different, but stable environment structures.
Dyads even showed a faster adaptation process, but they did not
surpass the best individual, on average. The high
performance rates were supported by the finding that the majority of
subjects were classified as using the adaptive strategy. When looking
at only the two prototypical strategies (WADD and take-the-best),
accordance rates mirrored performance results and indicated a more
consistent (though not a perfect) use of take-the-best by dyads.
Convergent evidence came from process measures: information search
became more consistent over time, and again to a greater extent for
dyads in the take-the-best-friendly environment. Still, deviations
from strategy predictions concerning information search amounted to
15% and 25% for those being classified as using the
appropriate strategy in the two environments, respectively.
To summarize the extended classification results for six
strategies (see Appendix C), we found again that, in the
take-the-best-friendly environment, more dyads (n = 17) than
individuals (n = 14) were classified as using one of the three
best performing strategies, though not the very best one (n = 7
dyads, n = 6 individuals were classified as take-the-best users). In
the WADD-friendly environment, all individuals and dyads were
classified as using one of the three best performing strategies,
though more dyads than individuals were classified as using the very
best (n = 17 dyads, n = 10 individuals classified as WADD users).
3 Experiment 2
In Experiment 2 we sought to replicate the findings of Experiment 1
and extend them to a task in which environment structures changed over
time so that a new strategy had to be learned. Experiment 2 thus
comprised two phases: the learning phase, which was identical to
Experiment 1 and varied the environment structure between subjects,
and the relearning phase, in which subjects were confronted with the
alternative environment. Consequently, each subject encountered both
environments (the take-the-best friendly and the WADD friendly) from
Experiment 1, one after the other. Experiment 2 thus provides a
stricter test for adaptive strategy selection by varying the
environment structure within subjects, as Payne et al. (1988) have
suggested.
Because Experiment 2 contained a change in the environment that rendered
another strategy adaptive, it differed in some important aspects from
Experiment 1. While the learning phase of Experiment 2 was equivalent
to Experiment 1 (with the difference that people were informed at the
beginning that there would be two phases), the relearning phase of
Experiment 2, though structurally corresponding to the learning phase,
required additional subtasks. These subtasks were (a) to detect the
need for change, (b) to find and apply a new and better strategy than
the one selected in the learning phase, and (c) to overcome a—now
maladaptive—routine established in the learning phase.
When people are faced with familiar problems, routinized decision
behavior has many advantages, such as allowing for efficiently dealing
with a situation and for immediately reacting and performing well. On
the group level, having developed a routine reduces the need for
consideration, coordination, and negotiation (Gersick & Hackman,
1990). When a situation changes, however, and some novel decision
behavior is—unnoticeably—required, routines become maladaptive. In
fact, individuals as well as groups have difficulty overcoming
maladaptive routines, especially with increasing routine strength or
when they are under time pressure (e.g., Betsch, Fiedler, &
Brinkmann, 1998; Betsch, Haberstroh, Glöckner, Haar, & Fiedler,
2001; Bröder & Schiffer, 2006; Reimer, Bornstein, & Opwis, 2005;
for a review of theories, see Betsch, Haberstroh, & Höhle,
2002). The additional requirements make the relearning phase more
difficult than the learning phase of Experiment 2 and more difficult than Experiment
1. We thus expected an overall lower performance in the relearning
phase. This enhanced difficulty has one additional advantage though, as it
leaves more room for learning to take place. In fact, one could argue
that in Experiment 1 the lack of learning in the WADD-friendly
environment was due to a ceiling effect, as subjects, both
individuals and dyads, had started out with an already very high
accordance to WADD. If performance is already high and people do not
know the upper benchmark of performance, they might not see any need
to change their strategy, which might have been one reason for the lack of
further improvement in the WADD-friendly environment in Experiment 1.
3.1 Methods
3.1.1 Subjects
Subjects included 120 people (60 females;
Mage = 24.2 years, SD = 3.7), of
whom 83% indicated being a student. Subjects received €24.40
on average (SD = 1.55). To complete the oil-drilling task,
individuals took on average 53 min (SD = 15) and dyads 72 min
(SD = 24).
3.1.2 Design and procedure
Again, the experiment had a 2 × 2 × 3 (Subject
[individual, dyad] × Starting Environment [take-the-best
friendly, WADD friendly] × Block) factorial design, with
phase as an additional factor (Phase 1, Phase 2). The first two
factors were between subjects, the third and fourth within
subject. Upon arrival, subjects were randomly assigned to one of the
four between-subjects conditions, forcing equal cell sizes of 20
units. As in Experiment 1, subjects worked with a touch screen either
individually or in same-sex dyads, and, again, dyads were treated as
single subjects for purposes of analysis. After answering demographic
questions, subjects completed a practice trial and then worked on the
experimental task, which was exactly the same in each phase as in
Experiment 1. The difference was that this time all subjects worked on
the two environments consecutively, one half first on the
take-the-best-friendly environment and then on the WADD-friendly
environment with a break in between, the other half in the reverse
order. Subjects were told at the very beginning that they had to work
on two phases, finding profitable oil-drilling sites first in the
United States and then in Argentina (or vice versa, counter-balanced
per environment). We provided this country hint in all conditions to
suggest to subjects that something might have changed and to thereby
secure a minimum level of adaptivity; it has previously been shown
that without a hint almost no adaptivity is observed in a changing
environment, resulting in a floor effect (Bröder & Schiffer, 2006).
3.2 Results
3.2.1 Performance
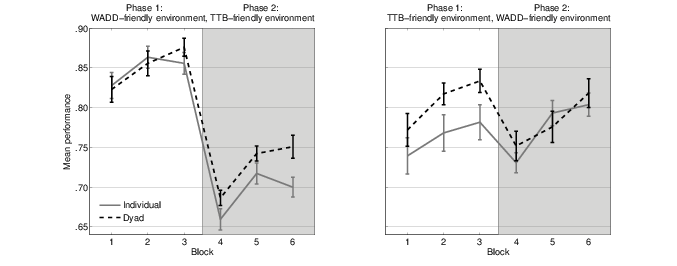
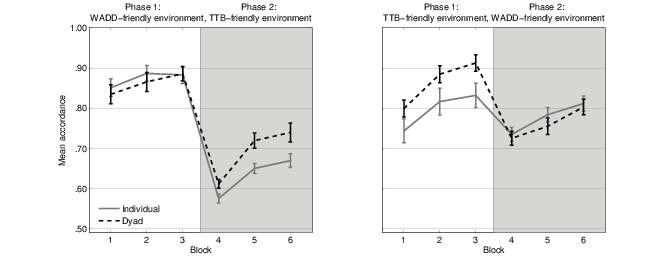
Figure 4: Individuals’ and dyads’ average performance in the two
experimental orders: The left panel depicts the rates of
performance with the adaptive strategies in the experimental order
of first the WADD-friendly and then the take-the-best-friendly
environment; the right panel depict the results for the reverse
order. Error bars: ±1 SE.
To study performance differences between the two environments and
between individuals and dyads over the two phases, we conducted a
repeated-measures ANOVA with the three blocks and the two phases as
within-subject factors, the order of environments and individuals vs.
dyads as independent variables, and the percentage of correct trials
as dependent variable. As can be seen in Figure 4, performance
generally increased over time in both phases,
Fblock (1.82, 138.57) = 90.458, p< .001, ηp2 = .54 (Greenhouse-Geisser
corrected). Dyads were on average better than individuals,
Find. vs. dyads (1, 76) = 3.939, p
= .05, ηp2 = .05. This difference was moderated by phase and
order of environments, FPhase × Ind.
vs. Dyads × Order (1, 76) = 3.601, p = .06,
ηp2 = .05: Dyads who started with the take-the-best-
friendly environment achieved a higher performance than individuals in
this environment (Mdyads =
.81, SD = .07 vs. Mind. = .76,
SD = .10), but did not differ in the second (WADD-friendly)
phase (Mdyads = .78, SD = .08 vs.
Mind. = .78, SD = .06). Individuals
and dyads who started with the WADD-friendly environment achieved a
similarly high performance in this environment
(Mdyads = .85, SD = .06 vs.
Mind. = .85, SD = .06), but
individuals’ performance then dropped to a larger degree in the second
(take-the-best-friendly) phase than that of dyads
(Mdyads = .73, SD = .04 vs.
Mind. = .69, SD = .05). Moreover,
different learning curves were observable: individuals mainly improved
from the first to the second block, though this time not to a lesser
degree (which was revealed by a planned contrast comparing block 1
with blocks 2 and 3 combined, F (1, 76) = 0.282, p =
.60, ηp2 = .004). But dyads kept on improving to reach a
higher final level, FBlock × Ind.
vs. Dyads (2, 152) = 3.617, p = .03, ηp2 = .05,
which was supported by a contrast comparing the second with the third
block, F (1, 76) = 9.166, p = .003, ηp2 =
.11.
As expected, average performance of all subjects dropped from the
first to the second phase, Fphase (1, 76) =
63.416, p< .001, ηp2 = .46. In other words,
subjects suffered from the change in the environment. However, the
direction of change played an important role. Learning to apply WADD
in the second (relearning) phase when it had not been adaptive before
was more likely than adopting take-the-best as a novel strategy. In
both phases, performance was higher in the WADD-friendly environment
than in the take-the-best-friendly environment. Thus,
the drop from the first to the second phase was much less pronounced
when the WADD-friendly environment constituted the second environment
than when the take-the-best-friendly environment came second,
FPhase × Environment (1, 76) =
52.855, p< .001, ηp2 = .41, indicating a
preference for WADD. As a result, when the take-the-best-friendly
environment constituted the starting environment, subjects’
performance did not differ between the phases. This was not the case
in the reverse experimental order.
3.2.2 Comparison with the best individual
Again we compared the performance of real dyads with that of nominal
dyads. Nominal dyads were composed by exhaustively pairing the 20
individuals of the individual condition of each environment, and
performance was determined by giving each nominal dyad the score
obtained by the better of the two individuals (“best member overall”
and “best member in 26 trials”). In the take-the-best-friendly
environments, real dyads (Mphase 1 = .81,
SD = .07; Mphase 2 = .73,
SD = .04) reached the baseline provided by the nominal dyads
in both phases, be it by the best member overall
(Mphase 1 = .82, SD = .05;
Mphase 2 = .73, SD = .03) or the
best member in the first 26 trials (Mphase 1
= .81, SD = .05; Mphase 2 = .71,
SD = .04). Also in the WADD-friendly environments, real dyads
(Mphase 1 = .85, SD = .06;
Mphase 2 = .78, SD = .08) were close
to the performance of the best member overall
(Mphase 1 = .88, SD = .03;
Mphase 2 = .81, SD = .04) and of the
best member in 26 trials (Mphase 1 = .87,
SD = .03; Mphase 2 = .79,
SD = .05).
3.2.3 Strategy use
Strategy use over time (i.e., accordance rate of the adaptive strategy
in each environment) was entered into a repeated-measures ANOVA with
the three blocks and two phases as within-subject factors, and the
environment of the first phase and individuals vs. dyads as
independent variables (see Figure B.2 in Appendix B).
Within each phase, accordance generally increased over time,
Fblock (1.693, 128.705) = 119.992, p< .001, ηp2 = .61 (Greenhouse-Geisser
corrected). Like performance, average accordance with the adaptive
strategy dropped from the first phase to the second,
Fphase (1, 76) = 100.145, p< .001, ηp2 = .57;
this drop was particularly deep when subjects were confronted with the
take-the-best-friendly environment in the second phase,
FPhase × Environment (1, 76) =
28.770, p< .001, ηp2 = .28; and increase in
accordance was steepest in this environment and phase too,
FBlock × Phase ×
Environment (2, 152) = 12.594, p< .001,
ηp2 = .14. Overall, accordance with the adaptive strategy was
lower in the take-the-best-friendly environment than in the
WADD-friendly environment, Fenvironment (1,
76) = 7.132, p = .01, ηp2 = .09.
Dyads achieved in both phases higher accordance rates with
take-the-best in the take-the-best-friendly environment than
individuals, but slightly lower accordance rates with WADD in the
WADD-friendly environment in both phases,
FPhase × Ind. vs. Dyads
× Environment (1, 76) = 8.201, p = .01, η
p2 = .10, so that dyads only
slightly surpassed individuals in overall accordance with the most
adaptive strategy (Mindividuals = .77,
SD = .06 vs. Mdyads = .80,
SD = .06), Find. vs. dyads (1, 76)
= 3.454, p = .07, ηp2 = .04.
3.2.4 Information search and stopping rule
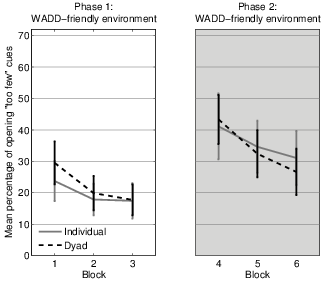
Figure 5: Mean percentage of trials in which “too few” cues were opened by subjects who
were classified as WADD users in the WADD-friendly environment, in
the first phase (left; n = 18 individuals and n = 18 dyads) and in
the second phase (right; n = 13 individuals and n = 13
dyads). Error bars: ±1 SE.
Again we used the maximum-likelihood method of Bröder and Schiffer
(2003) to classify subjects as using one of the following strategies:
take-the-best, WADD, Tally, or guessing (for results concerning the
classification with six strategies, see Tables C.2 and C.4 in Appendix
C). In the first phase, 15 individuals and 17 dyads were classified as
adaptively using take-the-best in the take-the-best-friendly
environment. In the WADD-friendly environment, 18 individuals and 18
dyads were classified as using WADD. In the second phase, no
individual and only seven dyads were classified as adaptively using
take-the-best in the take-the-best-friendly environment. In the
WADD-friendly environment, more subjects, namely, 13 individuals
and 13 dyads, were classified as adaptively using WADD, probably
indicating that WADD was either easier to learn or a default strategy
when encountering a changing environment, as others have argued
before (e.g., Bröder & Schiffer, 2006).
Figure 6: Average proportion of those trials in which people decided against
the first discriminating cue based on less valid cues that were additionally opened
(i.e., contradictory evidence), in the first (left) and in the second
(right) phase in the take-the-best-friendly environment. This measure
was calculated for those subjects who were classified as
adaptive take-the-best users (phase 1: n = 15 individuals and n =
17 dyads; phase 2: n = 7 dyads). Note that no individuals were
classified as take-the-best users in the second phase, so no
results can be displayed for individuals in the right panel. Error
bars: ±1 SE.
We then restricted the number of subjects to the adaptively classified
and entered individuals vs. dyads and the environment as independent
variables and the percentage of acquired cues as dependent variable
into an ANOVA for the first phase. It revealed that all subjects in the first phase
searched for more information in the WADD-friendly environment
(M = 84.3%, SD = 14.0) than in the
take-the-best-friendly environment, where search was still quite high
(M = 69.1%, SD = 20.4),
Fenvironment (1, 66) = 12.899, p =
.001, ηp2 = .16. Due to the lack of individuals classified as
take-the-best users in the second phase, only a comparison within dyads
was possible. Here, the mean number of acquired cues was not an
indicator of strategy use, as no differences were revealed between
environments (overall M = 77.8%, SD = 14.3). This
amount of information acquisition again exceeded the amount required
by take-the-best (on average, 3.75 boxes [SD = 2.12] were
opened after the first discriminating cue in the first phase and 6.59
boxes [SD = 1.72] in the second phase in the
take-the-best-friendly environment).
We next analyzed how often fewer cues than necessary were opened by
the adaptive WADD users. The left panel of Figure 5 depicts the
results for the first phase. An ANOVA with repeated measures revealed
that individuals and dyads became more consistent with the WADD
stopping rule over time, opening in around 27% of trials fewer boxes than necessary in the
first block, which decreased over blocks to 18% of trials,
Fblock (2, 68) = 11.354, p< .001, ηp2 = .25. In the second phase (right panel
of Figure 5), subjects started with opening in 42% of trials on
average too few cues, which decreased to a proportion of around 29%
in the last block, again indicating an increasing consistency with
WADD, though the absolute numbers were higher than in the first phase,
Fblock (1.220, 29.277) = 5.808, p =
.01, ηp2 = .20 (Greenhouse-Geisser corrected).
The two panels of Figure 6 depict the proportion of trials in which
individuals classified as adaptive take-the-best users saw contradictory
evidence after the first discriminating cue
and—being influenced by this evidence—chose the option not
favored by the first discriminating cue. As in Experiment 1, a steady
decrease in those compensatory choices was observable in the first
phase, though without differences between individuals and dyads,
reaching a final level of about 20%, Fblock
(2, 60) = 26.985, p< .001, ηp2 = .47. In
phase 2, no comparison between individuals and dyads was possible as
only seven dyads but no individuals were classified as adaptive
take-the-best users. Dyads showed a similar decreasing trend as in phase 1, though on
a higher absolute level with a final level of around 29%,
Fblock (2, 12) = 39.148, p< .001, ηp2 = .87.
3.3 Summary
In sum, Experiment 2 mainly replicated the findings of Experiment 1
and tested them in a relearning phase. In the learning phase, dyads
were superior to individuals in learning to adaptively follow
take-the-best but did not differ in following WADD. The relearning
phase apparently constituted a much harder test bed, with
performances much lower than in the learning phase. Again, dyads
were superior to individuals in learning to adaptively follow
take-the-best but did not differ in following WADD. Dyads performed at
the level of the best members. Strategies were more consistently used
in the first phase than in the second, and dyads applied take-the-best
more consistently than individuals, which was indicated by accordance
rates and was shown more clearly by the classification, which revealed
that no single individual was using take-the-best in the second
phase. However—and similar to Experiment 1—consistency was not
perfect, as deviations in the range of 18% to 29% of trials from the predicted
information search were observed.
In summary of the extended classification results for six
strategies (see Appendix C), in the WADD-friendly environment, again
the vast majority of subjects were classified as using one of the
three best performing strategies. This holds true for both
phases (phase 1: n = 20 dyads, n = 19 individuals; phase 2: n = 18
dyads, n = 18 individuals). In the take-the-best-friendly environment
in phase 1, more dyads (n = 12) than indivduals (n = 8) were
classified as using one of the three best performing
strategies. However, the proportion of individuals and dyads being
classified as using take-the-best was equal (and low with n = 4 out of
20). In the take-the-best-friendly environment in phase 2, again more
dyads (n = 6) than indivduals (n = 1) were classified as using one of
the three best performing strategies, and 2 dyads and 0 individuals
were classified as using take-the-best. In other words, these analyses
suggest that most people were not able to find the very best strategy
when WADD was not adaptive but that dyads learned to apply
one of the three most successful strategies relatively more often than
individuals.
4 Discussion
Applying the appropriate decision strategy in a given environment can
have direct implications for one’s payoff. Two experiments were
conducted to investigate whether and how well two-person groups
(dyads), as opposed to individuals, adaptively select decision
strategies that exploit the structure of two unfamiliar task
environments. In detail, the two task environments were designed so
that the most successful decision strategies differed in their
information search, stopping, and choice rules: the
take-the-best-friendly environment required subjects to limit
collecting evidence and to ignore less valid information that
contradicted more valid information and to base their decisions on the
most valid discriminating cue. The WADD-friendly environment, in
contrast, required subjects to collect all the available pieces of
information about both alternatives for at least as long as no further
evidence could overrule the decision based on the acquired information
and to base their decisions on the weighted sum of collected
information. Thus, the use of the most appropriate strategies secured
a high performance in the respective environment.
4.1 Performance differences between individuals and groups,
and between environments
We hypothesized that groups would be able to adapt their strategy
selection as well as the average individual did and explored whether
they would even surpass the level of the best individual. We further
expected to find a faster learning rate in groups, taking research on
other learning tasks as a benchmark (e.g., Hinsz et al., 1997).
In fact, we found that groups were on average as good as the average
individual in Experiment 1 and somewhat better in Experiment 2. We can
thus conclude that no process losses, such as from distraction or
social inhibition (e.g., Steiner, 1972), hindered group performance in
this strategy selection task. How well did groups perform in
comparison to the best individual? Recall that a mere statistical
reason for high group performance might be that groups have a higher
probability of containing at least one individual who is above the
mean ability level of people working alone (Lorge & Solomon,
1955). To look into this, we compared performance levels of the
interacting groups with that of the best member of nominal groups. We
found that real groups performed by and large as well as the best
individuals in both environments and both experiments. In other words,
one possible mechanism behind the high group performance we observed
could be that groups identified their best member and adopted this
person’s choices (and hence could not become better than the
best). This finding might be used to argue against investing in
(time-consuming) group interaction. Some caution is warranted, though,
because another conclusion could be that it is of sufficient interest
for groups to reach the potential given by the performance of their
best member, since groups rarely perform better than individuals,
according to a vast amount of literature (e.g., Kerr & Tindale, 2004;
Laughlin et al., 2002; Tindale & Sheffey, 2002), possibly because
groups usually have difficulty identifying their best member without
help (e.g., Henry, 1995; Henry, Strickland, Yorges, & Ladd,
1996). Even more relevant may be that group decision making has other
advantages, such as legitimacy and acceptance, which may play an
important role in many organizational contexts (see Allen & Hecht,
2004, for more benefits).
Aside from overall performance differences between individuals and
groups were apparent differences between the learning speeds of
individuals and dyads, with the type of environment being an important
moderator: The learning curve in the take-the-best-friendly
environment was steeper for groups than for individuals, with either
individuals reaching the same level of performance in the final block
(Experiment 1) or groups staying on a higher level in all blocks
(Experiment 2). In the WADD-friendly environment, in contrast,
individuals and dyads performed on a similarly high level
throughout. Overall, performance was higher in the WADD-friendly
environment than in the take-the-best-friendly environment and
particularly in the first block, although it did diminish over time.
In the relearning phase of Experiment 2, routine effects led to an
overall decrease in performance, but mostly when the
take-the-best-friendly environment was encountered second. Such
negative transfer effects have been widely documented before (e.g.,
Betsch & Haberstroh, 2005). But, although individuals and groups
started at a similarly low performance levels in Phase 2, the groups’
superiority again became apparent: Groups’ performance was more likely
to recover, whereas only the best individuals were successful in doing
the same, as the comparison with nominal groups suggests. In fact, not
a single individual was classified as adaptively using take-the-best
in the second phase, but seven groups were. Our finding that most
people were able to adapt to the environment when it was new (phase 1)
but had difficulties in discovering the most appropriate strategies in
the relearning phase replicates previous results in similar tasks with
individuals only (see e.g., Bröder, 2012 for an overview). Bröder
(2012) speculated that different cognitive processes might come into
play in these two distinct tasks: deliberate and effortful learning in
a new situation versus slow reinforcement learning (e.g., Rieskamp &
Otto, 2006) in a known situation. Our finding also suggests that
giving people many opportunities to encounter a novel task that
requires abandoning a routine is especially beneficial for groups,
although they might appear as more prone to routines than individuals
in the first place (Reimer et al., 2005).
In sum, this study highlights the strong moderating role of the
environment when comparing individual with group performance. Two
findings stand out that will be considered in more depth in the
following: (1) the higher performance from the first block on in the
WADD-friendly environment as compared to the take-the-best-friendly
environment, and (2) the apparent differences between individuals and
groups in the learning curves within the take-the-best-friendly
environment.
4.1.1 What explains the higher performance in the WADD-friendly environment?
In fact, the observed asymmetry in favor of WADD is a common finding
in research with individual decision makers (Bröder, 2003; Bröder
& Schiffer, 2003, 2006; Rieskamp & Otto, 2006) and here it is
extended to the group level. It can be interpreted in several ways:
First—and with special consideration of the asymmetry from the first
block on—it may simply reflect an exploration phase, in which people
try to get a sense of which pieces of information are useful before
settling on a decision strategy (McAllister, Mitchell, & Beach,
1979). Similarly, it may be attributable to an adaptive
behavior. Hogarth and Karelaia (2006) argued from a prescriptive
perspective that in unknown environments linear models perform better
than one-reason decision strategies. In fact, explorative strategies
of novices, for example, often look like WADD, while that of experts
rather look like take-the-best (Garcia-Retamero & Dhami, 2009). On
the other hand, the observed asymmetry may reflect a deliberate
decision to integrate all pieces of information because of the belief
that “more is better” (Chu & Spires, 2003). From a descriptive
perspective, it may thus reflect an overgeneralization of the
applicability of normally reasonable strategies (Payne et al., 1993,
p. 206) and may have been enhanced by leading the subjects to focus
on accuracy, which has been found to foster WADD (Creyer, Bettman, &
Payne, 1990).
Last and somewhat critically, one could argue that the experimental
setting as such may lead to a general demand effect, whereby subjects
feel obliged to integrate all pieces of information offered (for a
similar argumentation see Bröder, 2012). In particular, our
MouseLab-like experimental setup probably set conditions that favored
the use of a strategy that integrates all available information (such
as WADD) by default (Glöckner & Betsch, 2008b), as searching for
information did not incur any costs, all pieces of information were
clearly presented on the screen upon request, and there was no time
pressure (see e.g., Bröder, 2003). If a setting that triggers WADD
as a default strategy has at the same time a WADD-friendly environment
structure, applying WADD (or similarly information-intense strategies)
turns out to be successful from the very beginning, and accordance
with it will stay high. In contrast, if a setting has an underlying
take-the-best-friendly environment, the default strategy has to be
(deliberately) abolished and a new strategy learned (here: one that
ignores information!), leading to performance declines in the
beginning. This might be the reason for the observed performance
differences between environments. More research is needed on the role
of the specific features of the setting (such as the time or costs for
acquiring information) in performance changes in a strategy selection
task by individuals and groups.
4.1.2 Did subjects apply the most appropriate strategies?
Before we elaborate on the within-environment differences between
individuals and groups, we briefly review the issue of which
strategies subjects most likely used in the two environments. First,
the high performance level we observed can be seen as an indirect
indicator that our subjects actually used the appropriate
strategies. Support for this interpretation comes from more direct
indicators, which were the number of subjects being classified as
using the respectively most appropriate strategy and their accordance
rate with the information search, stopping, and choice rules. The
information search measures revealed an increasing consistency in the
use of the appropriate information search and stopping rule over time
and again a higher consistency by groups than by individuals in the
take-the-best-friendly environment. This higher decision consistency
in groups is consistent with work by Chalos and Pickard (1985). Also,
the classification supported the superiority of groups over
individuals. The conclusion that most individuals and groups indeed
learned to apply the single best strategy requires caution,
however. One limiting factor is the observed extent of deviations from
the predicted information search rules, which ranged from 15% to
29%, even in the final block. Despite the plausibility of the
measures we used and the insights they provide into strategy use, only
a restricted evaluation is possible, as no established thresholds
exist and no comparison of the observed absolute deviations with
previous studies is possible. Future studies should further validate
these measures.
Another limiting factor is the result from the extended classification
analyses, where we considered six instead of only four strategies for
classification (see Appendix C).8 Although take-the-best and WADD have
been identified as two prototypical decision strategies (Bröder,
2003; Rieskamp & Otto, 2006), many more decision strategies are
assumed to be part of the toolbox (for an overview see table A.1-1 in
Todd & Gigerenzer, 2012, pp.8-9), and other strategies besides those
two performed well in the two environments (though not as well as
take-the-best and WADD, respectively; see Appendix C). Our extended
strategy classification analyses give credence to this notion. Here,
we found that the majority of subjects learned to adopt one of the
three most successful strategies (though not necessarily the single
best) in a given environment. While in the WADD-friendly environment
the range of classified strategies was rather small and most were
classified as WADD users, subjects in the take-the-best-friendly
environment were distributed over a wider range of strategies so that
only up to a third was classified as using take-the-best. The
distribution of subjects over different strategies can be interpreted
as a sign of individual preferences or of the learning states subjects
were in (assuming that people learn the more successful strategies
over time, see Rieskamp & Otto, 2006). But it can also be seen as a
sign that take-the-best in fact played only a minor role in people’s
strategy choice, which is further supported by the observed deviations
from information search and stopping rules. Having in mind the
explanation that WADD seems to serve as a default strategy, it is only
plausible that subjects also selected different strategies than
take-the-best, as it is not the only alternative to WADD. This holds
particularly true as take-the-best was not explicitly favored by
apparent environmental characteristics (such as noncompensatory
weights, costs for information search).
Still another explanation of our data is that subjects stayed with one
single weighted additive strategy in both environments but adapted cue
weights and information search given feedback over time. Therefore,
future research should test environments that allow better for the
differentiation between a wider set of decision strategies and these
alternative explanations.
4.1.3 Why were groups better than individuals in the take-the-best-friendly environment?
In fact, superiority of small groups over individuals has been
documented before in other learning tasks (e.g., Hill, 1982). This
study demonstrates it in a strategy selection task and thus
contributes to research on the adaptive capacity of teams (e.g., Burke
et al., 2006; Randall et al., 2011). Plausible explanations for the
superiority of groups in the take-the-best-friendly environment can be
derived from the literature that discusses reasons for the superiority
of groups in intellective tasks in general (e.g., Laughlin,
VanderStoep, & Hollingshead, 1991) and a faster learning rate of
groups in particular (e.g., Davis, 1969). These are (a) the greater
likelihood of recognizing the correct answer due to a larger sample
size; (b) a better joint memory due to better error correction ability
(e.g., Hinsz, 1990; Vollrath, Sheppard, Hinsz, & Davis, 1989) and/or
better encoding (Weldon, Blair, & Huebsch, 2000; for an overview of
findings on collaborative group memory, see Betts & Hinsz, 2010); and
(c) the capacity to process more information and use decision rules
more consistently (Chalos & Pickard, 1985). Additionally,
articulating the decision procedure during discussion may enhance
awareness, foster deeper processing, and promote a rather explicit
meta- cognitive thinking style, which may, in turn, render it more
likely that the appropriate strategy will be detected (Kerr, MacCoun,
& Kramer, 1996; but see Olsson et al., 2006).
The aforementioned reasons, however, would also suggest a superiority
of groups over individuals in the WADD-friendly environment, which we
did not find. One might argue that a ceiling effect was responsible
for our not finding this or, in other words, that a certain low
starting level of performance is needed to trigger learning. This
explanation, however, is inconsistent with the results of the second
phase of Experiment 2, where performance dropped and no levels as high
as in the first phase were reached.
What might explain that performance differences mainly prevailed in
the take-the-best-friendly environment? Assuming that subjects in fact
adopted take-the-best, we speculate that the possibility for social
validation in a dyadic setting may be one reason for our finding that
groups were more prone to be less influenced by irrelevant cues (i.e.,
cues that were less valid than the best discriminating cue). The
approval of one’s partner may replace looking up or taking into
consideration more cues to feel reassured in one’s decision. Another
reason may be that a better calibration of cue orderings may be the
result of collaborating with another person, as exchanging information
with others can speed up learning the order in which cues should be
considered (Garcia-Retamero, Takezawa, & Gigerenzer, 2009). Because
this was helpful only in the take-the-best-friendly environment, the
observed asymmetry may have appeared. It may also be the case that
groups per se rather overweight apparently important cues (Gigone &
Hastie, 1997), which may be unhelpful in certain environments, such as
one that is WADD friendly, but advantageous in others, such as a
take-the-best-friendly environment. Last, the information search steps
and integration rule of take-the-best might be much easier to
verbalize than those of WADD, rendering take-the-best easier to
communicate and teach to another person once it has been detected as
the appropriate rule (for a related argument that simple, sequential
strategies are easier to learn than strategies that weight and add all
pieces of information, see Wegwarth, Gaissmaier, & Gigerenzer, 2009).
A different explanation would be that the groups’ superiority in the
take-the-best-friendly environment was not a result of learning
take-the-best in particular but of a more general superiority in
learning to abolish the default strategy when ceasing to be successful
and to adopt another more successful one (though not necessarily the
single best one). Recall that groups may have a greater cognitive
capacity, as summarized above. Previous research has found that
greater cognitive capacity does not affect the use of any particular
strategy (as would be expected from the classical effort-accuracy
trade-off perspective; e.g., Christensen-Szalanski, 1978; Payne et
al., 1993) but rather on the use of the appropriate strategy
(e.g., Bröder, 2003, see also Mata, Schooler, & Rieskamp, 2007). A
greater cognitive capacity seems to be helpful in the meta-process of
detecting the payoff structure and selecting the appropriate strategy,
which may be a one-reason decision strategy in some environments
(Bröder, 2012). Also, considering one-reason decision making may
require some form of deliberate discounting of information (counter to
the default use of WADD and the common belief that more is
better). Thus, even though subjects might have not necessarily learned
take-the-best but some other (though less) successful strategy that
exploited some features of the environment, our findings provide
evidence for the adaptive capacity of individuals and (for the
somewhat greater adaptive capacity of) teams in general.
4.2 Limitations and open questions
This study is certainly just one step in studying adaptive strategy
selection in groups. Some limitations in its generalizability may rest
in its focus on inferences from givens and a rather abstract,
unfamiliar experimental task. In everyday life, people probably find
that new and old situations bear some resemblance and thus are able to
exploit their repertoire of strategies better. However, (perceived)
familiarity with the task may not always be beneficial, as was shown by
Experiment 2, where the task surface stayed the same but the
underlying structure changed from Phase 1 to Phase 2. Here, subjects
had particular problems in finding the best strategy. Other factors
that may play a role in real-world tasks are, for instance, strategic
interests that may influence information sharing and weighting, having
to actively search for and remember information, and also having to
decide what to search for in the first place. The MouseLab-like
experimental setup in our study has certainly simplified the task in
these respects (Glöckner & Betsch, 2008b). Therefore, more
naturalistic settings and a broader set of decision domains should be
considered in future studies. On the side of the decision maker,
further influencing factors worthy of study include intelligence,
working memory load (Bröder, 2003), the size of the group, and group
composition (Kämmer et al., 2013).
With regard to WADD, we are aware that more variations than taking the
validities as weights are conceivable (e.g., taking unit weights, log
odds, or chance-corrected weights; see, e.g., Bergert & Nosofsky,
2007) and we considered them in the extended classification analyses
(Appendix C). Analyses of the take-the-best-friendly environment show
that these alternative weighting schemes may play a role in people’s
strategy choice, but analyses of the WADD-friendly environment showed
that they played a minor role compared to WADD, probably because using
validities as weights was fostered by our experimental setup (being
the most successful strategy and presenting validities). Future
studies should consider those different weighting schemes more
explicitly already in the design of experiments.
Future research should also address the question of whether and to
what extent the superiority effect can be found “in the wild”, that
is, in real groups that encounter environments where ignoring
irrelevant information can facilitate and improve decision
making. Admittedly this is an unusual endeavor in light of much group
research that aims at finding ways of fostering the quantity of
information considered by groups (e.g., Frey, Schulz-Hardt, &
Stahlberg, 1996; Larson et al., 1994; Parks & Cowlin, 1996; Stasser,
Taylor, & Hanna, 1989). This line of research has been stimulated by
the repeated finding that groups did not exhaust their potential to
pool more information but mainly discussed shared information known to
every member (e.g., Stasser, 1992; Wittenbaum & Stasser, 1996). In
those studies, the option with the highest overall sum score was
usually defined as the best solution, though (i.e., Tally; Reimer &
Hoffrage, 2012; for a critique see Reimer & Hoffrage,
2006). Therefore, groups ignoring part of the available information
necessarily performed worse than the benchmark strategy. This
limitation to one type of environment structure restricts the possible
findings concerning group adaptivity. Our results draw an optimistic
picture that groups are able to adapt to different environments. The
lesson here is that not the mere quantity of information determines
the success of a group (Reimer & Hoffrage, 2006) but rather the
adaptive integration of information, which may mean, in certain
environments, ignoring irrelevant information.
4.3 Conclusion
Adaptive capacity is essential for individuals and groups who are
engaged in judgment and decision making (Burke et al., 2006;
Gigerenzer et al., 1999; Randall et al., 2011). It enables people to
adjust their operations in (changing) environments accordingly. The
selection of an appropriate strategy from the adaptive toolbox, for
example, will lead to efficient and effective decision making in an
uncertain environment. The current study provides some evidence for
the adaptive capacity of individuals and groups and even group
superiority in a task environment in which the default strategy was
not the most successful one. By this, it extended research on adaptive
strategy selection to the group level, which is necessary not only for
theoretical progress but also because of the practical relevance of
social interactions for decision making. Despite the common (and
partly justified; see Richter, Dawson, & West, 2011) belief of
organizations in the superiority of teams (Allen & Hecht, 2004),
however, no generalized verdict in favor of groups can be derived from
this study. Instead, it demonstrates how important it is to take the
environmental structure of the task into account when comparing
individual with group strategy learning and performance.
References
Allen, N. J., & Hecht, T. D. (2004). The ’romance of teams’: Toward
an understanding of its psychological underpinnings and
implications. Journal of Occupational & Organizational
Psychology, 77,
439–461. http://dx.doi.org/10.1348/0963179042596469
Baron, R. S. (1986). Distraction-conflict theory: Progress and
problems. In L. Berkowitz (Ed.), Advances in experimental
social psychology. Vol. 19 (pp. 1-40). New York: Academic Press.
Bergert, F. B., & Nosofsky, R. M. (2007). A response-time approach to
comparing generalized rational and take-the-best models of decision
making. Journal of Experimental Psychology: Learning, Memory,
and Cognition, 33, 107–129.
http://dx.doi.org/10.1037/0278-7393.33.1.107
Betsch, T., & Haberstroh, S. (2005). The routines of decision
making. Mahwah, NJ: Erlbaum.
Betsch, T., Haberstroh, S., Glöckner, A., Haar, T., & Fiedler,
K. (2001). The effects of routine strength on adaptation and
information search in recurrent decision
making. Organizational Behavior and Human Decision Processes,
84, 23–53. http://dx.doi.org/10.1006/obhd.2000.2916
Betts, K. R., & Hinsz, V. B. (2010). Collaborative group memory:
Processes, performance, and techniques for improvement. Social
and Personality Psychology Compass, 4,
119–130. http://dx.doi.org/10.1111/j.1751-9004.2009.00252.x
Bonaccio, S., & Dalal, R. S. (2006). Advice taking and
decision-making: An integrative literature review, and implications
for the organizational sciences. Organizational Behavior and
Human Decision Processes, 101,
127-151. http://dx.doi.org/10.1016/j.obhdp.2006.07.001
Bottger, P., & Yetton, P. (1988). An integration of process and
decision scheme explanations of group problem solving
performance. Organizational Behavior and Human Decision
Processes, 42,
234–249. http://dx.doi.org/10.1016/0749-5978(88)90014-3
Bowers, J. S., & Davis, C. J. (2012a). Bayesian just-so stories in
psychology and neuroscience. Psychological Bulletin, 138,
389–414. http://dx.doi.org/10.1037/a0026450
Bowers, J. S., & Davis, C. J. (2012b). Is that what Bayesians
believe? Reply to Griffiths, Chater, Norris, and Pouget
(2012). Psychological Bulletin, 138,
423–426. http://dx.doi.org/10.1037/a0027750
Bröder, A. (2003). Decision making with the ’adaptive toolbox’:
Influence of environmental structure, intelligence, and working memory
load. Journal of Experimental Psychology: Learning, Memory,
and Cognition, 29, 611–625.
http://dx.doi.org/10.1037/0278-7393.29.4.611
Bröder, A. (2012). The quest for take the best—Insights and
outlooks from experimental research. In P. Todd, G. Gigerenzer & the
ABC Research Group (Eds.), Ecological rationality:
Intelligence in the world (pp. 216–240). New York: Oxford
University Press.
Bröder, A. & Schiffer, S. (2003). Bayesian strategy assessment in
multi-attribute decision making. Journal of Behavioral
Decision Making, 16,
193–213. http://dx.doi.org/10.1002/bdm.442
Bröder, A., & Schiffer, S. (2006). Adaptive flexibility and
maladaptive routines in selecting fast and frugal decision
strategies. Journal of Experimental Psychology: Learning,
Memory, and Cognition, 32,
904–918. http://dx.doi.org/10.1037/0278-7393.32.4.904
Burke, C. S., Stagl, K. C., Salas, E., Pierce, L., & Kendall,
D. (2006). Understanding team adaptation: A conceptual analysis and
model. Journal of Applied Psychology, 91,
1189–1207. http://dx.doi.org/10.1037/0021-9010.91.6.1189
Busemeyer, J. R., & Townsend, J. T. (1993). Decision field theory: a
dynamic-cognitive approach to decision making in an uncertain
environment. Psychological Review, 100,
432–459. http://dx.doi.org/10.1037/0033-295X.100.3.432
Chalos, P., & Pickard, S. (1985). Information choice and cue use: An
experiment in group information-processing. Journal of
Applied Psychology, 70,
634–641. http://dx.doi.org/10.1037/0021-9010.70.4.634
Christensen-Szalanski, J. J. (1978). Problem solving strategies: A
selection mechanism, some implications, and some
data. Organizational Behavior & Human Performance,
22, 307–323. http://dx.doi.org/10.1016/0030-5073(78)90019-3
Christensen-Szalanski, J. J. (1980). A further examination of the
selection of problem-solving strategies: The effects of deadlines and
analytic aptitudes. Organizational Behavior & Human
Performance, 25,
107–122. http://dx.doi.org/10.1016/0030-5073(80)90028-8
Chu, P., & Spires, E. E. (2003). Perceptions of accuracy and effort
of decision strategies. Organizational Behavior and Human
Decision Processes, 91,
203–214. http://dx.doi.org/10.1016/S0749-5978(03)00056-6
Creyer, E. H., Bettman, J. R., & Payne, J. W. (1990). The impact of
accuracy and effort feedback and goals on adaptive decision
behavior. Journal of Behavioral Decision Making, 3,
1–16. http://dx.doi.org/10.1002/bdm.3960030102
Czerlinski, J., Gigerenzer, G., & Goldstein, D. G. (1999). How good
are simple heuristics? In G. Gigerenzer, P. Todd, & the ABC Research
Group (Eds.), Simple heuristics that make us smart (pp.
97-118). New York: Oxford University Press.
Czienskowski, U. (2004). The oil drilling experiment [Computer
software]. Berlin, Germany: Max Planck Institute for Human
Development.
Davis, J. H. (1969). Individual-group problem solving, subject
preference, and problem type. Journal of Personality and
Social Psychology, 13,
362–374. http://dx.doi.org/10.1037/h0028378.
De Dreu, C. K. W., Nijstad, B. A., & van Knippenberg,
D. (2008). Motivated information processing in group judgment and
decision making. Personality and Social Psychology Review,
12, 22–49. http://dx.doi.org/10.1177/1088868307304092
Dieckmann, A., & Rieskamp, J. (2007). The influence of information
redundancy on probabilistic inferences. Memory & Cognition,
35, 1801–1813. http://dx.doi.org/10.3758/BF03193511
Field, A. (2009). Discovering statistics using SPSS. London:
Sage Publications Ltd.
Frey, D., Schulz-Hardt, S., & Stahlberg, D. (1996). Information
seeking among individuals and groups and possible consequences for
decision making in business and politics Understanding group
behavior, Vol 2: Small group processes and interpersonal relations
(pp. 211-225). Hillsdale, NJ, England: Lawrence Erlbaum Associates,
Inc; England.
Garcia-Retamero, R., & Dhami, M. (2009). Take-the-best in
expert-novice decision strategies for residential burglary.
Psychonomic Bulletin & Review, 16,
163–169. http://dx.doi.org/10.3758/PBR.16.1.163
Garcia-Retamero, R., Takezawa, M., & Gigerenzer, G. (2009). Does
imitation benefit cue order learning? Experimental
Psychology, 56,
307–320. http://dx.doi.org/10.1027/1618-3169.56.5.307
Gersick, C. J. G., & Hackman, J. R. (1990). Habitual routines in
task-performing groups. Organizational Behavior and Human
Decision Processes, 47,
65–97. http://dx.doi.org/10.1016/0749-5978(90)90047-D
Gigerenzer, G., & Goldstein, D. G. (1999). Betting on one good
reason: The take the best heuristic. In G. Gigerenzer, P. M. Todd, &
the ABC Research Group, Simple heuristics that make us smart
(pp. 75-96). New York, NY: Oxford University Press.
Gigerenzer, G., Todd, P. M., & the ABC Research Group.
(1999). Simple heuristics that make us smart. New York, NY:
Oxford University Press.
Gigone, D., & Hastie, R. (1997). The impact of information on small
group choice. Journal of Personality and Social Psychology,
72, 132–140. http://dx.doi.org/10.1037/0022-3514.72.1.132
Glöckner, A., & Betsch, T. (2008a). Modeling option and strategy
choices with connectionist networks: Towards an integrative model of
automatic and deliberate decision making. Judgment and
Decision Making, 3, 215–228.
Glöckner, A., & Betsch, T. (2008b). Multiple-reason decision making
based on automatic processing. Journal of Experimental
Psychology: Learning, Memory, and Cognition, 34,
1055. http://dx.doi.org/10.1037/0278-7393.34.5.1055
Glöckner, A., & Betsch, T. (2010). Accounting for critical evidence
while being precise and avoiding the strategy selection problem in a
parallel constraint satisfaction approach: A reply to Marewski
(2010). Journal of Behavioral Decision Making, 23,
468–472. http://dx.doi.org/10.1002/bdm.688
Glöckner, A., Betsch, T., & Schindler, N. (2010). Coherence shifts
in probabilistic inference tasks. Journal of Behavioral
Decision Making, 23,
439–462. http://dx.doi.org/10.1002/bdm.668
Griffiths, T. L., Chater, N., Norris, D., & Pouget, A. (2012). How
the Bayesians got their beliefs (and what those beliefs actually are):
Comment on Bowers and Davis (2012). Psychological Bulletin,
138, 415–422. http://dx.doi.org/10.1037/a0026884
Harvey, N., & Bolger, F. (2001). Collecting information: Optimizing
outcomes, screening options, or facilitating discrimination?
Quarterly Journal of Experimental Psychology: Section A, 54,
269–301. http://dx.doi.org/10.1080/02724980042000110
Henry, R. A. (1995). Improving group judgment accuracy: Information
sharing and determining the best member. Organizational
Behavior and Human Decision Processes, 62,
190–197. http://dx.doi.org/10.1006/obhd.1995.1042
Henry, R. A., Strickland, O. J., Yorges, S. L., & Ladd,
D. (1996). Helping groups determine their most accurate member: The
role of outcome feedback. Journal of Applied Social
Psychology, 26(13),
1153–1170. http://dx.doi.org/10.1111/j.1559-1816.1996.tb02290.x
Hinsz, V. B. (1990). Cognitive and consensus processes in group
recognition memory performance. Journal of Personality and
Social Psychology, 59,
705–718. http://dx.doi.org/10.1037/0022-3514.59.4.705
Hinsz, V. B., Tindale, R. S., & Vollrath, D. A. (1997). The emerging
conceptualization of groups as information
processors. Psychological Bulletin, 121,
43–64. http://dx.doi.org/10.1037/0033-2909.121.1.43
Hogarth, R. M., & Karelaia, N. (2006). “Take-the-best” and other
simple strategies: Why and when they work “well” with binary
cues. Theory and Decision, 61,
205–249. http://dx.doi.org/10.1007/s11238-006-9000-8
Hogarth, R. M., & Karelaia, N. (2007). Heuristic and linear models of
judgment: Matching rules and environments. Psychological
Review; Psychological Review, 114,
733–758. http://dx.doi.org/10.1037/0033-295X.114.3.733
Jones, M., & Love, B. C. (2011). Bayesian Fundamentalism or
Enlightenment? On the explanatory status and theoretical contributions
of Bayesian models of cognition. Behavioral and Brain
Sciences, 34, 169–231.
http://dx.doi.org/10.1017/S0140525X10003134
Juslin, P., Olsson, H., & Olsson, A.-C. (2003). Exemplar effects in
categorization and multiple-cue judgment. Journal of
Experimental Psychology: General, 132,
133–156. http://dx.doi.org/10.1037/0096-3445.132.1.133
Kämmer, J. E., Gaissmaier, W., Reimer, T., & Schermuly,
C. C. (2013). The adaptive use of recognition in group decision
making. Manuscript submitted for publication.
Katsikopoulos, K. V., & Martignon, L. (2006). Naïve heuristics for paired
comparisons: Some results on their relative accuracy. Journal of
Mathematical Psychology, 50, 488–494. http://dx.doi.org/ 10.1016/j.jmp.2006.06.001
Kerr, N. L., MacCoun, R. J., & Kramer, G. P. (1996). Bias in
judgment: Comparing individuals and groups. Psychological
Review, 103,
687–719. http://dx.doi.org/10.1037/0033-295X.103.4.687
Kocher, M. G., & Sutter, M. (2005). The decision maker matters:
Individual versus group behaviour in experimental beauty-contest
games. The Economic Journal, 115,
200–223. http://dx.doi.org/10.1111/j.1468-0297.2004.00966.x
Lamm, H., & Trommsdorff, G. (2006). Group versus individual
performance on tasks requiring ideational proficiency (brainstorming):
A review. European journal of social psychology, 3,
361–388. http://dx.doi.org/10.1002/ejsp.2420030402
Larson, J. R., Foster-Fishman, P. G., & Keys,
C. B. (1994). Discussion of shared and unshared information in
decision-making groups. Journal of Personality and Social
Psychology, 67,
446–461. http://dx.doi.org/10.1037/0022-3514.67.3.446
Laughlin, P. R., Bonner, B. L., & Miner, A. G. (2002). Groups perform
better than the best individuals on letters-to-numbers
problems. Organizational Behavior and Human Decision
Processes, 88,
605–620. http://dx.doi.org/10.1016/S0749-5978(02)00003-1
Laughlin, P. R., VanderStoep, S. W., & Hollingshead,
A. B. (1991). Collective versus individual induction: Recognition of
truth, rejection of error, and collective information
processing. Journal of Personality and Social Psychology, 61,
50–67. http://dx.doi.org/10.1037/0022-3514.61.1.50
Lee, M. D., & Cummins, T. D. R. (2004). Evidence accumulation in
decision making: Unifying the “take the best” and the “rational”
models. Psychonomic Bulletin & Review, 11, 343-352.
LePine, J. A. (2003). Team adaptation and postchange performance:
Effects of team composition in terms of members’ cognitive ability and
personality. Journal of Applied Psychology, 88,
27–39. http://dx.doi.org/10.1037/0021-9010.88.1.27
Levine, J. M., & Smith, E. R. (in press). Group cognition: Collective
information search and distribution. In D. E. Carlston (Ed.), Oxford
handbook of social cognition. New York: Oxford University Press.
Lorenz, J., Rauhut, H., Schweitzer, F., & Helbing, D. (2011). How
social influence can undermine the wisdom of crowd
effect. Proceedings of the National Academy of Sciences, 108,
9020–9025. http://dx.doi.org/10.1073/pnas.1008636108
Lorge, I., & Solomon, H. (1955). Two models of group behavior in the
solution of eureka-type problems. Psychometrika, 20,
139–148.
Maciejovsky, B., Sutter, M., Budescu, D. V., & Bernau,
P. (2010). Teams make you smarter: Learning and knowledge transfer in
auctions and markets by teams and individuals. IZA Discussion Paper
No. 5105. Available at SSRN: http://ssrn.com/abstract=1659084
Manser, T. (2009). Teamwork and patient safety in dynamic domains of
healthcare: A review of the literature. Acta
Anaesthesiologica Scandinavica, 53,
143–151. http://dx.doi.org/10.1111/j.1399-6576.2008.01717.x
Marewski, J. N. (2010). On the theoretical precision and strategy
selection problem of a single-strategy approach: A comment on
Glöckner, Betsch, and Schindler (2010). Journal of
Behavioral Decision Making, 23,
463–467. http://dx.doi.org/10.1002/bdm.680
Marewski, J. N., & Schooler, L. J. (2011). Cognitive niches: An
ecological model of strategy selection. Psychological Review,
118, 393–437. http://dx.doi.org/10.1037/a0024143
Mata, R., Schooler, L. J., & Rieskamp, J. (2007). The aging decision
maker: Cognitive aging and the adaptive selection of decision
strategies. Psychology and Aging, 22,
796–810. http://dx.doi.org/10.1037/0882-7974.22.4.796
McAllister, D. W., Mitchell, T. R., & Beach, L. R. (1979). The
contingency model for the selection of decision strategies: An
empirical test of the effects of significance, accountability, and
reversibility. Organizational Behavior and Human Performance,
24, 228–244. http://dx.doi.org/10.1016/0030-5073(79)90027-8
Miner, F. C. (1984). Group versus individual decision making: An
investigation of performance measures, decision strategies, and
process losses / gains. Organizational Behavior and Human
Performance, 33,
112–124. http://dx.doi.org/10.1016/0030-5073(84)90014-X
Nadler, D. A. (1979). The effects of feedback on task group behavior:
A review of the experimental research. Organizational
Behavior and Human Performance, 23,
309–338. http://dx.doi.org/10.1016/0030-5073(79)90001-1
Newell, B. R., & Lee, M. D. (2011). The right tool for the job?
Comparing an evidence accumulation and a naive strategy selection
model of decision making. Journal of Behavioral Decision
Making, 24, 456–481. http://dx.doi.org/10.1002/bdm.703
Newell, B. R., & Shanks, D. R. (2003). Take the best or look at the
rest? Factors influencing “one-reason” decision
making. Journal of Experimental Psychology: Learning, Memory,
and Cognition, 29,
53–65. http://dx.doi.org/10.1037/0278-7393.29.1.53
Newell, B. R., Weston, N. J., & Shanks, D. R. (2003). Empirical tests
of a fast-and-frugal heuristic: Not everyone
"takes-the-best". Organizational
Behavior and Human Decision Processes, 91, 82–96.
http://dx.doi.org/10.1016/S0749-5978(02)00525-3
Nosofsky, R. M., & Johansen, M. K. (2000). Exemplar-based accounts of
“multiple-system” phenomena in perceptual
categorization. Psychonomic Bulletin and Review, 7, 375–402.
Olsson, A. C., Juslin, P., & Olsson, H. (2006). Individuals and dyads
in a multiple-cue judgment task: Cognitive processes and
performance. Journal of Experimental Social Psychology, 42,
40–56. http://dx.doi.org/10.1016/j.jesp.2005.01.004
Pachur, T., & Olsson, H. (2012). Type of learning task impacts
performance and strategy selection in decision making.
Cognitive Psychology, 65,
207–240. http://dx.doi.org/10.1016/j.cogpsych.2012.03.003
Parks, C. D., & Cowlin, R. A. (1996). Acceptance of uncommon
information into group discussion when that information is or is not
demonstable. Organizational Behavior and Human Decision
Processes, 66,
307–315. http://dx.doi.org/10.1006/obhd.1996.0058
Payne, J. W., Bettman, J. R., & Johnson, E. J. (1993). The
adaptive decision maker. Cambridge, England: Cambridge University
Press.
Platzer, C., & Bröder, A. (in press). When the rule is ruled out:
Exemplars and rules in decisions from memory. Journal of
Behavioral Decision Making. http://dx.doi.org/10.1002/bdm.1776
Randall, K. R., Resick, C. J., & DeChurch, L. A. (2011). Building
team adaptive capacity: The roles of sensegiving and team
composition. Journal of Applied Psychology, 96,
525–540. http://dx.doi.org/10.1037/a0022622
Reimer, T., Bornstein, A.-L., & Opwis, K. (2005). Positive and
negative transfer effects in groups. In T. Betsch & S. Haberstroh
(Eds.), The routine of decision making (pp.
175-192). Mahwah, NJ: Erlbaum.
Reimer, T., & Hoffrage, U. (2006). The ecological rationality of
simple group heuristics: Effects of group member strategies on
decision accuracy. Theory and Decision, 60,
403–438. http://dx.doi.org/10.1007/s11238-005-4750-2
Reimer, T., & Hoffrage, U. (2012). Ecological rationality for teams
and committees: Heuristics in group decision making. In P. M. Todd,
G. Gigerenzer, & the ABC Research Group (Eds.), Ecological
rationality: Intelligence in the world (pp. 335-359). New York:
Oxford University Press.
Reimer, T., Hoffrage, U., & Katsikopoulos,
K. V. (2007). Entscheidungsheuristiken in Gruppen [Heuristics in group
decision-making]. NeuroPsychoEconomics, 2, 7–29.
Richter, A., Dawson, J., & West, M. (2011). The effectiveness of
teams in organizations: A meta-analysis. The International
Journal of Human Resource Management, 22,
2749–2769. http://dx.doi.org/10.1080/09585192.2011.573971
Rieskamp, J., & Dieckmann, A. (2012). Redundancy: Environment structure
that simple heuristics can exploit. In P. M. Todd, G. Gigerenzer, &
the ABC Research Group (Eds.), Ecological rationality: Intelligence in
the world (pp. 187–215). New York: Oxford University Press.
Rieskamp, J., & Hoffrage, U. (1999). When do people use simple
heuristics, and how can we tell? In: G. Gigerenzer, P. M. Todd & the
ABC Research Group, Simple heuristics that make us smart
(pp. 141–167). New York: Oxford University Press.
Rieskamp, J., & Hoffrage, U. (2008). Inferences under time pressure:
How opportunity costs affect strategy selection. Acta
Psychologica, 127,
258–276. http://dx.doi.org/10.1016/j.actpsy.2007.05.004
Rieskamp, J., & Otto, P. E. (2006). SSL: A theory of how people learn
to select strategies. Journal of Experimental Psychology:
General, 135,
207–236. http://dx.doi.org/10.1037/0096-3445.135.2.207
Simon, H. A. (1956). Rational choice and the structure of the
environment. Psychological Review, 63,
129–138. http://dx.doi.org/10.1037/h0042769
Stasser, G. (1992). Information salience and the discovery of hidden
profiles by decision-making groups: A “thought
experiment”. Organizational Behavior and Human Decision
Processes, 52,
156–181. http://dx.doi.org/10.1016/0749-5978(92)90049-D
Stasser, G., Taylor, L. A., & Hanna, C. (1989). Information sampling
in structured and unstructured discussions of three- and six-person
groups. Journal of Personality and Social Psychology, 57,
67–78. http://dx.doi.org/http://dx.doi.org/10.1037/0022-3514.57.1.67
Steiner, I. D. (1972). Group process and productivity. New
York: Academic Press.
Stroebe, W., Nijstad, B. A., & Rietzschel, E. F. (2010). Beyond
productivity loss in brainstorming groups: The evolution of a
question. Advances in Experimental Social Psychology, 43,
157-203. http://dx.doi.org/10.1016/S0065-2601(10)43004-X
Svenson, O. (1992). Differentiation and consolidation theory of human
decision making: A frame of reference for the study of pre- and
post-decision processes. Acta Psychologica, 80,
143–168. http://dx.doi.org/10.1016/0001-6918(92)90044-E
Tindale, R. S. (1989). Group vs. individual information processing:
The effects of outcome feedback on decision making.
Organizational Behavior and Human Decision Processes, 44,
454–473. http://dx.doi.org/10.1016/0749-5978(89)90019-8
Tindale, R. S., & Sheffey, S. (2002). Shared information, cognitive
load, and group memory. Group Processes & Intergroup
Relations, 5,
5–18. http://dx.doi.org/10.1177/1368430202005001535
Todd, P. M., & Gigerenzer, G. (2012). What is ecological rationality?
In P. M. Todd, G. Gigerenzer, & the ABC Research Group (Eds.),
Ecological rationality: Intelligence in the world (pp.
3-30). New York: Oxford University Press.
Vollrath, D. A., Sheppard, B. H., Hinsz, V. B., & Davis,
J. H. (1989). Memory performance by decision-making groups and
individuals. Organizational Behavior and Human Decision
Processes, 43,
289–300. http://dx.doi.org/10.1016/0749-5978(89)90040-X
Waller, M. J. (1999). The timing of adaptive group responses to
nonroutine events. Academy of Management Journal, 42,
127–137.
Watson, G. B. (1928). Do groups think more efficiently than
individuals? The Journal of Abnormal and Social Psychology,
23, 328–336. http://dx.doi.org/10.1037/h0072661
Wegwarth, O., Gaissmaier, W., & Gigerenzer, G. (2009). Smart
strategies for doctors and doctors-in-training: Heuristics in
medicine. Medical Education, 43, 721–728.
Weldon, M. S., Blair, C., & Huebsch, P. D. (2000). Group remembering:
Does social loafing underlie collaborative inhibition? Journal
of Experimental Psychology: Learning, Memory, and Cognition, 26,
1568–1577. http://dx.doi.org/10.1037/0278-7393.26.6.1568
Wittenbaum, G. M., & Stasser, G. (1996). Management of information in
small groups. In J. L. Nye & A. M. Brower (Eds.), What’s
Social about Social Cognition? (pp. 967-978). Thousand Oaks, CA:
Sage.
Appendix A: Experimental material Experiment 1: Screenshots
with instructions
(Note that the original instructions were in German, the translation is given below the screenshots.)
1) Imagine you are a geologist and have a contract with an oil-drilling
company to find profitable oil-drilling sites. In the following, you
are supposed to choose the more profitable of two oil-drilling
sites. In order to make a decision you can commission six different
measures (i.e., you can click on them). The six measures can inform
you with different levels of certainty (“success”) whether an oil-drilling
site is profitable (“+”) or not (“–”).
2) See, for example, the figure below “seismic analyses”: It allows
you in 78% of cases to make a correct prediction
about whether you can find oil (“+”) or not (“–”). The measure
“chemical analyses” in the lower example, however, allows for only
53% correct predictions.
3) You are free to choose which and how many measures and in which
order you “commission” them (i.e., which ones you uncover), until
you choose one of the two oil-drilling sites (X or Y). To see the
result of a measure, just click on the corresponding box with the
question mark.
4) In order to choose one of the two oil-drilling sites, just click
either on the box with the “X” (left oil-drilling site) or on the
box with the “Y” (right oil-drilling site). After your choice, you
will receive feedback about the accuracy of your choice. For each
correct choice, you will receive 1000 Petros. At the end of the
experiment, the experimenter will pay you €0.10 in exchange
for 1000 Petros.
In the following practice trial you can practice how the program
works. The result will not be counted.
Additional oral instructions from the experimenter:
5) “Please read through the instructions. There will be a practice
trial. If you have questions, please ask me. There is no time
limit.” [In dyad condition: “Please work jointly on the task and do not
leave it to one person to click on the boxes.”]
Figure B.1. Individuals’ and dyads’ mean rates of accordance
with the adaptive strategy in the WADD-friendly (left) and
take-the-best-friendly (TTB; right) environments. In both
environments, choices were strongly in accordance with the appropriate
adaptive strategy. Dyads, however, either reached asymptotic
accordance faster (take-the-best-friendly environment) or reached
higher final levels of accordance with the adaptive strategy
(WADD-friendly environment). Error bars: ±1 SE.
2) Accordance rates in Experiment 2
Figure B.2. Individuals’ and dyads’ mean accordance rates
with the adaptive strategy in the WADD-friendly and
take-the-best-friendly (TTB) environments. The two left
panels depict the rates of accordance with the adaptive strategies
in the experimental order of first the WADD-friendly and
then the take-the-best-friendly environment; n = 20 individuals,
n = 20 dyads); the two right panels depict the results for
the reverse order. Error bars: ±1 SE.
Appendix C: Additional results: Classification with six strategies
Here we present the results for the classification according to
Bröder and Schiffer (2003) for six strategies: WADD, Tally, chance-corrected WADD, naïve
Bayes, take-the-best, and guessing. Strategy predictions were based on
the cues observed by each individual and dyad, that is, predictions
were tailored to the acquired cues. This results in a stricter
classification than when predictions are based on all cues, as was
done in the main text.
Table C.1 and Table C.2 show the average accordance and performance
rates of the subgroups of subjects who were classified as users of
one strategy in Experiment 1 and 2. These tables show that,
in the take-the-best-friendly environment, there were
(slightly) more dyads than individuals classified as using one of the
three most successful strategies (take-the-best, naïve Bayes,
chance-corrected WADD), which may be the reason why dyads also
achieved on average a slightly higher performance level than
individuals. In the WADD-friendly environment, equally many
individuals and dyads were classified as using one of the three most
successful strategies (WADD, Tally, chance-corrected WADD), and no
performance differences were observed on average.
Table C.1
Results for the classification according to Bröder and Schiffer
(2003) including six strategies for Experiment 1.
Theoretical accuracy of strategy
Accordance
Performance
Environment
Condition
Classification
N
overall
overall
TTB friendly
Individuals
TTB
.88
6
.88 (.05)
.82 (.05)
Naïve Bayes
.81
2
.92 (.03)
.84 (.01)
WADD (chance)
.77
6
.91 (.07)
.81 (.05)
WADD
.62
6
.88 (.05)
.76 (.06)
Tally
.58
-
-
-
Total
20
.90 (.05)
.80 (.06)
Dyads
TTB
.88
7
.91 (.03)
.85 (.02)
Naïve Bayes
.81
4
.86 (.04)
.79 (.06)
WADD (chance)
.77
6
.92 (.05)
.82 (.05)
WADD
.62
3
.94 (.03)
.80 (.06)
Tally
.58
-
-
-
Total
20
.91 (.05)
.82 (.05)
WADD friendly
Indivdiuals
WADD
.88
10
.93 (.03)
.86 (.03)
Tally
.79
9
.86 (.04)
.84 (.05)
WADD (chance)
.73
1
.85
.81
Naïve Bayes
.69
-
-
-
TTB
.62
-
-
-
Total
20
.90 (.05)
.85 (.04)
Dyads
WADD
.88
17
.91 (.05)
.87 (.03)
Tally
.79
3
.85 (.05)
.78 (.11)
WADD (chance)
.73
-
-
-
Naïve Bayes
.69
-
-
-
TTB
.62
-
-
-
Total
20
.90
(.05)
.85 (.05)
Note: The columns contain
the theoretical accuracy of each strategy in the respective
environment, the number of classified subjects in each category
(N), the average accordance with the respective strategy of the
classified subjects and the observed average performance (SD in
parentheses). Strategies are ordered per environment according to
their theoretical accuracy in decreasing order. Classification = classification into
one of the following strategies: WADD, Tally, WADD (chance) = WADD
with chance corrected weights, naïve Bayes = WADD with log odds as
weights, TTB = take-the-best. The sixth strategy was guessing. No
subject was classified as guessing.
Table C.2:
Results for the classification according to Bröder and Schiffer
(2003) for six strategies for Experiment 2, for phase 1
(upper part) and phase 2 (lower part).
Phase 1
Theoretical accuracy of strategy
Accordance
Performance
Environment
Condition
Classification
N
overall
overall
TTB friendly
Individuals
TTB
.88
4
.90 (.08)
.83 (.04)
Naïve Bayes
.81
2
.87 (.10)
.78 (.07)
WADD (chance)
.77
2
.92 (.07)
.82 (.03)
WADD
.62
7
.88 (.08)
.79 (.05)
Tally
.58
5
.76 (.10)
.64 (.11)
Total
20
.86 (.10)
.76 (.10)
Dyads
TTB
.88
4
.91 (.05)
.83 (.04)
Naïve Bayes
.81
4
.89 (.02)
.82 (.01)
WADD (chance)
.77
4
.91 (.04)
.83 (.04)
WADD
.62
7
.92 (.09)
.79 (.10)
Tally
.58
1
.80
.74
Total
20
.90 (.06)
.81 (.07)
WADD friendly
Indivdiuals
WADD
.88
15
.93 (.04)
.87 (.04)
Tally
.79
4
.80 (.06)
.81 (.06)
WADD (chance)
.73
-
-
-
Naïve Bayes
.69
-
-
-
TTB
.62
-
-
-
Total*
19
.90 (.07)
.86 (.05)
Dyads
WADD
.88
17
.92 (.06)
.86 (.06)
Tally
.79
1
.95
.86
WADD (chance)
.73
2
.81 (.03)
.80 (.03)
Naïve Bayes
.69
-
-
-
TTB
.62
-
-
-
Total
20
.91
(.06)
.85 (.06)
Phase 2
Theoretical accuracy of strategy
Accordance
Performance
Environment
Condition
Classification
N
overall
overall
TTB friendly
Individuals
TTB
.88
-
-
-
Naïve Bayes
.81
1
.76
.74
WADD (chance)
.77
-
-
-
WADD
.62
16
.80 (.09)
.69 (.04)
Tally
.58
3
.77 (.10)
.68 (.07)
Total
20
.79 (.08)
.69 (.05)
Dyads
TTB
.88
2
.77 (.03)
.78 (.04)
Naïve Bayes
.81
4
.78 (.03)
.74 (.02)
WADD (chance)
.77
-
-
-
WADD
.62
9
.79 (.04)
.73 (.04)
Tally
.58
5
.79 (.12)
.69 (.05)
Total
20
.79 (.06)
.73 (.04)
WADD friendly
Indivdiuals
WADD
.88
11
.89 (.04)
.80 (.04)
Tally
.79
5
.77 (.07)
.76 (.06)
WADD (chance)
.73
2
.85 (.06)
.76 (.08)
Naïve Bayes
.69
1
.88 (.)
.72 (.)
TTB
.62
-
-
-
Total*
19
.85 (.07)
.78 (.05)
Dyads
WADD
.88
12
.85 (.03)
.82 (.06)
Tally
.79
5
.78 (.06)
.72 (.05)
WADD (chance)
.73
1
.73 (.)
.69 (.)
Naïve Bayes
.69
2
.83 (.06)
.73 (.05)
TTB
.62
-
-
-
Total
20
.83 (.05)
.78 (.08)
Note: The columns
“accordance” and “performance” contain mean values with SD in
parentheses. Classification = classification in one
of the following strategies: WADD, Tally, WADD (chance) = WADD with
chance corrected weights, naïve Bayes = WADD with log odds as
weights, TTB = take-the-best. The sixth strategy was guessing.
* One subject was classified as using
guessing. This subject had an average performance of .71 in phase
1 and of .67 in phase 2.
Information search behavior
For comparison with the main results, we also include the results
concerning the two information search measures for those subjects
who were now classified as adaptive take-the-best and WADD users in
the two environments (see Table C.3 for Experiment 1 and Table C.4 for
Experiment 2). In these tables it can be seen that, similar
to the main results, in the take-the-best-friendly environment dyads
showed a larger decrease in the proportion of compensatory choices
than individuals, speaking for a faster adaptation, though without any
differences in the last block. In the WADD-friendly environment,
results were mixed. In Experiment 1 (and phase 2 of Experiment 2),
dyads showed a much larger drop from block 1 to block 3 in their
proportion of opening “too few” cues and also reached a lower level
in the end. However, in phase 1 of Experiment 2, the decrease was
proportionally equal between individuals and dyads, though on an
overall higher level for dyads. In phase 2 of Experiment 2,
individuals and dyads started at a similarly high deviation rate but
the opening rate of dyads decreased to a lower level in the final
block, indicating some superiority here.
Table C.3:
Average values with SE in parentheses in Experiment 1.
Environment
Condition
Classification
N
block 1
block 2
block 3
TTB friendly
Ind.
TTB
6
30.6 (4.4)
16.1 (3.3)
11.7 (2.0)
Dyad
TTB
7
26.9 (3.5)
8.1 (1.8)
10.4 (2.1)
WADD friendly
Ind.
WADD
10
28.3 (7.1)
23.5 (7.6)
19.2 (7.2)
Dyad
WADD
17
25.1 (4.6)
15.4 (4.3)
9.1 (3.5)
Note: Measure for information search
behavior and accordance with stopping rule were the percentage of trials in which
“too few” cues were opened by subjects classified as adaptive
WADD users and the proportion of compensatory choices for those
classified as adaptive take-the-best (TTB) users. Note that the
classification was based on the observed cues, for six strategies.
Table C.4:
Average values with SE in parentheses in
Experiment 2, in phase 1 (upper part) and phase 2
(lower part).
Phase 1
Environment
Condition
Classification
N
block 1
block 2
block 3
TTB friendly
Ind.
TTB
4
23.7 (5.6)
12.7 (6.4)
10.8 (8.1)
Dyads
TTB
4
34.4 (8.6)
11.3 (4.9)
5.9 (3.4)
WADD friendly
Ind.
WADD
15
16.8 (5.0)
12.8 (3.8)
11.0 (3.3)
Dyads
WADD
17
32.5 (7.5)
23.3 (6.8)
20.5 (6.0)
Phase 2
Environment
Condition
Classification
N
block 4
block 5
block 6
TTB friendly
Ind.
TTB
-
-
-
-
Dyads
TTB
2
53.8 (8.7)
32.1 (5.4)
23.4 (1.6)
WADD friendly
Ind.
WADD
11
42.7 (11.7)
36.5 (9.4)
31.1 (8.9)
Dyads
WADD
12
46.8 (9.3)
33.0 (9.2)
22.8 (6.5)
Note: Measure for information search behavior and accordance
with stopping rule were the percentage of trials in which
“too few” cues were opened by
subjects classified as adaptive WADD users and the proportion of
compensatory choices for those classified as adaptive
take-the-best (TTB) users. Note that the classification was based on the
observed cues, for six strategies.
Max Planck Institute for Human
Development, Center for Adaptive Behavior and Cognition,
Lentzeallee 94, 14195 Berlin, Germany. Email:kaemmer@mpib-berlin.mpg.de.
Max Planck Institute for Human Development,
Center for Adaptive Behavior and Cognition.
This research was funded by the Max Planck Institute for Human
Development, Berlin, Germany. We would like to thank Ulrich Klocke and
Torsten Reimer for helpful discussions, Henrik Olsson and two
anonymous reviewers for insightful comments on an earlier version of
this article, and Anita Todd and Katherine McMahon for editing the
manuscript. Thanks are also due to Gregor Caregnato and Jann Wäscher
for collecting the data.
The differently high discrimination rates of the most
valid cue had no effect on the times this cue was opened (i.e., its
opening rate) in the two environments: Opening rates were (first value for
the WADD-friendly environment, second for the take-the-best-friendly
environment) for oil-drilling site X 98.7%, 98.9%, and for oil-drilling
site Y 98.6%, 98.1%. Also in experiment 2, there were no
differences in the opening rates of the most valid cue between
environments: Opening rates were (first value for the WADD-friendly
environment, second for the take-the-best-friendly environment) for
oil-drilling site X in phase 1 96.4%, 96.3% and in phase 2 96.2%,
96.1%, and for oil-drilling site Y in phase 1 97.6%, 93.2% and
in phase 2 95.5%, 97.1%.
The
theoretical accuracy of alternative strategies such as Tally, WADD
with chance-corrected weights (i.e., chance-corrected WADD)
and naïve Bayes lay in between these two benchmarks. In detail (first value for the WADD-friendly
environment, second value for the take-the-best-friendly environment),
theoretical accuracies were Tally: .79, .58, chance-corrected WADD:
.73; .77, naïve Bayes: .69;
.81.
Using the same item sets repeatedly might invite
reliance on exemplar processing instead of strategy or cue-based
learning. In this case, decisions are based on the similarity
between cue-pattern of the target case and that of previously
encountered exemplars. People have been found to rely more on
exemplar knowledge when categorizing perceptual objects (Nosofsky
& Johansen, 2000) or making memory-based decisions when cue
abstraction is hindered (Platzer & Bröder, in
press). Additionally, the type of learning, be it comparison learning (i.e.,
learning which of two objects in a paired comparison has the higher
criterion value) or direct criterion learning (i.e., directly
learning an object’s criterion value), has been identified as an important moderating factor (Pachur &
Olsson, 2012). In the current study, learning by comparison may
occur, and it could foster cue-based mechanisms (Pachur & Olsson,
2012). Moreover, research on exemplar models provided evidence for a
“rule bias”, that is, that people tend to rely on rule knowledge
(e.g., validities) whenever possible (e.g., Juslin, Olsson, &
Olsson, 2003). We would thus expect that subjects will engage in
cue-based learning (i.e., learning to use WADD or take-the-best).
We did not test these
differences statistically because of the very unequal sample
sizes (n = 190 nominal dyads vs. n = 40 real dyads; Field,
2009). Moreover, it can be seen from the values that no practically
relevant differences are observable.
Tally is considered as the fourth alternative after
the strategies with the highest expected accuracy in the two
respective environments and a baseline guessing model, as is
usually done (e.g., Bröder & Schiffer, 2006). Tally (or Dawes’s
rule; Dawes, 1979) assumes that people sum up the positive cues and
choose the option with the larger total sum. It thus searches for
all information. In the WADD-friendly environments, it performed
second best (79%) and in the take-the-best-friendly environment it
performed worse than take-the-best (58%).
As the results of the
classification procedure depend on the number of competing
strategies, we report all subsequent results also for a second,
stricter classification procedure with six strategies in Appendix
C. For details see Table C.1 in Appendix C. The results concerning
information search for the reduced sample of classified adaptive
strategy users can be found in Table C.3.
The amount of contradictory evidence
can be measured in different ways, for example, by calculating the
weighted sum of all those cues that were opened after the first
discriminating one, for each option X and Y, and comparing these
sums with each other. If the first discriminating cue points to
X, for example (i.e., has a positive value for X), but the
weighted sum of cues opened after the first discriminating one is
larger for Y, this is regarded as contradictory
evidence. We report the results for this measure. An alternative way
would be to count the number of discriminating cues that follow the
first discriminating one and to note the direction in which they point. If,
after the first discriminating cue more discriminating cues follow
that point in the other direction (Y), this would be regarded as
contradictory evidence. These measures yield very similar results.
We are grateful to the
action editor Andreas Glöckner and reviewers for their suggestion
to integrate more strategies into our analyses as they allowed for a
more general interpretation concerning performance differences
between individuals and dyads.