| Figure 1: The percentage of correct answers when data are presented in frequencies. |
Judgment and Decision Making, Vol. 9, No. 3, May 2014, pp. 226-242
The effects of mental steps and compatibility on Bayesian reasoningShahar Ayal* Ruth Beyth-Marom# |
Four laboratory studies were conducted to test the hypothesis that correct Bayesian reasoning can be predicted by two factors of task complexity — the number of mental steps required to reach the normative solution, and the compatibility between the framing of data presented and the framing of the question posed. The findings show that participants performed better on frequency format questions only when one mental step was required to solve the task and when the data were in a compatible frequency format. By contrast, participants performed more poorly on more complicated tasks which required more mental steps (in a compatible frequency or probability format) or when the data and question formats were incompatible (Studies 1 and 2). Incompatibility between data and question formats was also associated with higher reaction times (Study 2b). Furthermore, on problems that incorporated incompatibility between the data sample size and the target (question) sample size, participants performed better on the probability question than the frequency question, regardless of data format (Study 3). The latter findings highlight the ecological advantage of translating data into probability terms, which are normalized in a range between 0 and 1, and thus can be transferred from one situation to another.
Keywords: Bayesian reasoning, mental steps, compatibility, natural
frequencies, conditional probabilities.
Dealing with uncertain prospects about risks and hazards (e.g., the probability of having breast cancer) requires people to have basic hypotheses about reality. These hypotheses need to be updated in light of new data, which may change prior beliefs or the relative strength of each hypothesis. Bayes’ theorem is considered to be a normative model for such hypothesis evaluation. In its simplest form, Bayes’ theorem expresses the implications of a datum [event] D when determining whether a hypothesis H is true relative to its complement, ¬ H. In such cases, the odds-version of Bayes’ theorem states that:
| = |
| · |
|
Reading from left to right, the three terms in the formula are: (a) the posterior odds that H is true (relative to ¬ H) in light of all that is known after inputting D; (b) the prior odds that H (relative to ¬ H) is true in light of all that is known prior to event or evidence D. These prior odds are the base rates for the hypotheses; (c) the likelihood ratio, representing the information value of D with respect to the truth of H (relative to ¬ H), also known as “the diagnosticity of D”. Thus from a Bayesian point of view, the relative belief in a set of hypotheses in terms of evidence D is a function of the prior belief in each one and the diagnosticity of the data. These two components are independent.
Bayes’ theorem has been used in the judgment and decision making literature as a tool for exploring naïve statistical reasoning and its systematic deviations from normative consideration. Studies have examined the way hypotheses are formulated, how component probabilities are assessed (prior and conditional probabilities) and how all components are aggregated into a final judgment (e.g., Fiedler, 1988; Fischhoff & Beyth-Marom, 1983; Gavanski & Hui, 1992; Kahneman, Slovic & Tversky, 1982; Trope & Bassok, 1982). Most of these studies have reported that the use of intuitive mechanisms for updating hypotheses tends to move decision makers further away from the correct normative benchmark, especially when participants are required to answer only a single problem (for a review see Birnbaum & Mellers, 1983).
The element of Bayes’ theorem that has probably attracted the most attention in this literature is the base rate component. The “base rate fallacy” refers to the tendency to allow one’s posterior beliefs to be dominated by the information extracted from D by ignoring the prior beliefs. For example, when testing two competitive hypotheses such as “John is a lawyer/John is an engineer”, even weak diagnostic information relating directly to John dominates the base rate information (the proportion of lawyers and engineers in the relevant sample) (e.g., Kahneman & Tversky, 1972, 1973; Koehler, 1996). Summarizing a set of empirical studies, Bar-Hillel (1980) concluded that “the genuineness, the robustness, and the generality of the base-rate fallacy are matters of established fact” (p. 215).
The following “mammography problem” (adapted from Eddy, 1982; see also Cosmides & Tooby, 1996) has been the subject of many Bayesian experimental studies in the last 30 years and illustrates the base rate fallacy:1
The probability of breast cancer is 1\% for a woman at age 40 who participates in routine screening. [P(H)]If a woman has breast cancer, the probability is 80\% that she will get a positive mammography result. [P(D/H)]
If a woman does not have breast cancer, the probability is 9.6\% that she will get a positive mammography result. [P(D/¬ H)]
A woman in this age group had a positive mammography in a routine screening.
What is the probability that she actually has breast cancer?___\% [P(H/D)]
The normative solution to this problem is based on the following normal-version of Bayes’ theorem2:
| P(H/D) = |
| = |
| = 0.078 |
However, Eddy (1982) reported that 95 out of 100 physicians estimated the posterior probability to be between 70\% and 80\%, rather than 7.8\%. This bias was attributed to participants’ disregard of the base rate component.
Along with many studies that have replicated the base rate fallacy (for a review see Bar-Hillel, 1980; Girotto & Gonzalez, 2001), the frequentistic approach claims that the main source of the base rate fallacy (as well as several other fallacies mentioned in the Kahneman and Tversky heuristics and biases approach) is the format of the probability question, since humankind did not evolve through calculating single-event probabilities. Rather, according to this natural frequency hypothesis, our minds have been tuned to natural frequencies acquired by natural sampling and not to probability or percentage. Thus, when information is presented in natural frequency formats the base rate fallacy can be reduced and sometimes even disappear (Cosmides & Tooby, 1996; Gigerenzer & Hoffrage, 1995, 2007; Hoffrage, Gigerenzer, Krauss & Martignon, 2002). For instance, very recently Garcia-Retamero and Hoffrage (in press) reported that doctors and patients made more accurate inferences when information was communicated in terms of natural frequencies rather than probabilities.
Table 1: Data used by Gigerenzer and Hoffrage (1995).
H ¬ H Total D 8 95 103 ¬ D 2 895 897 Total 10 990 1000
To analyze the effect of frequency format on Bayesian reasoning, the standard probability format is usually transformed into different frequency formats. The frequency format is based on a 2 x 2 table of frequencies such as Table 1, from Gigerenzer and Hoffrage (1995) (H stands for Hypothesis, e.g., disease is present; D stands for Datum, e.g., positive laboratory result).
From this table of frequencies, the probability format can be inferred directly by calculating the relevant relative proportions as a ratio between two frequencies (P(D/H)=8/10=0.8 ; P(D/¬ H)=95/990=0.096; P(H)=10/1000=0.01).
Gigerenzer and Hoffrage (1995) reported that there were more correct answers to the P(H/D) question in the frequency format (around 50\%) than in the probability format (around 20\%). The authors claimed that “Bayesian algorithms are computationally simpler when information is encoded in a frequency format rather than a standard probability format”; i.e., fewer calculations are needed and they can be done on natural numbers. They argued that the improvement in the percentage of correct answers is related to the fact that the frequency format is in accordance with an evolutionary-based computational algorithm (Brase, Cosmides & Tooby, 1998; Cosmides & Tooby, 1996; Gigerenzer & Hoffrage, 1995, 2007; Hoffrage et al., 2002). This is because humans have “inductive-reasoning mechanisms that embody certain rational principles, but the design of these mechanisms requires representations of event frequencies to operate properly” (Brase et al., 1998, p. 4). The frequentistic approach further claims that the base rate fallacy (as well as other judgmental fallacies) accounts for findings that failed to reveal inductive-reasoning mechanisms since people find it more difficult to “read” input in a non-frequency format. Therefore, changing probability formats back into natural frequency formats should dramatically improve the number of participants who take the base rate into account, enabling them to rediscover their Bayesian reasoning and get the right answer.
Do natural frequency-formats truly “improve Bayesian reasoning without instruction” (Gigerenzer & Hoffrage, 1995)? And if so, can we really conclude that frequency is a more adaptive mode of communication and that therefore people have developed a cognitive algorithm that is specifically tuned to frequencies?
Despite evidence replicating the frequency-probability effect (e.g., Brase et al., 1998; Cosmides & Tooby, 1996), there is still controversy regarding its underlying process (e.g., Girotto & Gonzalez, 2001, 2002; Lewis &Keren, 1999; Sloman, Over, Slovak & Stibel, 2003). For example, Lewis and Keren (1999) proposed that Gigerenzer and Hoffrage (1995) confounded two different factors affecting the comparison between probability and frequency formats: the use of frequency versus probability statements, and the use of joint (in the frequency formats) versus conditional (in the probability format) sampling information. They claimed that the information given to participants in the frequency format (8 out of 10 and 95 out of 990) is not the direct translation of the standard Bayesian probability format into a frequency format, but rather a much easier task based on the direct cell conjunction frequencies (i.e., enabling participants to calculate directly the proportion of 8 in 8+95). In contrast, the information given in the probability format is conditional data, which are known to be harder to represent and work with since they require more computations (see also Barbey & Sloman, 2007; Eddy, 1982; Evans, Handley, Perham, Over & Thompson, 2000; Girotto & Gonzalez, 2001; Moskowitz & Sarin, 1983). To test this claim, Lewis and Keren (1999) compared two frequency formats: the joint frequency format that was originally used by Gigerenzer and Hoffrage (1995) and the conditional frequency format, which according to Lewis and Keren is the right translation of the standard probability format. In line with the authors’ hypothesis, the results showed that 30\% of the participants correctly answered the joint frequency question (the one originally used by Gigerenzer and Hoffrage), but only 4\% correctly answered the conditional frequency question and thus scored even worse than Gigerenzer and Hoffrage’s participants in the probability format.
A very similar claim was advanced by Mellers and McGraw (1999), who suggested differentiating between systematic sampling and natural sampling in frequency versions of Gigerenzer and Hoffrage’s problems. According to these authors, there are two ways to translate a probability version into a frequency version — the one used by Gigerenzer and Hoffrage (which Mellers and McGraw define as “a frequency task with natural sampling”) and the one employed by Lewis and Keren (which Mellers and McGraw define as “a frequency task with systematic sampling”). The greater number of correct answers in the natural sampling can be attributed to the fact that natural sampling allows people to visualize nested sets (8 out of 103 is easily perceived), whereas systematic sampling precludes such direct perception (see also Hoffrage et al., 2002).
The focus on the ease of perceiving the relevant set was further explored by Evans et al. (2000) as well as Sloman et al. (2003). These studies used a variety of examples to show that frequency formats were associated with better reasoning performance than standard probability formats only when they were presented in a manner that facilitated the construction of a set inclusion mental model (see also Barbey & Sloman, 2007; Gavanski & Hui, 1992). Evans et al. (2000) summarized their studies as follows: “Our view was that none of the experiments in those papers compared frequency and probability versions that were precisely controlled in other respects …. The reason that participants were more successful on the frequency versions was that these problems cued a mental model of set inclusion which made the problems much easier to understand” (pp. 210–211). In other words, translating probability data and questions into frequency data and frequency questions might improve assessments in “base-rate like problems” but only under specified conditions that clarify the critical nested sets relations.
Importantly, Hoffrage et al. (2002) responded to these alternative explanations by identifying some of the specific moderators associated with the facilitating effect of the frequency format. Specifically, they differentiated between natural frequencies, a result of natural sampling, and normalized frequencies, a result of systematic sampling. When natural frequencies are presented (10 out of 1000 have cancer; 8 out of the 10 with cancer are positively diagnosed; 95 out of the 990 without cancer are positively diagnosed), the data enable participants to fill in a 2 x 2 table (comparable to Table 1) and infer the correct posterior probability (or frequency). On the other hand, when normalized frequencies are presented (10 out of 1000 have cancer, 800 out of 1000 with cancer are positively diagnosed; about 96 out of 1000 without cancer are positively diagnosed), the posterior probability cannot be directly inferred and the computation is much more complex.
In fact, in Bayesian problems with natural frequencies, the data and the question presented to participants relate to the same sample. Thus, participants can bypass the Bayesian formula and directly assess the posterior hypothesis by relying on the relevant set of D (103) and assess the proportion of H in D (8 of 103). Although this bypass can lead to an increase in the number of correct answers in Bayesian-like problems, it does not necessarily improve people’s understanding of the role of base rate in uncertainty judgments (Beyth-Marom & Arkes, 1983; Gavanski & Hui, 1992). However, in a Bayesian problem with normalized frequencies (as with percentages or probabilities), participants can choose one of two strategies to solve the problem: (a) transform the normalized frequencies into natural ones (translate the 800 in 1000 into 8 out of 10 and translate the 96 in 1000 into 95 out of 990) and then bypass the Bayesian formula in the same way as can be done when natural frequencies are presented; (b) treat the normalized frequencies as probabilities, which they actually are, and use the Bayesian formula. Both strategies are much more cumbersome than the direct strategy that can be adopted when natural frequencies are presented.
To sum up, most of the evidence points to the fact that under certain conditions, frequency formats can simplify a task and elicit better Bayesian reasoning than probability formats. The current studies were designed to shed more light on Bayesian reasoning research via four main goals: (a) define two general factors of task complexity; (b) explore the conditions in which frequency formats using data and questions are preferred; (c) test the role of individual differences in numerical ability on the specific case of base rate neglect; and (d) find the possible cost associated with the use of frequencies over probabilities.
Two main conclusions can be drawn from the above studies on the effect of the frequency format: (1) when comparing a frequency format to a probability format, additional variables (e.g., the number of computational steps required to solve the problem) are often not controlled for; (2) the advantage of frequency formats depends on a number of other variables, all of which play a role in people’s performance. As discussed earlier in the context of base rate problems, a variety of variables have been shown to influence performance and can decrease (or increase) the percentage of correct answers. Thus, there is a special need to define more general factors that may account for better or worse performance with frequency formats over probability formats across different studies.
Here, we posit that performance on base-rate-like problems depends directly on the complexity of the task, and that complexity is governed by two factors.
The first factor is the number of mental steps needed to reach the normative answer, and the second factor relates to the compatibility between the data and the question characteristics, i.e., the fit between data and question formats as well as between the basic sample size that appears in the data and the target sample size that appears in the question.
In fact, both factors have been identified in other judgmental tasks but can only be indirectly derived from studies in the base rate domain (e.g., Girotto & Gonzalez 2001; Sloman et al., 2003). The idea of the number of mental steps was originally presented in other decision-making domains by Johnson and Payne (1985) and Bettman, Johnson and Payne (1990). These authors defined cognitive effort as the total cognitive resources required to complete a task. Thus cognitive effort can be operationalized by decomposing a task into a series of Elementary Information Processes (EIPs); each EIP is defined as a one mental step, and tasks that include more EIPs take more time to be solved (Bettman et al., 1990). Similarly, any Bayesian problem can be characterized by the number of mental steps required to reach the correct answer. This number of mental steps represents the overall complexity of the problem; hence when it increases, it should directly reduce the percentage of correct responses as well as lengthen the reaction time (RT). For example, in their simplest task (called the “short menu”), Gigerenzer and Hoffrage (1995) presented participants with the number of “D & H” (the number of women with a positive result and with the disease) and “D” (number of women with a positive result) and asked them to state the percentage of woman having the disease given a positive result. The correct answer is based on a simple normative rule (“divide the former number by the latter”, i.e., calculating the posterior conditional probability or frequency by dividing the conjunction D & H, by D), which requires only one calculating step. However, in what Gigerenzer and Hoffrage (1995) called the “standard menu”, the correct answer was based on a much more complicated normative rule that required more calculating steps. In both formats (frequency and probability), the complexity of the task depended on the number of mental operations solvers had to perform before reaching the answer; the more steps required, the lesser the likelihood that participants would correctly solve it. Thus, the complexity of the task is dramatically affected by the structure of the data presented (see also Girotto & Gonzalez, 2001).
Compatibility was introduced in the field of human engineering, where it was shown that stimulus-response compatibility is an important factor in optimizing the relationship between technology and human operators (Kantowitz, Triggs & Barnes, 1990; Kornblum, Hasbroucq & Osman, 1990). In psychology in general and in judgment and decision-making in particular, high compatibility between the format of the data and the response scale has been shown to improve performance (e.g., Fischer & Hawkins, 1989; Lichtenstein & Slovic, 1971; Slovic, Griffin & Tversky, 1990). In Bayesian tasks, compatibility might be affected by two sources: (a) scale compatibility involving the compatibility between the data presented (frequency or probability data) and the format of the question presented to participants (a frequency question or a probability question). When there is no such scale compatibility, more mental steps are needed to answer the question; (b) sample-size compatibility which refers to the compatibility between the basic sample size from which the data are drawn and the target sample size to which the conclusion needs to be applied. Importantly, incompatibility between sample sizes in this sense is only relevant when the question is presented in a frequency format, since probabilities are not sensitive to the sample size and thus can be transferred from one sample size to another sample size without any further computation. Therefore, incompatibility between sample sizes is expected to negatively affect performance only in the frequency format question, but not in the probability format question.
It is also important to note that overcoming these two types of incompatibility requires some transformations (i.e., mental steps), which complicate the task (by drawing attention to the relation between those two dimensions) and lengthen the reaction time required to solve it. These kinds of transformations, such as the transformation between probabilities and frequencies, and percentages and fractions, are the primary capabilities tested by the Numeracy scale (Lipkus, Samsa & Rimer, 2001; Peters et al., 2007). Recent findings on this scale show that “…more errors are made on questions that involve multiplication or conversions from one metric to another (e.g., converting frequencies to percentages)” (Lipkus & Peters, 2009). It can thus be assumed that people who are low in numeracy will have more difficulties (compared to high numeracy individuals ) solving Bayesian type problems when there is incompatibility between the data format and question format, as a transformation from one scale to the other is needed.
Four laboratory studies were conducted to explore the effects of mental steps and compatibility on Bayesian reasoning. In Study 1 the data were presented in natural frequencies and we manipulated (1) the number of mental steps needed to solve a Bayesian problem, and (2) the scale compatibility between the format of the data (natural frequencies) and the format of the question (either a frequency or a probability question). The number of steps was manipulated by the kind of data given to participants.
Studies 2a and 2b further focused on scale compatibility between data and question, but the data were presented either in a probability or a frequency format (with the minimal number of steps held constant), while the question was posed either in a probability or a frequency format. In both studies participants completed a numeracy questionnaire to test the relationship between numeracy and Bayesian reasoning under compatible and incompatible conditions. In Study 2b we tested external validity by using a novel scenario, and also explored the effect of compatibility on reaction time.
Finally, Study 3 was constructed to test the effect of sample size compatibility (i.e., the match between the sample size of the data presented and the sample size of the question). These settings require a generalization from one sample to another, and thus enabled us to test potential cost in the natural frequency format. More specifically, when the question sample is not compatible in size to the target sample, we predicted that frequency formats of the question would require more mental steps than probability formats, and thus should decrease rather than increase the number of correct answers.
The first study was designed to test the basic rationale of the mental step hypothesis, which states that performance on a Bayesian problem will deteriorate when the number of mental steps required to reach the normative solution is increased. In order to test this hypothesis, we used only data presented in a natural frequency format and manipulated the number of mental steps necessary to solve a Bayesian problem.
To test the scale compatibility rationale, the format of the questions posed to participants was manipulated: half of the participants were presented with a frequency question (high compatibility between data and question) and the other half were presented with a probability question (low compatibility). We expected to find better performance in the frequency than in the probability conditions in each of the mental step conditions.
234 students (192 females, 42 males) enrolled at a university in central Israel served as participants in this experiment. Their ages ranged from 19 to 31 (M=23, Sd=1.97). Eight different questionnaires were randomly distributed.
Table 2: Data used in Study 1.
H (with breast cancer) ¬ H (without breast cancer) Total D (positive test result) a = 8 b = 92 a+b=100 ¬ D (negative test result) c = 2 d = 898 c+d=900 Total a+c=10 b+d=990 N=1000
The study employed a 4 (number of steps needed to solve the problem: 1, 2, 3 or 4 steps) by 2 (type of question: a frequency or a probability question) between- subject design. Thus, there were 8 groups of participants each receiving a different questionnaire. We employed the well-known “mammography problem” used by Gigerenzer and Hoffrage (1995) (adapted from Eddy, 1982). Table 2 shows the numbers we used for the problem in the experiment.
All participants read the following introduction:
A mammography is a test to detect breast cancer. However, the instrument is not 100\% reliable. The following data describe frequencies for 1000 women who were tested: the number of women with breast cancer out of those tested as well as the frequencies for false positives and false negatives on the Mammography test. After reviewing the data, answer the question that follows it.Note: Some of the data might be superfluous for the evaluation needed, but none are inconsistent.3
Table 3: Data presented and steps needed to solve the problem.
Condition Sentences presented ¬ H H Total Steps to get the solution* one step 1, 3, 4, 5 D 8 92 100 Step 4 ¬ D 10 1000 two step 1, 2, 4, 7 D 8 92 100 Steps 3, 4 ¬ D 10 990 1000 three step 1, 2, 6, 7 D 92 100 Steps 2, 3, 4 ¬ D 2 10 990 1000 four step 1, 2, 6, 7 D Steps 1, 2, 3, 4 ¬ D 2 898 10 990 1000 * Steps to get the solution: 1. (D ∩ ¬ H) = (¬ H) − (¬ D ∩ ¬ H) = 990 − 898 = 92 2. (D ∩ H) = (H) − (¬ D ∩ H) = 10 − 2 = 8 3. (D) = (D ∩ H) + (D ∩ ¬ H) = 8 + 92 = 100 4. P(H/D) = (D ∩ H)/(D) = 8/100
Then, each of the participants was given 4 out of the following 8
sentences to read:
1) 10 of the 1000 tested women have breast cancer [(a + c) out of N]
2) 990 of the 1000 tested women don’t have breast cancer [(b + d) out of N]
3) 100 of the 1000 tested women are diagnosed positively (as having breast cancer) [(a + b) out of N]
4) 8 of the 10 women with breast cancer are positively diagnosed [a out of (a+c)]
5) 92 of the 100 women diagnosed positively don’t have breast cancer [b out of (a+b)]
6) 2 of the 10 women with breast cancer are negatively diagnosed [c out of (a+c)]
7) 92 of the 990 women without breast cancer are positively diagnosed [b out of (b+d)]
8) 898 of the 990 women without breast cancer are negatively diagnosed
[d out of (b+d)]
In each condition, a different set of four sentences was presented to participants. The sets differed in the number of steps required to answer the question correctly (consistent with the set of data they were given). In all conditions, the format of the question posed to participants was manipulated to be either a frequency or a probability question.
Table 3 presents the data given in each of the conditions and the calculations needed to get the answer for either the frequency question (the numerator in the last step) or the probability question (the numerator in percentages). As can be seen, in each condition in the sequence, an additional step is needed to reach the normative answer (P (H/D) in the probability condition, or N (H/D) in the frequency condition).
After reading the four sentences, all participants were asked to respond to one question. Participants in the “frequency question” conditions read the following question:
Based on the data presented, write down your best estimate regarding the following question: in a new sample of 100 women who were tested positive on the mammography test, what is the number of women expected to actually have breast cancer?
Note that the new sample of women who tested positive is of the same magnitude (same size) as the positively diagnosed women in the original sample (100).
Participants in the “probability question” conditions read the following question:
Based on the data presented, write down your best estimate regarding the following question: A woman was tested positive on the mammography test. What is the probability that she actually has breast cancer? (give a number between 0\% and100\%).
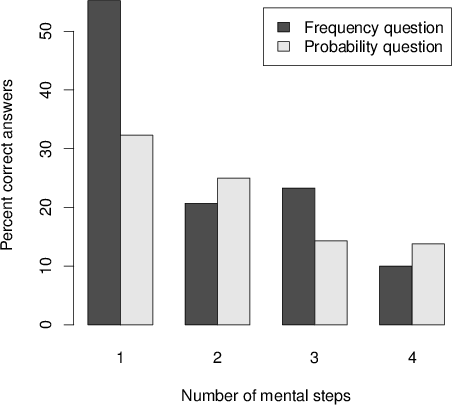
Figure 1: The percentage of correct answers when data are presented in frequencies.
The correct answer according to the normative Bayesian rule is 8\% in all four conditions on the probability question (P1 to P4) or 8 out of 100 in all four conditions on the frequency question (F1 to F4). To test our first hypothesis that increasing the number of necessary steps should reduce the number of correct answers, we compared the overall percentage of correct answers in each condition. As shown in Figure 1, the one step conditions for both question formats led to the highest percentage of correct answers (55.2\% for F1 and 32.3\% for P1). The lowest percentage of correct answers in the two question formats was found for the four step conditions (10\% for F4 and 13.8\% for P4). This monotonic reduction in the proportion of correct answers as a function of increasing the number of necessary steps (when the two formats are combined) was significant in a one-tailed chi-square linear-by-linear association test (χ2(1,n=234) = 15.601, p<0.001). This linear reduction was also significant when we tested each of the two question formats separately: frequency format (χ2(1,n=118) = 12.992, p<0.001) and probability format (χ2(1,n=116) = 3.823, p=0.025). Interestingly, as can be seen from Figure 1, the greatest drop as a result of one additional step occurred between F1 and F2 (55.2\% to 20.7\%, respectively). However, in all the other frequency and probability conditions, adding an additional step led to a moderate reduction in the percentage of correct answers. One exception was the small improvement between F2 and F3, but this improvement was not significant.
To test the second hypothesis that lower scale compatibility between data and question reduces performance, we compared the percentage of correct answers in the compatible format (data and question in frequencies) versus the percentage of correct answers in the incompatible format (data in frequencies, question in probability) for each number of step conditions. In the one-step condition, this percentage was indeed much higher in the compatible format (55.2\%) than in the incompatible format (32.3\%) and this difference was significant in a one-tailed chi-square test (χ2(3,n=217) = 17.713, p=0.037). When the number of steps was greater than 1, however, no significant difference between the compatible and incompatible formats was obtained. Although the compatible format elicited a higher percentage of correct answers (23.33\%) than the incompatible format (14.29\%) in the three-step condition, this difference was not significant in a one-tailed chi-square test (χ2(1,n=58) = 0.771, p=0.19). Moreover, in both the two- and four-step conditions, the compatible format elicited lower rather than higher percentages of correct answers. Here again, however, the differences were not significant. Thus, compatibility had an effect when the question was relatively simple (i.e., one step condition), but this effect was eliminated when the question became more complicated.
Overall, these results partially replicate the natural frequency effect that was reported in previous studies (Brase, Cosmides, & Tooby, 1998; Cosmides & Tooby, 1996; Gigerenzer & Hoffrage, 1995) showing that when all the data are presented in a natural frequency format, participants do significantly better on the frequency question than the probability question. However, the results also support the mental steps hypothesis that performance on a Bayesian question (with natural frequency data) will deteriorate when the number of mental steps needed to solve it are increased, independently of the question format.
These findings leave some questions unresolved. How general is the observed advantage of frequency over probability in the one step condition? Does it reflect a general scale compatibility effect or rather an exclusive advantage of a full frequency format? Moreover, is the effect content specific? Studies 2a and 2b were aimed to explore these questions as well as test the effect of numeracy as another independent variable (in Studies 2a and 2b) and reaction time as an additional dependent variable (in Study 2b).
To test whether the scale compatibility between data and questions could be generalized to situations in which the data are presented in a probability format, all participants in Study 2a were given problems that were equivalent to the one-step problems in Study 1, but the data were presented in a probability format. We manipulated the questions presented to participants to be either in a probability format (in the compatible condition) or in a frequency format (in the incompatible condition).
Because scale incompatible conditions require more mathematical transformations than compatible conditions to solve the base-rate problem, we also made a prediction concerning individual differences; namely that low numerate participants (vs. high numerate) would be more affected by the scale incompatibility between the data presented and the question posed (for recent research on this topic see Chapman & Liu, 2009; Hill &Brase, 2012; Garcia-Retamero& Hoffrage, in press).In order to test their numeracy ability, all participants were required to complete a numeracy questionnaire and were classified on this basis as either low or high numerate. The predicted difference in correct answers between the two conditions, compatible>incompatible, was expected to be higher for low numerate participants than for high numerate participants.
130 MBA students (55 females, 75 males) at a private mid-Atlantic university in the US served as participants in the experiment. Their ages ranged from 21 to 34 (M=26.75, Sd=2.9). All participants were paid a total show up fee of $8.
We used the “mammography problem” data, and
instructions from the one-step questionnaire in Study 1. However the
data were presented in a probability format as shown below in the
following four sentences:
1. The probability of a woman to actually have breast cancer is 1\%. [P(H)]
2. The probability of a woman to be positively diagnosed (as having breast cancer) is 10\%. [P(D)]
3. The probability of a woman with breast cancer to be positively diagnosed is 80\%. [P(D/H)]
4. The probability of woman who has been diagnosed positively
not to actually have breast cancer is 92\%. [P(¬ H/D)]
This problem can be solved in one step: P(H/D)=1−P(¬ H/D)=100−92=8.
Then, the participants were randomly divided into two groups and each group was given either the probability format question (in the “compatible condition”) or the frequency format question (in the “incompatible condition”).
Finally, after a number of unrelated tasks, all participants took the numeracy questionnaire. We used a new 8-item numeracy scale (Lipkus & Peters, 2009) which is an abbreviated version of the 15-item numeracy scale used in Peters et al. (2007). The scale is comprised of 8 short questions (e.g., “In the ACME PUBLISHINGSWEEPSTAKES, the chance of winning a car is 1 in 1,000. What percent of tickets in the ACME PUBLISHING SWEEPSTAKES wins a car?”). Participants were asked to solve all 8 items to the best of their ability, as quickly as they could and without using a calculator. The full questionnaire and the percentage of correct answers on each item are presented in Appendix A.
The mean Numeracy Score was 6.17 (median = 7) out of 8 (range 0–8, α =0.78).
Figure 2: The percentage of correct answers when data are presented as probabilities. 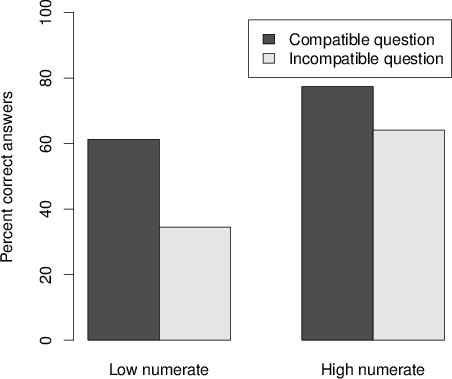
We first conducted a logistic regression to test the effect of scale compatibility as a categorical independent variable and numeracy as a continuous independent variable on the percentage of correct answers as the dependent variable. In line with the compatibility hypothesis, we found a significant main effect for scale compatibility (B=0.838, Wald=4.99, p=0.025). However, our numeracy predictions were not supported when numeracy was treated as continuous variable since the main effect of numeracy and the interaction between numeracy and scale compatibility did not reach significance.
To further investigate these results, and since the numeracy distribution was highly skewed in this sample of participants, we performed a median split on the numeracy measure (for justifications of this procedure in skewed samples see also MacCallum, Zhang, Preacher, & Rucker, 2002; Peters et al., 2006; Peters et al., 2007) and compared the participants who were high numerate (7 or 8 correct, n=70) to those who were low numerate (0–6 items correct, n=60). In line with our hypothesis, the percentages of correct answers were higher among the high numerate participants (70\%) than the low numerate participants (48.3\%) (χ2(1,n=130) = 6.319, p=0.006). Strikingly, however, different patterns of results were observed in the high and low numerate participants. As shown in Figure 2, for the low numerate participants, there was a significant difference between the percentage of correct answers in the compatibility condition (61.3\%) and the incompatibility condition (34.5\%) (χ2(3,n=60) = 4.312, p=0.019). However, among the high numerate participants, the difference in percentages of correct answers between the compatible (77.4\%) and the incompatible conditions (64.1\%) was smaller and non-significant (χ2(1,n=70) = 1.459, p=0.113).
Taken together, these results lend credence to the scale compatibility effect obtained in Study 1 and suggest that this effect was not restricted to the full frequency format alone. When the original data were presented as probabilities, the probability question resulted in better performance than the frequency question. Further, the median-split analysis of numeracy ability supported our claim that incompatibility conditions are more difficult because more transformations are needed. This can be concluded from the fact that high numerate participants, who scored better on the numeracy questionnaire involving these kinds of transformations, not only exhibited better performance, but also showed less sensitivity to the scale compatibility effect.
In Studies 1 and 2a we manipulated compatibility by changing the format of the question while holding the format of data constant (frequency in Study 1 and probability in Study 2a).
The aim of Study 2b was to integrate these two studies and test the scale compatibility hypothesis in one experimental design by manipulating both the data format and the question format. Furthermore, to increase external validity we created a novel scenario as a cover story for the base rate task, and programmed this task as well as the translation of the numeracy scale (Lipkus & Peters, 2009). This computerized setting enabled us to measure Reaction Time (RT) in the base rate task and test another facet of the compatibility hypothesis. Based on previous findings indicating that simpler tasks are associated with faster RTs (Ayal & Hochman, 2009; Payne, Bettman & Johnson., 1993) we hypothesized that RTs would be faster for compatible conditions than for incompatible ones regardless of the specific data or question format.
166 undergraduate students (77 females, 89 males) enrolled at two universities in central Israel volunteered to participate in this experiment for a show-up fee of 20NIS ($5.60). Their age ranged from 18 to 51 (M=25.54, Sd=4.5). The participants were randomly assigned to four different versions of the computerized task.
The study was programmed on visual basic and was conducted in the computer lab of the two universities. The study employed a 2 (type of data: Frequency or a Probability format) by 2 (type of question: Frequency or a Probability format) between-subject design, creating four different conditions, each of which was made up of a different combination of data and question (i.e., FF, FP, PF, PP). We used an original one-step scenario in this study that we dubbed the fraud detection scenario. Participants in all the four conditions read the following introduction to this scenario:
Table 4: The two data and question formats presented in Study 3. Each participant was given one type of data and one type of question.
Frequency format Probability format Data presented 1. 75 out of every 1000 policyholders who filed a claim filed a fraudulent one. 1. The probability that a policyholder who filed a claim filed a fraudulent claim is 7.5\%. 2. 200 out of every 1000 policyholders who filed a claim were classified by the device as being a “dishonest claimant”. 2. The probability that a policyholder who filed a claim was classified by the device as a “dishonest claimant” is 20\%. 3. 50 out of every 75 policyholders who filed a fraudulent claim were classified by the device as a “dishonest claimant”. 3. The probability that a policyholder who filed a fraudulent claim was classified by the device as a “dishonest claimant” is 66.7\%. 4. 150 our of 200 policyholders who were classified by the device as a “dishonest claimant” filed a valid claim. 4. The probability that a policyholder who was classified by the device as a “dishonest claimant” filed a valid claim is 75\%. Questions presented In a new sample of 200 people who were examined by the device and classified as a “dishonest claimant”, how many do you think the fraudulent claims? _____ (indicate a number between 0-200) In a new sample of 200 people, a claimant was examined by the device and classified as a “dishonest claimant”. What is the probability that he filed a fraudulent claim? _____ (indicate a percentage between 0\% to 100\%)
A researcher at the Technion approached a well- known insurance company and offered to install a device to detect policyholders who file fraudulent claims. The device works by classifying the claims into two categories: 1. those filed by honest claimants, 2. those filed by dishonest claimants. The device is not 100\% accurate. The researcher presented the insurance company with data compiled during a longitudinal study that examined the frequency of fraudulent claims and the device’s ability to correctly or incorrectly detect them as fraudulent.
Then, participants were presented with the data either in frequency or probability format (see the first row of Table 4). Note that participants were advised that the data were never contradictory but some of the data could be redundant or obsolete and therefore irrelevant to this assessment.
After examining the data carefully, participants were asked to click on the “Question” button, and answer this question. Here again, the question was displayed either in probability or frequency format (see the second row in Table 4). It is important to note that the instructions encouraged all the participants to indicate their most accurate assessment as quickly as they could and the software measured their reaction time (RT) from the time they first pressed the Question button to the time they finally sent their answer and moved to the next question. In addition, all participants completed the computerized version of the 8-item numeracy scale (Lipkus & Peters, 2009). At the end of the session we thanked the participants and they received a short debriefing about the general purposes of the study.
Figure 3: The percentage of correct answers as a function of the compatibility between data and question. 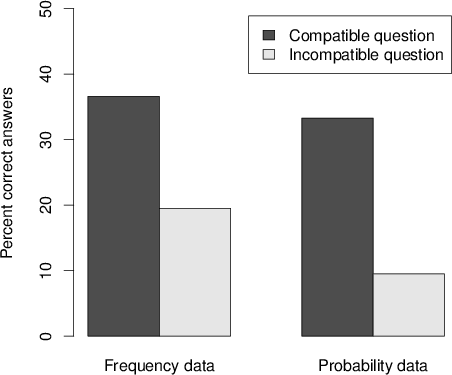
According to the normative Bayesian rule, the correct answer for the fraud detection scenario is 50 out of 200 on the frequency question or 25\% on the probability question. Correct answers were coded as 1 and wrong answers were coded 0. We then compared the percentage of correct answers in the compatible conditions (FF and PP) to the correct answers in the incompatible conditions (FP and PF). In general, the accuracy level in Study 2b was much lower than in Study 2a, but the main pattern of results was replicated. In line with our scale-compatibility hypothesis, there were more correct answers in the compatible conditions (34.9\%, 29 out of 83) than in the incompatible conditions (14.5\%, 12 out of 83) and this difference was significant(χ2(1,n=166) = 9.361, p=0.001, one tailed). Specifically (as can be seen in Figure 3), when the data were presented in a frequency format, the percentage of correct answer was higher in the FF condition (36.6\%, 15 out of 41) than in the FP condition (19.5\%, 8 out of 41), and this difference was significant (χ2(1,n=82) = 2.961, p=0.043, one-tailed). Similarly, when the data were presented in a probability format, the percentage of correct answers was higher in the PP condition (33.3\%, 14 out of 42) than in the PF condition (9.5\%, 4 out of 42) and this difference was significant(χ2(1,n=84) = 7.071, p=0.004, one tailed). Importantly, a logistic regression with data and questions as categorical independent variables and the correct answer as the dependent variable confirmed the significant interaction between data and question (B=0.606, wald=9.124, p=0.003) without significant main effects for either the data or the question format.
The scale-compatibility hypothesis was further supported by the reaction time results (RT). The mean RT in the compatible conditions (FF and PP, M=70.98, SD=53.62) was significantly faster than the mean RT in the incompatible conditions (FP and PF, M=95.21, SD=74.35) (t = 2.408, p=0.0085 one-tailed). Specifically, when the data were presented in a probability format, participants in the PP condition (M=71.48, SD=55.80) were faster than participants in the PF condition (M=90.03, SD=74.72) but this difference was not quite significant (t = 1.74, p=0.101 one-tailed). However, when the data were presented in a frequency format, the RT of participants in the FF condition (M=70.47, SD=51.98) was faster than the RT of participants in the FP condition and this difference was significant (M=100.52, SD=74.52 (t = 2.12, p=0.019 one-tailed). Importantly, a two way ANOVA with data and question as the independent variables and RT as the dependent variable revealed a significant interaction between data and question (F(1,162)=5.78, p=0.017) without significant main effects for either the data or the question format. That is, the RT results clearly showed that participants responded faster to compatible conditions than to incompatible ones. Nevertheless, the participants were also more accurate in the compatible conditions that required fewer data transformations.
Finally, we further examined the effect of numeracy and specifically the prediction that numeracy can serve as moderator for the scale-compatibility effect. The numeracy distribution of this sample was less skewed and more similar to previous findings (compared to the numeracy distribution of Study 2a). The Mean Numeracy Score was 5.1 with 47\% of the participants scoring 5 correct answers or below (range 0–8, α =0.62).
Comparing the participants who were high numerate (6 correct answers or more, n=81) with those who were low numerate (5 correct answers or less, n=78) replicated the main effect for numeracy obtained in Study 2a. Specifically, the percentage of correct answers was higher among high numerate participants (33\%) compared to low numerate participants 15.4\% (χ2 (1, n=166) = 6.86, p<.01).
Logistic regression with numeracy as the continuous independent variable and compatibility as the categorical independent variable and the percentage of correct answers as the dependent variable revealed a significant main effect for numeracy (B=0.545, Wald=5.209, p=0.022) and a significant main effect for compatibility (B=0.603, Wald=8.386, p=0.004) showing that both were valid predictors of correct response on the fraud detection scenario. However, the interaction between numeracy and compatibility (which was significant in Study 2a) was not significant in the present study (B=0.120, Wald=0.253, p=0.615).The drop in the correct answer rate between the compatible and incompatible condition was significant both for the high numerate participants(44.2\% to 22.2\%, χ2 (1, n=88) = 4.801, p=0.014 one-tailed) as well as for the low numerate participants(25\% to 5.3\%, χ2 (1, n=78) = 5.381, p=0.008 one-tailed).4
To sum up, the overall results suggest that the accuracy level as well numeracy ability were much higher in Study 2a than in Study 2b, but the main pattern of results was replicated. The two studies strongly support the scale-compatibility hypothesis and show that compatibility between data and question affects the accuracy level on Bayesian tasks over and above the specific format and numeracy ability. The idea that numeracy can serve as a moderator for this compatibility was supported only in Study 2a but not in Study 2b (see also Chapman & Liu, 2009 and Hill & Brase, 2012 for a review about mixed results regarding this interaction between numeracy ability and numerical formats). Importantly, our results demonstrate that as the task gets more difficult (task 2b vs. task 2a) even the accuracy level of high numerate participants is hampered by scale incompatibility.
Studies 1, 2a and 2b focused on the effects of mental steps and scale compatibility between data and questions. The findings from these studies show that frequency questions have an advantage over probability questions when the data are presented in frequencies (and only one mental step is required to reach the correct solution), but this advantage of the frequency question format is reversed when the data are presented in probabilities: in this latter case, a probability question format yielded a higher percentage of correct answers. However, according to the evolutionary point of view, it can be argued that probability data formats are seldom represented in reality since real life situations embody data collections (and representations) of concrete event frequencies rather than probabilities that cannot be observed. Therefore, computing the posterior odds in terms of natural frequencies rather than in terms of probabilities is more likely to result in well calibrated estimates of these odds, and ultimately, in better decisions (Brase, Cosmides, & Tooby, 1998; Cosmides & Tooby, 1996; Gigerenzer & Hoffrage, 1995).
The next study challenges this assumption and suggests that, even when the data are presented only in a natural frequencies format, the advantage of the frequency format over a probability format is limited to certain conditions, and can be eliminated and even reversed under different ones. We have already shown one such condition — the complexity of the task as measured by the number of steps needed to solve it, where the advantage of natural frequencies disappeared when the task was more difficult. Another possible moderator for the frequency effect is what we termed “sample-size” compatibility. More specifically, we differentiated between two sources of compatibility: scale compatibility and sample size compatibility. Scale compatibility was already discussed in the introduction to the first two studies, and sample-size compatibility is the compatibility between the basic sample size from which the data are drawn and the target sample size to which the answer should be applied.
Study 3 was designed to test how these two sources of compatibility work in concert. First, we again manipulated scale compatibility by presenting data in natural frequencies, and only manipulated the questions to be either in a frequency or a probability format. Second and most importantly, in each of the question formats we manipulated the sample-size compatibility. Half of the participants answered the question based on the same sample size that was originally described in the data (i.e., the compatible sample-size condition), whereas the other half of the participants answered the question based on a much smaller sample size (i.e., incompatible sample-size condition). In the frequency format questions, we expected to observe higher performance in the compatible sample size condition compared to the incompatible sample-size condition. In the probability format questions, however, no difference was expected between these two conditions because probabilities can be transferred, independently of the sample-size.
92 undergraduate students (76 females, 16 males) at a university in central Israel served as participants in the experiment. Their ages ranged from 18 to 28 (M=22, Sd=1.84).
All participants were given the same “mammography problem”, frequency data and instructions from the one-step questionnaire in Study 1 (which had a sample size of 100.). The study employed a 2 (type of question: frequency or probability) by 2 (compatible or incompatible sample-size) between-subject design. Therefore there were 4 groups of participants, each receiving a different questionnaire.
The manipulated variables between the four groups were the format of the questions (frequency vs. probability) and the size of the target sample (n=100 in the compatible condition and n=25 in the incompatible condition) on which the conclusion was to be drawn. Participants in the two frequency conditions (F100 and F25) were given the following question:
Based on the data presented, write down your best estimate regarding the following question: In a new sample of [100, 25] women who tested positive in the mammography test, what is the number of women expected to actually have breast cancer?
The two probability conditions (P25 and P100) were given the following question:
Based on the data presented, write down your best estimate regarding the following question: In a new sample of [100, 25] women who tested positive in the mammography test, choose one woman at random. What is the probability that she actually has breast cancer? (Give a percent between 0\% and 100\%).
Figure 4: The percentage of correct answers when data are presented in frequencies. 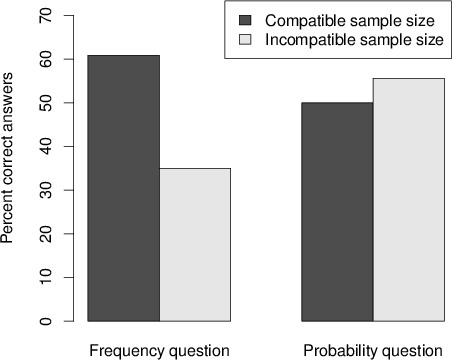
According to the normative Bayesian rule, the two frequency question conditions differ in the correct answer: 8 out of 100 in the F100 condition and 2 out of 25 in F25 condition. However, in both probability conditions (P25 and P100), 8\% is the correct answer.
The results support our hypothesis for sample-size compatibility. As shown in the left part of Figure 4, the frequency question elicited a marked difference in percent of correct answers between the two sample conditions. In the F100 condition, where the two sample sizes were compatible, 60.9\% (14 out of 23 participants) answered correctly. On the other hand, in the F25 condition, where the target sample size was not compatible with the basic sample size, only 35\% (7 out of 20 participants) of the answers were correct. A one-tailed chi-square test revealed that the difference between these two frequency conditions was significant (χ2(1,n=43) = 2.865, p=0.0455 one-tailed).
As predicted, a different pattern was obtained in the probability question. As shown in the right part of Figure 4, the percentage of correct answers on the probability question condition was 50\% in P100 (11 out of 22) and 55.6\% in P25 (15 out of 27 participants). However, the difference between the two probability conditions was not significant on the chi-square test (χ2(1,n=49) = 0.150, p=0.349 one-tailed).
It is noteworthy that the predicted advantage of the frequency question over the probability question (according to scale compatibility) was found only when the sample sizes were compatible (60.9\% in F100 and 50\% in P100) but this difference was not significant (p=0.232 one tailed). However, when the sample sizes were incompatible the probability question yielded better performance (35\% in F25 versus 55.6\% in P25) and this difference was almost significant (χ2(1,n=47) = 1.95, p=0.082 one-tailed).
Overall, these results support previous findings reported in Girotto and Gonzalez (2001), showing that the effect of scale compatibility (in particular the advantage of frequency questions over probability questions when the data are presented in frequencies) can be overridden by sample-size compatibility. In fact, when performance in the compatible sample size conditions serves as a baseline, assignment to the incompatible sample-size problem impaired the performance of participants in the frequency question condition. However, it did not impair the performance of participants in the probability question condition. In this sense, the probability format may embody a strong adaptive advantage over the frequency format since the normalized values between 0 and 1 can be easily transformed from sample to sample without further calculations.
The current research suggests that normative reasoning in Bayesian-like-problems can be predicted by task complexity as measured by two factors: the number of mental steps required to reach the normative solution (more mental steps lead to more errors) and compatibility between data and questions and between the sizes of the reference and target samples (more compatible leads to fewer biases). Four studies supported our theoretical predictions and demonstrate the main effects of these two factors. Specifically, Study 1 confirmed the mental-step hypothesis, showing that the number of correct answers on a base rate task went down as the number of mental steps required to reach the normative solution increased. This study also lends support to the hypothesis regarding the advantage of full frequency formats for easy tasks (the one step condition). However, this finding might also be explained by the compatibility hypothesis by showing that when the data are presented in a natural frequency format, a frequency question yields more correct answers than a probability question.
Studies 2a and 2b further explored this scale compatibility hypothesis, and showed that the compatibility facilitating effect is not exclusive to the frequency format. When the data were presented in a probability format, a probability question facilitated more correct answers than a frequency question. This scale compatibility effect was found over and above numeracy ability and also reflected in faster reaction times for compatible conditions compared to incompatible ones.
Finally, Study 3 discovered another source of compatibility; namely, the match between the reference sample size from which the data are drawn and the target sample size to which the answer should be applied. Our results clearly demonstrate that, when these two sample sizes are not compatible, probability questions yield more correct answers than frequency questions even when the data are presented in a natural frequency format.
The identification of mental steps and compatibility as two factors affecting performance in base rate tasks suggests that an integrative model may provide a way to reconcile seemingly conflicting results in the literature and across our four studies (Girotto & Gonzalez, 2001). The natural frequency effect according to which frequency format leads to fewer cognitive biases (Brase, Cosmides, & Tooby, 1998; Cosmides & Tooby, 1996; Gigerenzer & Hoffrage, 1995, 2007; Hoffrage et al., 2002) was replicated in the one-step condition in Study 1. Although the emergence of this effect in this particular setting can be attributed to compatibility between the data and the question, it can be argued that people basically experience data by natural sampling in response to the frequentistic nature of objects, events and locations (Cosmides & Tooby, 1996; Gigerenzer & Hoffrage, 1995, 2007). Thus, in many social situations the frequency questions are more compatible with the data presented than the probability questions. In these situations computing the posterior odds in terms of natural frequencies rather than in terms of probabilities is more likely to result in well-calibrated estimates of these odds. However, our study also indicates that the advantage of the frequency format over probability is limited to the one-step condition, and is diminished in more complicated tasks (see also Evans et al., 2000; Girotto & Gonzalez, 2001, 2002; Lewis & Keren, 1999; Sloman et al., 2003).
Furthermore, Studies 2a, 2b and 3 capture situations in which the advantage of frequency questions over probability was even reversed such that probability questions yielded better performance. These situations were observed first in Studies 2a and 2b when the data were presented in a probability format and consequently the probability question became more compatible than the frequency question. Strikingly, the higher success of thinking in probability terms was pronounced in Study 3 when the data were presented in natural frequency format, but there was no compatibility between the reference and the target sample sizes. These results supports previous findings in Girotto and Gonzalez (2001) about incompatible situations, and demonstrate that thinking in probability terms has an inherent advantage over frequency terms, since only probabilities can be transferred from one sample size to another without additional calculations.
Finally, the current findings revealed a relatively high rate of correct performance in the compatible and one step conditions across studies 1, 2a and 3 (more than 50\% of the participants). This performance is impressive even if we take into account the statistical background of the participants, all of whom had taken at least one introductory course in statistics. Still, in all studies this performance declined dramatically whenever more mental steps were required to reach the normative solution or when there was incompatibility between the scales or the samples. It may not be farfetched to assume that these incompatible situations indeed characterize many situations in modern life in which information can be acquired through statistical data in different formats. The key question that arises here is what kind of cognitive tools people need to improve their Bayesian reasoning and be able to solve more complicated problems in their everyday environments.
The mixed findings on numeracy ability and compatibility revealed one possible response to this problem. In Study 2a, high numerate participants exhibited better reasoning in Bayesian-like problems, but also showed less sensitivity to the effect of scale compatibility. (For similar results on different cognitive tasks, see Lipkus & Peters, 2009, and Peters et al., 2007.) In Study 2b, there was indeed a main effect for numeracy, but even the accuracy level of high numerate participants was hampered by scale incompatibility (Garcia-Retamero& Hoffrage, in press).
These results imply that when the task is difficult to solve the situational factors such as the compatibility between the data and the question affect performance over and above individual differences. Nevertheless, when the task is more solvable it can be argued that more general and flexible numerical ability to translate one scale to another or to transfer information from one sample size to another sample size is more ecologically adaptive than developing expertise in one specific format. From an adaptive point of view, even if frequency were a more natural and primary mode of thinking that can simplify the understanding of a problem, as suggested by the natural frequency approach, the encoding of frequency inputs in absolute numbers seems cognitively inefficient and might lead to many biases that simply stem from focusing on concrete numbers (e.g., Anderson, 1983; Pacini & Epstein, 1999). Instead, ecological and adaptive Bayesian reasoning requires developing the numerical ability to translate these frequencies into probabilities (or relative frequencies) that can be easily transferred to different questions, samples and times.
Ayal, S., & Hochman, G. (2009). Ignorance or integration: The cognitive processes underlying choice behavior. Journal of Behavioral Decision Making, 22, 455–474.
Bar-Hillel, M. (1980). The base-rate fallacy in probability judgments. Acta Psychologica, 44, 211–233.
Barbey, A. K., & Sloman, S. A. (2007). Base-rate respect: From ecological rationality to dual processes. Behavioral and Brain Sciences, 30(3), 241–254.
Bettman J. R. , Johnson E. J., & Payne J. W. (1990). A componential analysis of cognitive effort in choice. Organizational Behavior and Human Decision Processes,45,111–139.
Beyth-Marom, R., & Arkes, H. R. (1983). Being accurate but not necessarily Bayesion: Comments on Christensen-Szalanski and Beach. Organizational Behavior and Human Performance, 31, 255-257.
Birnbaum, M. H., & Mellers, B. A. (1983). Bayesian inference: Combining base rates with opinions of sources who vary in credibility. Journal of Personality and Social Psychology, 45(4), 792.
Brase, G. L., Cosmides, L., & Tooby, J. (1998). Individuals, counting and statistical inference: The role of frequency and whole-object representations in judgment under uncertainty. Journal of Experimental Psychology, 127, 3–21.
Chapman, G. B., & Liu, J. (2009). Numeracy, frequency, and Bayesian reasoning. Judgment and Decision Making, 4(1), 34–40.
Cosmides, L., & Tooby, J. (1996). Are human good intuitive statisticians after all? Rethinking some conclusions from the literature on judgment under uncertainty. Cognition, 58, 1–73.
Eddy, D. M. (1982). Probabilistic reasoning in clinical medicine: Problems and opportunities. In D. Kahneman, P. Slovic, & A. Tversky, (Eds.), Judgment under uncertainty: heuristics and biases. New York: Cambridge University Press.
Evans, J. St. B. T., Handley, S. J., Perham, N., Over, D. E., & Thompson, V. A. (2000). Frequency versus probability formats in statistical word problems. Cognition, 77, 197–213.
Fiedler, K. (1988). The dependence of the conjunction fallacy on subtle linguistic factors. Psychological Research, 50, 123–129.
Fischer, G. W., & Hawkins, S. A. (1989). The prominence bias in multiattribute decision making: Scale compatibility, strategy compatibility, and the contingent strategies hypothesis. Unpublished manuscript, Carngie-Mellon University.
Fischhoff, B., & Beyth-Marom, R. (1983). Hypothesis evaluation from a Bayesian perspective. Psychological Review, 90, 239–260.
Garcia-Retamero, R., & Hoffrage, U. (in press) Visual Representation of Statistical Information Improves Diagnostic Inferences in Doctors. Social Science and Medicine.
Gavanski, I., & Hui, C. (1992). Natural sample spaces and uncertain belief. Journal of Personality and Social Psychology, 63(5), 766-780.
Gigerenzer, G., & Hoffrage, U. (1995). How to improve Bayesian reasoning without instruction: frequency formats. Psychological Review, 102, 684–704.
Gigerenzer, G., & Hoffrage, U. (2007). The role of representation in Bayesian reasoning: Correcting common misconceptions. Behavioral and Brain Sciences, 30)(03, 264–267.
Girotto, V., & Gonzalez, M. (2001). Solving probabilistic and statistical problems: A matter of information structure and question form.Cognition, 78, 247–276.
Girotto, V., & Gonzalez, M. (2002). Chances and frequencies in probabilistic reasoning: Rejoinder to Hoffrage, Gigerenzer, Krauss, and Martignon. Cognition, 84, 353–359.
Grice, H. P. (1975). Logic and conversation. In P. Cole & J. L. Morgan (Eds.), Syntax and semantics. Vol. 1: Speech acts (pp. 41-58). New York: Academic Press.
Hill, W. T., & Brase, G. L. (2012). When and for whom do frequencies facilitate performance? On the role of numerical literacy. The Quarterly Journal of Experimental Psychology, 65(12), 2343–2368.
Hoffrage, U., Gigerenzer, G., Krauss, S., & Martignon, L. (2002). Representation facilitates reasoning: What natural frequencies are and what they are not. Cognition, 84, 343–352.
Johnson, E. J., & Payne, J. W. (1985). Effort and accuracy in choice. Management Science, 31(4), 395–414.
Kahneman, D. Slovic, P., & Tversky, A. (1982).Judgment under uncertainty: Heuristics and biases. Cambridge: Cambridge University Press.
Kahneman, D., & Tversky, A. (1972). Subjective probability: A judgment of representativeness. Cognitive Psychology, 3, 430–454.
Kahneman, D., & Tversky, A. (1973). On the psychology of prediction. Psychological Review, 80, 237–251.
Kantowitz, B. H., Triggs, T. J., & Barnes, V. E. (1990). Stimulus-response compatibility and human factors. In R. W. Proctor & T. G. Reeve (Eds), Stimulus-response compatibility, , pp. 365–388. North-Holland.
Koehler, J. J. (1996). The base rate fallacy reconsidered: Descriptive, normative and methodological challenges. Behavioral and Brain Sciences, 19, 1–53.
Kornblum, S., Hasbroucq, T., & Osman, A. (1990). Dimensional overlap: Cognitive basis of stimulus-response compatibility — A model and taxonomy. Psychological Review, 97, 253–270.
Lewis, C., & Keren, G. (1999). On the difficulty underlying Bayesian reasoning: A comment on Gigerenzer and Hoffrage. Psychological Review, 106, 411–406.
Lichtenstein, S., & Slovic, P. (1971). Reversals of preference between bids and choices in gambling decisions. Journal of Experimental Psychology, 89(1), 46–55.
Lipkus, I. M., & Peters, E. (2009). Understanding the role of numeracy in health: Proposed theoretical framework and practical insights. Health Education and Behavior, 36, 1065–1081.
Lipkus, I. M., Samsa, G., & Rimer, B. K. (2001). General performance on a numeracy scale among highly educated samples. Medical Decision Making, 21, 37-44.
MacCallum, R. C., Zhang, S., Preacher, K. J., & Rucker, D. D. (2002). On the practice of dichotomization of quantitative variables. Psychological Methods, 7(1), 19–40.
Mellers, B. A., & McGraw, A. P. (1999). How to improve Baysian reasoning: Comment on Gigerenzer and Hoffrage (1995). Psychological Review, 106 (2), 417–424.
Moskowitz, H., & Sarin, R. K., (1983). Improving the consistency of conditional probability assessment for long range forecasting and decision making. Management Science, 29, 735–749.
Pacini, R., & Epstein, S. (1999). The interaction of three facets of concrete thinking in game of chance. Thinking and Reasoning, 5, 303–325.
Payne, J. W., Bettman, J. R., & Johnson, E. J. (1993). The adaptive decision maker. New York: Cambridge University Press.
Peters, E., Västfjäll, D., Slovic, P., Mertz, C. K., Mazzocco, K., & Dickert, S. (2006). Numeracy and decision making. Psychological Science, 17(5), 407–413.
Peters, E., Dieckmann, N., Dixon, A., Hibbard, J. H., & Mertz, C. K. (2007). Less is more in presenting quality information to consumers. Medical Care Research and Review, 64, 169-190.
Schwarz, N. (1999). Self-reports: How the questions shape the answers. American Psychologist, 54, 93–105.
Sloman, S. A., Over, D., Slovak, L., & Stibel, J. M. (2003). Frequency illusions and other fallacies. Organizational Behavior and Human Decision Processes, 91, 296–309.
Slovic, P., Griffin, D., & Tversky, A. (1990). Compatibility effects in judgment and choice. In R. M. Hogarth (Ed.), Insights in decision making: A tribute to Hillel J. Einhorn, pp. 5–27). Chicago: University of Chicago Press.
Trope, Y., & Bassok, M. (1982). Confirmatory and diagnostic strategies in social information gathering. Journal of Personality and Social Psychology, 43, 22–34.
The 8 items in the Numeracy Scale developed by Lipkus and Peters (2009) [Numbers in parentheses present the percentage of correct answers for each item].
The following questions aim to see how different people assess quantities.
Please answer the following 8 questions as quickly as you can and to the best of your ability. You do not need and may not use a calculator for any of these questions.
Answer: _____________ times [88.5\%]
Answer: _____________ people [90\%]
Answer: ________ \% [80.8\%]
Answer: _______ people [89.2\%]
Answer: a ___ \% chance of getting the disease. [92.3\%]
Tested positive | Tested negative | Totals | |
Actually has a tumor | 9 | 1 | 10 |
Does not have a tumor | 9 | 81 | 90 |
Totals | 18 | 82 | 100 |
Answer: _______out of ________ [57.7\%]
Answer: ______ cents [49.2\%]
Answer: _____ days [69.2\%]
Thank You!!!
Copyright: © 2014. The authors license this article under the terms of the Creative Commons Attribution 3.0 License.
This document was translated from LATEX by HEVEA.