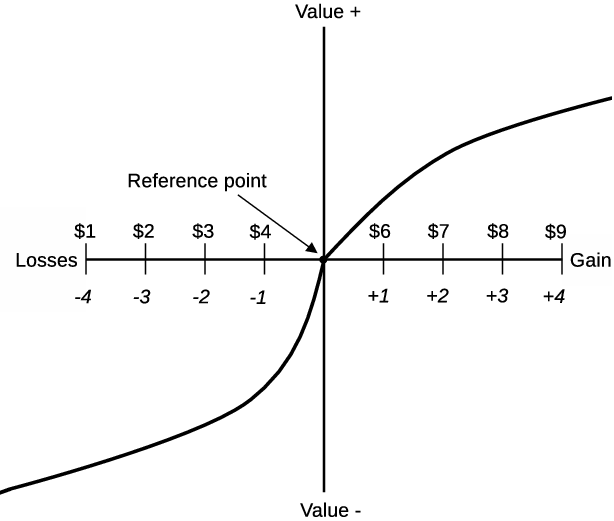
| Figure 1: Hypothetical value function. Adapted from Kahneman & Tversky (1979). |
Judgment and Decision Making, Vol. 15, No. 4, July 2020, pp. 517-533
Procedural and economic utilities in consequentialist choice: Trading freedom of choice to minimize financial lossesDaniel A. DeCaro* Marci S. DeCaro# Jared M. Hotaling$ Joseph G. JohnsonX |
Work on procedural utility suggests that decision makers derive more value from outcomes earned with freedom of choice. We experimentally tested tradeoffs between procedural and outcome utility, examining financial losses as an important boundary condition. Participants completed a simulated consumer sales task (Exp. 1) or card task (Exp. 2) with or without choice. Participants reported their satisfaction with monetary outcomes. When given choice, participants reported greater self-determination. Participants also reported higher outcome satisfaction, but only for gains. Choice did not influence satisfaction for losses. In Experiment 2, Participants also preferred choice when selecting between financial gains. However, when choice was costly (large disparity in pay) or posed losses, most participants sacrificed choice for better payoffs. Results are consistent with a cognitive model in which participants shift their attention from procedural utilities to financial outcomes when faced with losses. Financial outcomes may take precedence over choice when financial outcomes are threatened.
Keywords: procedural utility, negativity bias, loss aversion, self-determination, economic rational choice theory
Standard economic theory conceptualizes decision makers as consequentialists — evaluating their options based on the perceived merits of expected outcomes (Slovic et al., 1977). This assumption is central to rational choice theory (Edwards, 1954; von Neumann & Morgenstern, 1947) and underlies most decision theories in cognitive science (e.g., Birnbaum, 1999; Busemeyer & Townsend, 1993; Kahneman & Tversky, 1979), social psychology (e.g., Ajzen, 1991; see Abelson & Levi, 1985 for review), political science, and economics (Becker, 1982; Ostrom, 1998; Schoemaker, 1982). However, a growing body of research questions the assumption that preferences are based exclusively on anticipated outcomes. Research on procedural utility, the utility derived from procedures, examines how freedom of choice influences the perceived value of outcomes and subsequent decisions.
The few experiments studying procedural utility have demonstrated that decision makers care about procedural utilities above and beyond instrumental economic outcomes (e.g., Benz & Frey, 2008a; Leotti & Delgado, 2011; see Frey et al. 2004 for review). However, it is unclear how individuals weigh economic self-interest against sources of procedural utility, like freedom of choice (Arrow, 1951/2012; DeCaro, 2019; Sen, 1997).
This question is important because most decisions are made in social or institutional contexts that constrain individual choices. Furthermore, many decisions pit freedom of choice against financial outcomes, such as in government, employment, law, and economic development (Ostrom, 1980, 2010; Sen, 1999; Tyler, 1988; see Frey et al. 2004 for review). For example, when choosing forms of employment (e.g., traditional employment vs. self-employment) or government (e.g., autocratic government vs. self-government), decision makers must weigh individual freedom against expected economic payoffs (Benz & Frey, 2008b; Ostrom, 1980). Similar tradeoffs occur in interpersonal relationships, parenting, healthcare, and education (Deci & Ryan, 1987). Outcomes cannot be completely disentangled from the procedural context that produced them.
The current research contributes to our understanding of procedural utility by experimentally testing tradeoffs between financial outcomes and decision procedures. We test the hypothesis that decision makers emphasize procedural utility (i.e., freedom of choice) differently, depending on the perceived significance of the financial outcomes. When one’s financial goals have not been satisfied (i.e., losses), freedom of choice may figure less prominently in decision makers’ minds and, therefore, exert less influence over utility judgments and subsequent decisions. To explore this possibility, we use simple computational models with outcome-based (i.e., loss averse) attention weighting mechanisms.
The current research synthesizes prior conceptualizations of procedural utility and more closely integrates these theories with outcome-based decision science. This integration represents an important next step toward the goal of a comprehensive decision science of choice
Individuals can derive utility from any number of processes associated with decision making (Kahneman et al., 1997; Mellers, 2000). For instance, individuals prefer stores with more pleasant shopping experiences (e.g., quality customer service), holding the number of available items constant (Gärling et al., 1996). Excitement from the process of risk-taking during gambling or extreme sports may also provide utility beyond that derived from outcomes (Diecidue et al., 2004; Le Menestrel, 2001).
Social and institutional (e.g., governance) processes may be an important source of procedural utility (Frey et al., 2004; Ryan & Deci, 2017). Decision-making procedures within these settings constrain individual choice by determining how the decision is made (e.g., individual choice, market mechanisms, or vote), what role individuals play, and whose input will be prioritized (Ostrom, 2005). Research suggests that individuals derive utility from freedom of choice, because it satisfies fundamental social-psychological needs like self-determination (Frey et al., 2004; Ryan & Deci, 2017).
Fundamental social-psychological needs are vital to well-being and affect motivation, perception (Baumeister & Leary, 1995; Deci & Ryan, 2000), and decision-making (DeCaro, 2019; Moller, Deci & Ryan, 2006). Self-determination refers to being able to freely pursue goals that align with one’s core values (Ryan & Deci, 2006). Western cultures (e.g., United States) often associate self-determination with individual choice, being in control and making decisions for oneself (Leotti, Iyengar & Ochsner, 2010). Provision of choice is essential for optimal development, well-being, and functioning. Restriction of choice is associated with depression, anxiety, and decreased motivation, learning, and performance (Deci & Ryan, 2000; Shapiro, Schwartz & Astin, 1996). Provision of choice has therefore been identified as an important source of procedural utility (Frey et al., 2004).
Most research on self-determination, and precursors to procedural utility, has been conducted in fields outside decision science (e.g., Deci & Ryan, 2000; Tyler, 1988). However, Benz and Frey (2008a, 2008b) demonstrated that the self-employed were more satisfied with their jobs than conventional employees, even controlling for earnings and workload. The authors attributed this finding to greater decision-making freedom. Güth and Weck-Hannemann (1997) found that most voters treat their voter rights (i.e., choice) as invaluable, even though one person’s vote has a negligible effect on election outcomes. Similar results have been observed in markets, law, education, parenting, and religion (Frey et al. 2004; Ryan & Deci, 2017).
The previous research suggests that decision makers value choice. A few experimental studies indicate that procedural utility also effects financial decisions. Leotti and Delgado (2011) demonstrated these effects in two tasks, using fMRI and self-reports to assess both the “inherent value of choice” and its impact on preference. During Task 1 (value task), participants decided between two boxes, which yielded $0, $50, or $100 with equal probabilities (unknown to participants). Half of the trials were Choice Trials where participants chose freely. The other trials were No Choice Trials, where the computer indicated a box they were required to select. Each trial began with a cue, allowing participants to anticipate the trial type. After completing all these decisions, participants indicated how much they liked/disliked the cues. Payoffs were equated across trials, but participants reported liking the choice cue more than the no-choice cue. The choice cue was also associated with heightened activation of neural substrates linked to reward (e.g., ventral striatum). Leotti and Delgado concluded that individuals derived value from choice beyond that derived from outcomes.
During Task 2 (preference task), Leotti and Delgado’s (2011) participants made a series of choices between a white and black box. The white box led directly to payoffs. The black box led to a second choice between two additional boxes, which yielded payoffs. Even with the payoffs equated across paths, 64% of participants preferred the black box, which offered additional choice opportunities.
Early research on self-determination posited that individuals perceive outcomes as more positive when they decide for themselves (de Charms, 1968; Deci & Ryan, 1985). Szrek and Baron (2007) tested this hypothesis and its effect on preferences by asking how much individuals would pay for identical sets of insurance policies presented with or without choice. Participants were willing to pay more when the policies were presented as a choice among available options, rather than an assignment—indicating greater procedural utility. They also preferred the policies more.
Few procedural utility experiments have tested potential tradeoffs, or interactions, between choice and economic outcomes. This paper examines how financial losses impact these tradeoffs.
We propose that decision makers focus on financial well-being (i.e., outcomes) and deemphasize freedom of choice (procedural utility) when their financial status quo is threatened. Prospect Theory’s loss aversion (Kahneman & Tversky, 1979) is a dominant perspective in decision science. Therefore, we address it and other potential explanations.
Decision makers have limited attentional resources (Simon, 1955), so salient aspects of the decision environment affect the valuation and selection of outcomes (Busemeyer & Townsend, 1993; Tversky & Kahneman, 1981). Frey et al. (2004) posit that freedom of choice (procedural utility) and financial outcomes (outcome utility) represent two sources of information during decision making. We propose that the relative influence of these information sources depends on their saliency. One potentially important factor may be outcome valence (loss, gain).
Losses are often perceived negatively and have heightened saliency compared to gains (Kahneman & Tversky, 1979; cf. Dacey, 2003; Novemsky & Kahneman, 2005; Rick, 2011). Individuals exhibit stronger negative affect (Heath, Larrik & Wu, 1999; Mellers, 2000) and galvanic skin response to losses (Sokol-Hessner et al., 2009). Losses capture attention (Yechiam & Hochman, 2013), and individuals are sometimes motivated to avoid or escape losses. Individuals exhibit heightened concern for security and their basic instrumental needs (e.g., financial security) when they experience significant losses (Heath et al., 1999; Koop & Johnson, 2012; Lopes, 1987). Individuals are also more willing to take risks to mitigate losses (Kahneman & Tversky, 1979; Novemsky & Kahneman, 2005). This constellation of adverse responses to losses has been deemed negativity bias (Baumeister, Bratsklavksy, Finkenauer & Vohs, 2001).
Prospect Theory (Kahneman & Tversky, 1979) conceptualizes dislike for losses as loss aversion. According to Prospect Theory, outcomes that fall below the status quo (reference point) are perceived as losses and have greater impact than equivalently sized gains. This effect is represented by an asymmetric, S-shaped value function (Figure 1). Reference points can be goals or normative standards, such as typical performance or the status quo (Camerer, 2005; Dacey, 2003; Heath et al., 1999; Koop & Johnson, 2012). Reference points are motivating: people often strive to maintain at least their current standing, rather than fall below it (i.e., status quo bias, Samuelson & Zeckhauser, 1988; Tversky & Kahneman, 1981, 1991).
In prospect theory, the status quo is the reference point. Therefore, if $5 is the reference point, outcomes below $5 will be perceived as losses (Figure 1). The slope of the utility function shows that loss aversion is stronger for near misses than far misses (Dacey, 2003; Mellers, 2000; but see Hsee, Rottenstreich & Xiao, 2005).
Figure 1: Hypothetical value function. Adapted from Kahneman & Tversky (1979).
Kahneman and Tverksy’s (1979) conceptualization of loss aversion is debated (Novemsky & Kahneman, 2005; Rick, 2011). Losses sometimes capture attention and influence behavior without negative emotional arousal (Yechiam & Hochman, 2013), the pleasure of gains can exceed the pain of losses (Mellers, 2000), and the asymmetric S-shaped utility function, which is believed to motivate status quo bias and risk-seeking behavior (to avoid or escape losses) may not be replicated (Mukherjee et al., 2017).
Despite violations of Prospect Theory, individuals tend to exhibit a general negativity bias, disliking losses and striving to avoid them (Baumeister et al., 2011; Yechiam & Hochman, 2013). Mellers, Yin and Bermam (in preparation) demonstrate that gain seeking can occur if the reference point is low, or negative (shifting the reference point in Figure 1 down). The heightened perceived pleasure of gains, relative to the low reference point (e.g., losses), may motivate individuals to take risks to escape the referent point and improve their outcomes.
Few studies have considered how these effects may influence procedural utility. Tyler (2006) asked retirees to choose between two hypothetical investment plans. In Plan A, retirees could discuss their feelings, retirement needs, and concerns with an advisor (higher procedural utility), but promised an “average” financial return. Plan B lacked these procedural opportunities but promised “above average” returns. Most retirees (62%) preferred Plan A, sacrificing some financial benefits for more influence over the decision. This finding confirms the value of choice and demonstrates a tradeoff between procedural and outcome utility, but does not strongly test the effect of losses on procedural utility.
In Tyler’s (2006) study, participants chose between “average” financial benefits and “above average” benefits. “Average” outcomes represent a status quo reference point (Heath et al., 1999), parsing the financial outcomes into gains (“above average”) and foregone gains (“average”). Foregone gains do not elicit loss aversion. Individuals are generally willing to sacrifice marginal benefits (foregone gains) on one dimension for value on another (Kahneman 1992). Moreover, the study used hypothetical monetary outcomes and choice procedures that may not elicit genuine utilities or tradeoffs (Hertwig & Ortmann, 2001).
In another study, Leotti and Delgado (2014) examined participants’ subjective liking and neuropsychological reaction to conditions where choice or no-choice was followed by either a positive ($0, $10, or $50) or negative (−$0, −$10, −$50) outcome. Participants preferred choice more than no-choice. However, there was an interaction between choice and outcome valence that almost reached significance, in which individuals liked choice less when outcomes were losses. Thus, there is preliminary experimental evidence that decisions makers may deemphasize freedom of choice when they encounter financial losses.
We examined tradeoffs between procedural and outcome utility in two experiments. In Experiment 1, participants reported their satisfaction with real financial losses and gains earned with/without choice. In Experiment 2, participants also indicated their preference for choice, when choice was costly and posed financial losses. Because losses typically capture attention and may elicit a stronger negative emotional response, we expected decision makers to deemphasize procedural utility (i.e., choice) when financial losses were at stake.
If this hypothesis is correct, the effect of choice should differ for gains and losses. When outcomes are gains, individuals should attend to monetary outcomes (outcome utility) and freedom of choice (procedural utility). Outcome satisfaction should therefore be greater for financial outcomes earned by choice, as previously demonstrated (e.g., Leotti & Delgado, 2011; Tyler, 2006). When losses are at stake, individuals should deemphasize choice. Satisfaction for losses should be based primarily on the outcomes themselves, yielding similar satisfaction ratings regardless of choice. In Experiment 2, preference for choice should be strongest among financial gains, because both procedural and outcome utility are attended to and incorporated into the decision. Preference for choice should be weakest for losses, because financial security—and outcome utility—receives more attention.
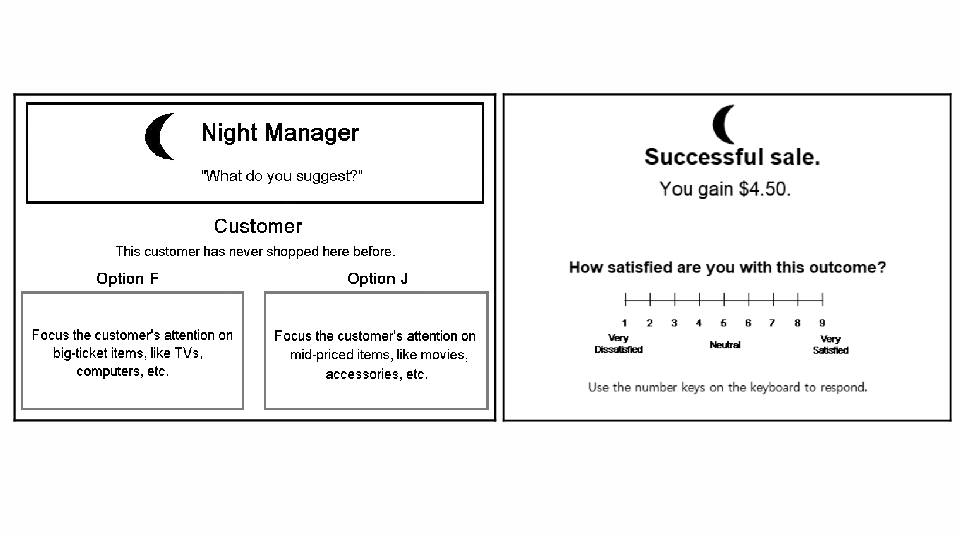
Figure 2: Screenshots of a decision trial from the e-trainer sales task (Experiment 1). Participants used the electronic manager’s sales support (a manipulation of choice) and information about the customer to decide which of two actions to take to complete the sale (left screen). The choice condition (manager) is shown in Figure 2. Afterward, participants saw the sale outcome and payoff and reported their satisfaction (right screen).
In Experiment 1, participants performed a simulated consumer sales task under choice and no-choice conditions and were asked to rate their satisfaction with real monetary losses and gains. We used outcome satisfaction to approximate utility (Frey & Stutzer, 2005; Kahneman et al., 1997; Mellers, 2000). We used a consumer sales cover story to draw attention away from the purpose of the satisfaction ratings and ensure participants gave honest responses (Harmon-Jones, Amodio & Zinner, 2007). The cover story, with simulated managers, was more representative of social and institutional decision contexts involving power disparities. Frey et al. (2004) and others (e.g., DeCaro, 2019; Ryan & Deci, 2017) argue that procedural utilities are especially crucial in those settings.
Undergraduate students (N=79; age M=18.78 years, SD=0.79; 54% female) volunteered in exchange for partial course credit. Participants received $5 monetary payment for their performance on the decision task, as explained below.
We manipulated choice and outcomes in a 2 (choice procedure: choice, no-choice) × 2 (outcome valence: losses, gains) within-subjects design. Experiment stimuli and computer instructions are included in Appendix A.
Participants were asked to “test a computerized salesperson training program,” by adopting the role of a new salesperson to provide feedback about the training program (e-Trainer). To ensure that participants’ outcomes were consequential, we instructed them that their payments would be based on their performance, as explained below.
E-Trainer simulates different types of customers (e.g., “Seems to be in a hurry”), sales approaches, and training from managers (see Figure 2). Each decision trial gave a binary choice for making a sale (e.g., “Focus on selling the store’s easiest to sell items” versus its “hardest”). After each decision, participants saw the outcome of the sale (e.g., Successful Sale) and its monetary payoff. They also reported their outcome satisfaction (“How satisfied are you with this outcome?”) on a 9-point scale, ranging from 1 (very dissatisfied) to 9 (very satisfied).
We manipulated choice by including either a choice or no-choice electronic manager on each decision trial. Each manager had 11 statements. We adapted statements used in prior choice experiments from Self-Determination Theory (e.g., Sheldon & Filak, 2008). The statements were randomly selected on each trial.
The choice manager (Figure 2) supported participants’ self-determination (Deci & Ryan, 1987; Deci et al., 1994), acknowledging the participant’s perspective and encouraging the participant to make a decision (e.g., “You’re free to handle this however you like”). Participants then chose for themselves. The no-choice manager controlled the decision (evenly divided over options) (e.g., “You should listen to me, your boss, when making sales decisions. Choose option J”). The participant had to repeat the trial until they complied, and were warned, “Always do as I say.” Trial order (choice, no-choice) was randomized.
A subset of participants (N=64) also experienced a random computer-guided condition, where the computer training program (identified by a computer icon) randomly determined the choice so that participants could “watch and learn.” We included this condition to compare to the no-choice condition in which a manager deliberately undermined freedom of choice.
Sale outcomes. We did not tell participants a specific performance goal (i.e., reference point). Instead, to ensure participants interpreted the payoffs along a common psychometric scale, we told them, “$10 is the most you can gain or lose from any single sale,” and “$0 is the least.” Each payoff was labeled: “Unsuccessful; You lose $____” (for losses), “Successful; You gain $____” (gains), or “Incomplete sale; Result $0” (see Figure 2).
Unknown to participants, there was no connection between the customer (6 total), the sale action selected (18 total binary choice items), and the sale outcome and payoff of the sale. Each sale outcome and payoff was randomly selected so that participants received identical outcomes across choice procedures. We used this methodology to demonstrate that individuals experience procedural utility from choice even when there are no financial benefits (see also, Leotti & Delgado, 2011). We informed participants that “just as in real life, customers sometimes respond to identical situations differently.”
Payoffs were identical for each choice procedure (choice, no-choice) and presented in random order. We used two types of payoff trials: diagnostic and noise. There were 22 trials per condition (44 total): 16 (73%) were diagnostic; 6 (27%) were noise. During the 16 diagnostic trials, participants received payoffs representing slight (M=$0.38), moderate (M=$4.75), and large (M=$9.75) financial losses and gains (2 outcomes each, total 12 trials). These trials tested the hypothesis that outcome satisfaction is effected by losses and gains, and were used in our analyses. Participants also received four $0 payoff trials; we intended this payoff to serve as a no-change, “status quo” outcome.1 To simulate variability (i.e., noise), we included 6 additional outcomes (ranging from $1 to $10). These outcomes were not analyzed.
We assessed perceptions of the managers (choice procedures) after the decision task. Items referred to the managers (e.g., “When I worked with this manager…”). Managers were identified by name and symbol. Managers and items were presented in random order. Responses were made on a 9-point scale, ranging from 1 (strongly disagree) to 9 (strongly agree). We used four items to assess self-determination (α =.90). Two items measured freedom (e.g., “I had personal freedom”; e.g., Ryan & Connell, 1989). Two items measured agency (e.g., “My sales were determined by my own actions”; Levenson, 1981).
Participants first completed informed consent and a compensation receipt, leaving the payment amount blank, “to be determined by your sales performance.” They then worked at an individual computer cubicle where they completed the task instructions and the outcome satisfaction task. Afterward, they completed a demographics questionnaire, were fully debriefed, and paid $5. Payment was $5 because the randomly determined and equated payoffs used for all conditions were designed to yield an average payoff of $5.
Participants perceived the choice manager as providing more self-determination (M=6.97, SD=2.22) than the no-choice manager (M=2.88, SD=1.80), F(1,78)=129.47, p<.001, ηp2=.62.
To determine how participants perceived losses, we quantified the extent to which outcome satisfaction ratings for losses deviated from the neutral point of the satisfaction scale (i.e., “5”), in absolute value. We averaged the absolute deviation of the outcome satisfaction scores for losses from neutral. Then we compared this value to the same value for gains. The mean absolute deviation for losses (M=2.73, SD=0.98) was significantly greater than that for gains (M=1.99, SD=1.03), F(1,78)=25.44, p<.001, ηp2=.25. On average, participants’ subjective reaction to losses was not only more negative than gains, but also more intense. This finding is consistent with a general negativity bias.
Figure 3 shows participants’ outcome satisfaction for each payoff. The pattern does not perfectly replicate Prospect Theory’s proposed value function for loss aversion. The $0 no-change payoff is not centered at the neutral point, and the slope for gains appears steeper (increases more rapidly) than the slope for losses. This pattern may be consistent with gain-seeking (Mellers et al., in preparation).
However, it may also be possible that the $0 no-change payoff is not a true reference point. We did not state a specific performance standard or goal (i.e., explicit reference point) for this task. In addition, the $0 no-change payoff was presented as an “Incomplete Sale.” It is difficult to argue that this would be a goal or typical standard of performance in consumer sales. Earning $0 on an incomplete sale does not directly subtract from participants’ earnings. However, an incomplete sale does represent a lost financial opportunity (i.e., loss), which decreases long-term earnings. Thus, we suspect that we failed to create and measure a true status quo reference point (see Heath et al., 1999; Kahneman, 1992).
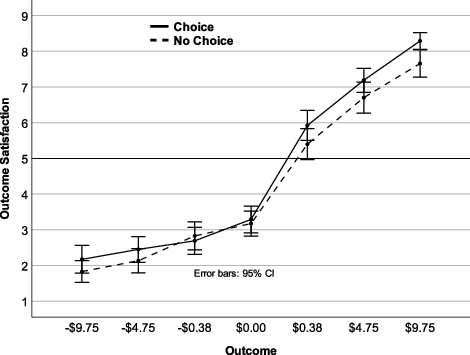
Figure 3: Mean outcome satisfaction in Experiment 1 as a function of choice procedure and payoff. Error bars: 95% CIs. * p<.05 based on 95% CIs.
Our hypotheses were intended for the choice manager and no-choice manager decision procedure conditions, but we included a random “computer” no-choice decision procedure condition as a comparison for some of the participants. Outcome satisfaction ratings for the random computer condition were not significantly different from the no-choice manager or the choice manager, with one exception (Appendix C, Table C1). Hence, a random computer assistant may not be as aversive or coercive as a social agent who deliberately undermines one’s choice. This effect is consistent with the proposition that it is the contrast of an autonomy-supportive social agent with a coercive social agent that drives procedural utility effects in social settings (see Frey et al., 2004; Ryan & Deci, 2017).
Visual comparison of outcome satisfaction for choice versus no-choice (Figure 3) suggests that choice was associated with higher outcome satisfaction for gains, but not losses (see also Appendix C, Table C1). We tested this relationship using a 2 (choice procedure: choice, no-choice) × 2 (outcome valence: losses, gains) repeated-measures ANOVA. There were main effects of choice procedure, F(1,78)=20.64, p<.001, ηp2=.21, and outcome valence, F(1, 78)=581.32, p<.001, ηp2=.88. Overall, participants reported higher satisfaction for gains (M=6.86, SE=.14) than losses (M=2.35, SE=.13) and for choice (M=4.79, SE=.10) versus no-choice (M=4.42, SE=.11) trials. There was also a significant interaction, F(1,78)=6.69, p=.012, ηp2=.08.
As shown in Figure 4, when the outcomes were gains, choice (M=7.14, SE=.13, 95% CI[6.88−7.39]) led to higher satisfaction ratings than no-choice (M=6.59, SE=.17, 95% CI[6.25−6.92]), F(1,78)=24.85, p<.001, ηp2=.24. When the outcomes were losses, choice (M=2.43, SE=.15, 95% CI[2.14−2.74]) and no-choice (M=2.26, SE=.13, 95% CI[1.99−2.53]) did not differ significantly, F(1,78)=2.71, p=.104, ηp2=.03.
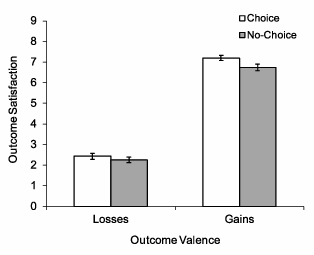
Figure 4: Outcome satisfaction in Experiment 1 as a function of choice procedure and outcome valence. Error bars represent +1 SE.
Experiment 1 demonstrated that the element of choice during decision-making increased perceived self-determination, an important source of procedural utility. However, freedom of choice only increased satisfaction when the outcomes were gains, not losses. The financial earnings in the choice and no-choice conditions were equated, so these findings can only be attributed to the valence of the outcomes.
This study provides experimental evidence that choice procedures influence perceptions of outcomes, as proposed by procedural utility theorists. The findings are also consistent with our hypothesis that the extent to which procedural utilities influence decision making depends on the type of outcome. When financial outcomes were more salient (i.e., losses), participants appeared to base their satisfaction ratings on the outcomes themselves, largely ignoring choice.
Experiment 2 improved upon Experiment 1 in five ways. First, we sought to replicate the findings of Experiment 1 in a new domain. We used a card game that equated the outcomes obtained in the choice and no-choice conditions on diagnostic trials (for comparison), while allowing performance-contingent payoffs based on participants’ actual decisions. The outcome satisfaction task used an 11-point satisfaction scale, and the outcome distribution ranged from $1 to $9 in one-dollar increments for generalizability. Payoffs spanned losses ($1, $2, $3, $4) and gains ($6, $7, $8, $9).
Second, we introduced an explicitly stated $5 “status quo” reference point presented as the “typical” earnings among peers in the task. This method is similar to goal inductions used in prior studies that have exhibited stronger loss aversion effects (e.g., Heath et al., 1999; Kahneman, 1992; Kahneman et al., 1997).
Third, we included additional measures to examine more sources of procedural utility. Choice may also satisfy social-psychological needs for procedural fairness, competence, and belonging (DeCaro, 2018; Frey et al., 2004). Western cultures typically perceive leaders and decision procedures that support choice as fairer (Sheldon et al., 2004; van Prooijen, 2009). When a leader supports a decision maker’s freedom of choice, this action is typically seen as a sign of respect (De Cremer & Tyler, 2005), enhances feelings of self-competence (Takenishi & Takenishi, 2006), and may enhance social belonging (De Cremer & Blader, 2006). We predicted these needs would be satisfied better by the choice manager.
Fourth, we examined how losses influence preference for choice. We added a choice tradeoff task analogous to that of Tyler (2006), but with losses and gains. Participants chose between competing “job offers” from different managers that pitted their freedom of choice against anticipated monetary outcomes. The job offers that granted choice always paid less than the no-choice offers. These offers spanned losses (both values below the $5 reference point; e.g., Choice at $2 vs. No-Choice at $3) and gains (both values above $5; e.g., Choice $6 vs. No-Choice $7), and differed by up to $8 (i.e., Choice $1 vs. No-Choice $9).
We hypothesized that participants would more often choose job offers that granted them freedom of choice when gains were at stake (e.g., Choice $6 vs. No-Choice $7) than when losses were at stake (e.g., Choice $2 vs. No-Choice $3). As with tradeoffs between valued commodities more generally (Edwards, 1954), we also expected there to be a limit to the payoffs individuals would sacrifice for freedom of choice. There should be a transition point where maintaining freedom of choice becomes too costly, and preference for choice changes to preference for no-choice. Finally, if individuals experienced status quo bias, wishing to maintain at least typical performance (Samuelson & Zeckhauser, 1988), then preference for choice would be particularly weak for the job offer that pits the $5 status quo against the first loss on the payment scale (i.e., Choice $4 vs. No-Choice $5).
Finally, to better understand the psychological processes involved, we tested the descriptive power of some simple cognitive models. These models compared traditional outcome-based utility models to novel procedural utility models, which use attentional weighting mechanisms to emulate changes in the saliency of choice (versus financial outcomes).
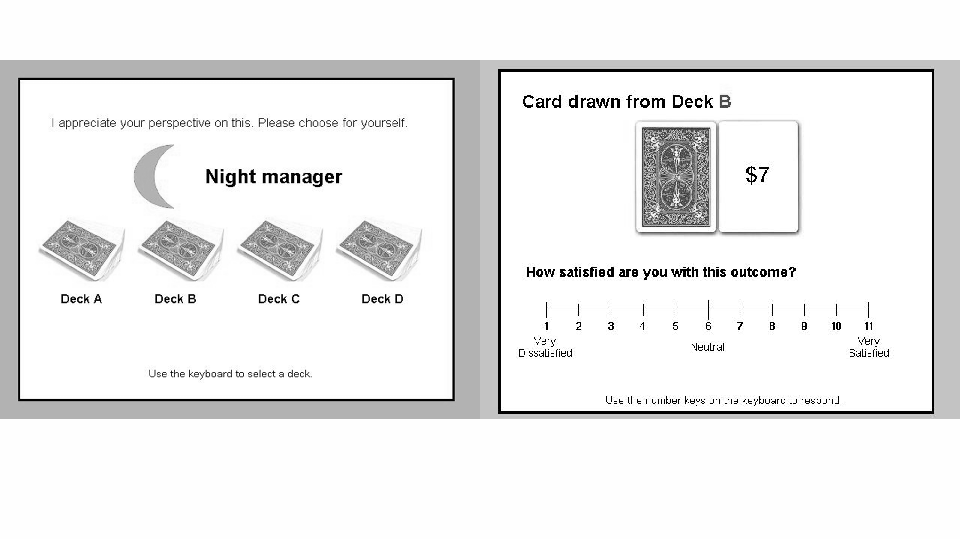
Figure 5: A decision trial in the card task. A choice trial is depicted (left panel). Participants reported their outcome satisfaction immediately afterward (right panel).
Undergraduates (N=108; age: M=19.09 years, SD=1.12; 48% female)2 from introductory psychology classes participated in exchange for partial course credit. Participants were paid based on their average earnings in the decision task. Data from four students were not included because they indicated during debriefing that they did not believe they would be paid.
As in Experiment 1, we manipulated choice procedure and outcomes in a 2 (choice procedure: choice, no-choice) × 2 (outcome valence: losses, gains) within-subjects design. Experiment stimuli and computer instructions are included in Appendix B.
We asked participants to evaluate a “training and assessment program” portrayed as an admissions tool for incoming business school students. The decision task was based on the Iowa Gambling task (Bechara et al., 1994). Four decks of cards were presented on the screen (Figure 5). During each trial, participants selected a deck. Each card had a payoff from $1 to $9. Each deck had an undisclosed average payout: Decks A and C $1.60, Deck B $5 (status quo), and Deck D $8.47. We informed participants that their final payment would be determined by the average card value they obtain during the card task, and that they should try to discover which deck(s) generated the highest outcomes. To establish a status quo economic goal (i.e., reference point), we informed participants that “the majority of people scored an average of $5” on previous (pilot) tests and that scores above or below that value are considered indicators of better or worse performance. We quizzed participants’ understanding of these performance standards (and corrected any mistakes). Half of the participants (between-subjects) were additionally assigned to a failure-framing condition, which defined $1 as “failure” and $9 as “success,” as a test of multiple reference point effects beyond the status quo (Koop & Johnson, 2012). This manipulation had no effects, so data were collapsed. Finally, the task was designed to be challenging but learnable, so that participants would not feel helpless, yet still find the task engaging (Deci & Ryan, 1985). Most participants learned the best deck after about a third to half of the total trials.
As in Experiment 1, each trial was accompanied by “training support” from hypothetical managers, identified as “Day” or “Night” managers (Figure 5). These managers differed in their procedural utility (counterbalanced across participants).
The choice manager let participants decide which deck to select. Participants selected the deck (labeled A, B, C, or D) using the computer keyboard. Manager instructions were presented at the top of the screen and were randomly selected from 11 statements that emphasized choice (e.g., “What do you suggest?”) and the participant’s opinion (e.g., “I appreciate your perspective on this.”). The no-choice manager instructed participants to choose a particular deck (e.g., “When I’m in charge, decisions must be made through me. Choose Deck D”), evenly distributed among decks. If participants did not comply, they were instructed, “Always do as I say,” and repeated the trial. Trial order was randomized.
Immediately after selecting a deck, participants saw the value of the card they drew (e.g., $9), and reported their outcome satisfaction on an 11-point scale, ranging from 1 (very dissatisfied) to 11 (very satisfied), with a neutral point at 6 (keys “1” to “-“ at the top of the keyboard were relabeled). There were 232 trials. During choice trials, participants could concentrate on a deck and sample a range of outcomes. Therefore, we ensured that participants received a minimum set of common outcomes across choice and no-choice trials for comparability: 72 trials (31%) were designed so that each value $1-$9 would be presented four times in each condition, regardless of the deck chosen. Outcomes from the other trials depended on the average payout for each deck. Outcome presentation was randomized.
After the card task, participants evaluated each manager on four dimensions. Procedural fairness was assessed with four items (α =.84): two evaluated general fairness (e.g., “I felt treated fairly”); two pertained to the procedures (e.g., “I felt the manager used a fair process to manage the decision situation”; Colquitt, 2001; van Prooijen, 2009). Self-determination was assessed using the same items (α =.78) as in Experiment 1: two items measured general freedom (e.g., “I had personal freedom”); two items assessed agency (e.g., “My deck selections were determined by my own actions”; Levenson, 1981; Ryan & Deci, 2006). Belonging was measured using two items (α =.88; e.g., “I felt that the manager accepted me”; Baumeister & Leary, 1995; Ryan, 1982). Competence was assessed with two items (α =.83; e.g., “The manager made me feel skilled and able”; Ryan, 1982). For all manipulation check items, the stem was, “When I worked with this manager…,” and responses were recorded on an 11-point scale ranging from 1 (strongly disagree) to 11 (strongly agree). Managers were presented one at a time, identified by name and symbol. Order of managers and items was randomized across participants.
After rating each manager, participants imagined they would repeat the earlier card-based decision task but could choose the manager and final payment. Specifically, participants learned that each manager would make “job offers” and that they should indicate which offer they preferred (Figure 6). In this task, freedom of choice always paid less than the no-choice option. Payoffs $1–$9 spanned losses (e.g., Choice at $2 vs. No-Choice at $3), gains (e.g., Choice $6 vs. No-Choice $7), and the decision between the $5 status quo and the first loss on the scale (i.e., Choice $4 vs. No-Choice $5). There were 36 items: from Choice $1 vs. No-Choice $2 to Choice $1 vs. No-Choice $9, to Choice $8 vs. No-Choice $9. The job offers were randomized and manager location on the screen (A vs. B; Figure 6) was counterbalanced.
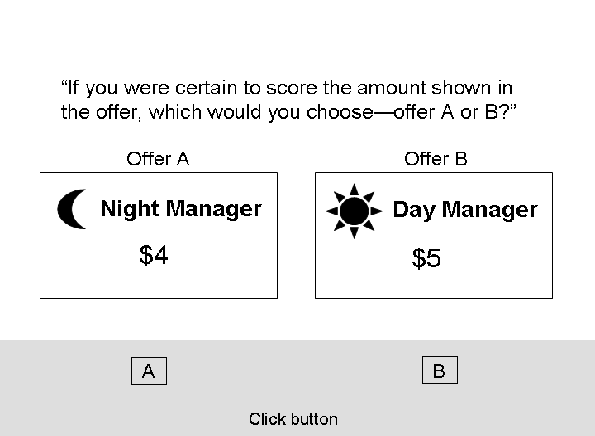
Figure 6: A trial in the preference task. Offer A, from the night manager, is the choice-granting option here (order counterbalanced across participants).
Procedures were the same as in Experiment 1, except the manipulation check items were followed by a preference task.
Participants perceived the choice manager as satisfying their needs for self-determination, procedural fairness, belonging, and competence more than the no-choice manager: self-determination (M=9.98, SE=0.15 vs. M=1.94, SE=0.13), t(107)=34.44, p<.001, d=3.31; procedural fairness (M=9.22, SE=0.15 vs. M=2.80, SE=0.15), t(107)=25.81, p<.001, d=2.48; belonging (M=9.78, SE=0.15 vs. M=2.61, SE=0.17), t(107)=27.37, p<.001, d=2.63; competence (M=9.67, SE=0.16 vs. M=2.24, SE=0.14), t(107)=29.52, p<.001, d=2.84.
We used the same method as in Experiment 1 to identify how participants perceived losses, compared to the neutral point (“6”) on the satisfaction scale. Participants reacted more strongly (and negatively) to losses (M=3.59, SD=0.71) than gains (M=2.55, SD=0.63, F(1,107)=108.43, p<.001, ηp2=.50). This pattern suggests a general negativity bias.
Outcome satisfaction ratings are shown in Figure 7. With the well-defined, status quo reference point used in this experiment, the outcome satisfaction ratings more closely resembled Prospect Theory’s asymmetric, S-shaped value function for loss aversion. However, this resemblance was imperfect. The $5 status quo was not precisely centered at the neutral point (“6”): participants judged the status quo slightly negatively, especially in the no-choice condition. With the exception of the first loss on the scale (i.e., $4), the slope for gains was steeper than the slope for losses. These patterns may therefore be consistent with gain-seeking (Mellers et al., in preparation). However, with the exception of the most extreme outcomes (i.e., $1, $9), losses were still felt more intensely in absolute terms, when using participants’ felt reference point value (i.e., 5.59) instead of the satisfaction scale’s neutral point (“6.00”).
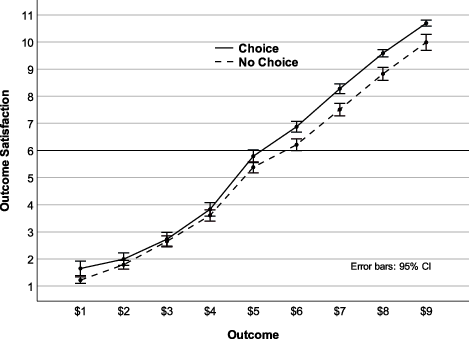
Figure 7: Mean Outcome Satisfaction in Experiment 2 as a Function of Choice Procedure and Payoff. Error bars: 95% CIs. *p<.05 based on 95% CIs.
As in Experiment 1, we used a 2 (choice procedure: choice, no choice) × 2 (outcome valence: losses, gains) repeated-measures ANOVA to test the hypothesis that the beneficial effect of choice on outcome satisfaction decreases for losses (i.e., $1 to $4). There was a main effect of outcome valence. As expected, participants viewed losses more negatively (i.e., less satisfaction; M=2.43, SE=.08) than gains (M=8.50, SE=.06), F(1, 107)=3989.20, p<.001, η 2=0.97. There was a main effect of choice procedure: overall, participants were more satisfied by payoffs earned during choice trials (M=5.70, SE=.07) than no-choice trials (M=5.23, SE=0.07), F(1, 107)=20.57, p<.001, η 2=0.16.
These effects were qualified by a choice procedure × outcome valence interaction (F(1, 107)=38.47, p<.001, η 2=0.26; Figure 8). As expected, the effect of choice on outcome satisfaction was reduced for losses (choice M=2.55, SE=.11; no-choice M=2.32, SE=.07, F(1, 107)=4.87, p=.029, η 2=0.04), compared to gains (choice M=8.86, SE=.06; no-choice M=8.14, SE=.11, F(1, 107)=37.07, p<.001, η 2=0.26) (see Appendix C, Table C2).
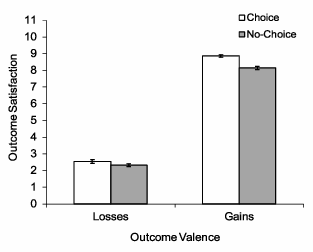
Figure 8: Outcome Satisfaction in Experiment 2 as a Function of Choice Procedure and Outcome Valence. Error bars represent + 1 SE.
Figure 9 shows the proportion of participants that chose the choice manager (y-axis) for each set of payoffs (x-axis) in the preference task. Lines represent differences in pay ($1 to $8): the first point on the topmost line ($1 disparity) is the job offer Choice $1 vs. No Choice $2; the last point is Choice $8 vs. No Choice $9. The no choice manager always paid more. Thus, if participants only considered financial outcomes, they would never choose the choice manager. However, if preferences depend on both freedom of choice (procedural utility) and financial outcomes, individuals will make tradeoffs. We examined whether pay disparities and financial losses (i.e., outcomes below the $5 status quo) decreased preference for the choice manager.
When the difference in pay between the managers was just $1 (i.e., 11% of the pay scale), most participants (64%) chose the choice manager (see also Appendix C, Table C3). However, when the pay disparity reached $2 (22% of the pay scale), preference for choice dropped to 36%, and then steadily declined to a low of 7% (for an $8 pay disparity). Individuals valued freedom of choice but abandoned choice when it became too costly.
Participants were indifferent between choice and no choice for Choice $4 vs. No-Choice $5, which pits the status quo against the first possible loss. This finding is consistent with status quo bias, though the effect is weak (i.e., participants did not switch preference to the no-choice manager). A similar pattern emerged for Choice $1 vs. No-Choice $2.
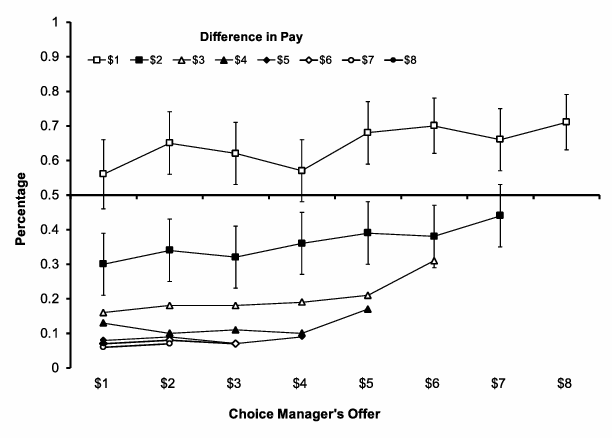
Figure 9: Preference for the Choice Manager’s Job Offer. Error bars: 95% CIs (not shown for pay differences greater than $2 for visual clarity).
In gain job offers both managers offer gain outcomes (e.g., Choice $6 vs. No-Choice $7). In loss job offers both managers offer losses (e.g., Choice $2 vs. No-Choice $3). We hypothesized that preference for choice would be stronger among gains offers. We tested this hypothesis with a 2 (outcome valence: losses, gains) × 4 (difference in pay: $1, $2, $3, $4) repeated-measures ANOVA.
There were significant main effects of outcome valence (F(1, 107)=21.24, p<.001, η 2=0.17), and difference in pay (F(1, 107)=110.37, p<.001, η 2=0.51). There was no valence by magnitude interaction (F<1). Thus, participants preferred the choice manager significantly more when gains were at stake (M=38.06%, SE=3.26%) than when losses were at stake (M=30.44%, SE=2.95%), and this preference did not differ significantly for specific prospects. For example, preference for choice was similar for Choice $6 vs. No-choice $7 (70%) and Choice $6 vs. No-choice $8 (66%). Decreased preference for choice among loss job offers correlated with participant’s reaction to losses during the outcome satisfaction task. Participants who exhibited a stronger affective reaction to losses during the outcome satisfaction task (see manipulation check) preferred choice less when facing loss job offers (r(106)=-0.35, p<.001).
We tested cognitive models of our hypothesized attention weighting mechanism to gain more insight into participants’ outcome satisfaction and preference for choice.
Our three procedural utility models consisted of intercept and slope parameters that attempted to match the outcome satisfaction data. Intercepts represented utility bonuses, where choice (procedural utility) increased felt satisfaction. Slopes represented rates of change, where utility bonuses could accelerate or decelerate from one payoff to another. We compared these models to a more standard subjective utility baseline model that accounted for losses but assumed choice had no effect on outcome satisfaction.
The baseline model (BIC=-36) underestimated satisfaction for gains earned in choice trials and overestimated satisfaction for gains earned in no-choice trials (Appendix D Figure D1). The baseline model was more accurate when estimating satisfaction for losses.
Every procedural utility model (BICs>-50) outperformed the baseline model. The best-fitting model was the matched-slopes model (BIC=-57), which used intercepts to apply an overall utility bonus to gain outcomes earned by choice (+0.56) and a smaller bonus (+0.34) to losses earned by choice, but held the bonus rates of change constant across different outcomes sizes. This model assumes that participants pay attention to both procedural utility (choice) and outcome utility (financial payoffs) when facing gains, but less attention to procedural utility when facing losses. This finding is consistent with theories that propose financial security captures attention when individuals face losses (e.g., Yechiam & Hochman, 2013). The matched slope model performed better than a full procedural utility model, which assumed that attention and the corresponding bonus for choice changed at each outcome level $1 to $9 (BIC=-51), and a constrained model, which assumed procedural utility only applied to gains (i.e., was completely ignored for losses; BIC=-54). The underlying equations and parameter estimates for each model are included in Appendix D.
Participants were most sensitive to tradeoffs between choice and financial payoffs when job offers differed by only $1 (Figure 9, top line), so we modeled those preferences.
The baseline model was a standard reference-dependent subjective utility model. This model ignored freedom of choice when calculating and comparing the utility (µ) of each payoff, and used the logistic function 1/(1+e−µ) to account for the probabilistic (stochastic) effect of losses on subsequent preferences. The predicted utility (µ) of Choice was always -1, because Choice always paid $1 less than No-choice (e.g., Choice $1 vs. No-Choice $2). Thus, this model always chose the no-choice job offer.
The procedural utility models applied bonuses to the utility (µ) of the payoffs offered by the choice manager, increasing the perceived utility of those payoffs. An additive model added a constant bonus regardless of outcome type (loss, gain). A loss averse model added a smaller bonus to loss outcomes. These bonuses were estimated parameters. By comparison, the baseline model (above) added no bonuses. Thus, attention weighting was embodied by the presence or absence and size of a procedural utility bonus, specifically for Choice outcomes (see Appendix D for full details of each model).
Every procedural utility model (BICs>−52) outperformed the baseline model (BIC=−16). The baseline model underestimated preference for Choice by 37% (see Supplement D Figure D2). The loss averse procedural utility model, which assumed less attention (i.e., a smaller bonus) to choice when losses were at stake, fit the data best (BIC=−52). This model estimated that decision makers applied a utility bonus of +1.79 to the choice manager’s offers when both offers were among gains (e.g., Choice $6 vs. No-Choice $7), and +1.40 when the offers were among losses (e.g., Choice $3 vs. No-Choice $4). This model also outperformed the additive model (BIC=−45), which assumed that the bonus of choice did not depend on outcome valence, and a status-quo biased model (BIC=-51) that assumed the bonus of choice was especially weak for Choice $4 vs. No-Choice $5. These results are consistent with general negativity bias and an attention-weighting mechanism that de-emphasizes choice when financial losses are at stake.
Prior research finds a general preference for choice and posits increased utility for outcomes earned by choice. Yet, conventional theories in decision making largely ignore preferences for choice and assume utilities are defined exclusively along anticipated outcomes (Frey et al., 2004; Leotti et al., 2010; Tyler, 2006). Procedural utility is believed to arise from freedom of choice, because exercising choice satisfies fundamental needs for self-determination, procedural fairness, competence, and belonging (Frey et al., 2004; see also, Ryan and Deci, 2017). As research on procedural utility grows, so does the need for experimental studies and descriptive cognitive models that integrate procedural utility with more conventional outcome-based models of decision making (see DeCaro 2018, 2019; Ostrom, 1998).
We examined preference for choice and tradeoffs between procedural utility and outcome utility using a salesperson training task (Experiment 1) and a card-based decision task (Experiment 2). Participants reported their satisfaction with identical monetary losses and gains earned with hypothetical managers who either granted or denied personal choice. In Experiment 2, participants also completed a preference task, pitting freedom of choice against financial losses and gains. Participants indicated their preference for choice when losses (values below $5; e.g., Choice $2 vs. No-Choice $3), gains (values above $5; e.g., Choice $8 vs. No-Choice $9), and pay disparities were at stake (e.g., Choice $1, No-Choice $9).
Participants reported feeling more self-determination (Experiments 1 and 2), procedural fairness, belonging, and competence (Experiment 2) when they made decisions themselves. Participants’ outcome satisfaction was also greater during choice trials. However, this effect depended on the valence of the outcomes. Outcome satisfaction was greater during choice trials when the payoffs were gains than losses. In addition, participants preferred to have freedom of choice more when the financial prospects were gains (e.g., Choice $6 vs. No-Choice $7) than losses (e.g., Choice $3 vs. No-Choice $4; Experiment 2).
These findings are consistent with our hypothesis that choice procedures and outcomes represent two available information sources for decision makers. When financial losses were at stake, decision makers emphasized outcome utility. With emphasis placed on financial outcomes, individuals sought to minimize losses, sacrificing freedom of choice. In contrast, when gains were at stake—and their basic financial goal (i.e., status quo) was satisfied—individuals emphasized procedural utility.
To better understand the cognitive processes involved, we tested three cognitive models of procedural utility against a standard subjective utility model that ignores the utility of choice. The best-fitting model for outcome satisfaction was a procedural utility model that ignored payoff size but added a different bonus to the utility of outcomes earned with choice, depending on outcome valence. The estimated utility bonus of choice was greater for gains (+0.56) than losses (+.034), representing decreased attention to procedural utility. In the preference task, the best-fitting model applied a bonus to the expected utility of the payoff offered by the choice manager (+1.79 to gains, +1.40 to losses). Among job offers involving only gains (e.g., Choice $6 vs. No-Choice $7), this additional procedural utility is sufficient to offset the lower pay offered by the choice manager. Hence, individuals selected the choice manager’s offer more often than anticipated by outcome utility alone. The smaller bonus for losses accounts for participants’ decreased preference for choice among losses (e.g., Choice $6 vs. No-Choice $7).
Prior research on procedural utility treats the value of self-determination as unlimited, noting that individuals value freedom of choice above most economic outcomes (e.g., Frey et al., 2004; Leotti & Delgado, 2011). Self-determination is considered a fundamental need (Deci & Ryan, 2000; Leotti et al., 2010). However, our findings suggest there is a limit to the value of choice. In the preference task (Experiment 2), when the difference in pay reached $2 (22% of the pay scale), preference for choice dropped from 64% to 36%, and steadily declined to 7% with each successive increase in the pay gap between choice and no-choice job offers.
The benefits of choice are debated (see Ryan & Deci, 2006; Schwartz, 2000). Freedom of choice is thought to be highly valued, especially in Western societies, and to improve motivation, acceptance, and well-being (Deci & Ryan, 2000; Frey et al., 2004; Tyler, 1988). However, choice effects are mixed (Chess & Purcell, 1999; DeCaro, Janssen & Lee, 2015), and people do not always desire choice (Beattie, Baron, Hershey & Spranca, 1994; Burger, 1989; Schwartz, 2000). The finding that financial losses constrain preference for choice clarifies an important boundary to decision makers’ desire for choice.
For example, though self-employed workers may experience more satisfaction (e.g., Benz & Frey, 2008a), most individuals choose standard employment opportunities where they exchange some freedom of choice for job security and predictable income. Similarly, citizens exchange some control to governments for vital societal goods, like national security and economic development (Davis & Silver, 2004; Farber, 2008; Sen, 1999). Decision science may better account for these exchanges by incorporating procedural utility and their tradeoffs with other important commodities (see DeCaro, 2018, 2019). For example, DeCaro et al. (2015) found that groups sustained a valuable resource better when they could vote on rules and use economic sanctions to enforce them, simultaneously satisfying procedural and economic utilities.
The concept of procedural utility is relatively new in decision science (Frey et al., 2004). However, research has been conducted on similar topics in numerous disciplines (Burger, 1989; Greenburg, 2000; Ryan & Deci, 2006, 2017; Tyler, 1988). Future research should synthesize these concepts into a comprehensive theory of procedural utility, identifying boundary conditions and core principles of how procedural and economic utilities jointly influence behavior. Cognitive models could provide a tool to test competing theoretical explanations.
Any factor that alters the balance of attention between procedural and outcome utility should be theoretically relevant. We outline some important considerations below.
The decision tasks in our experiments pertained to financial decisions. In addition, participants relinquished control temporarily, and only within the decision task itself. In some decision situations, the focal goal may instead be freedom and justice. Detriments to freedom of choice may be more substantial (e.g., loss of civil liberties) and long-lasting (e.g., elections, policy decisions) in such contexts. People may treat choice as a sacred value in those situations (Fiske & Tetlock, 1997), making them less likely to sacrifice choice for financial welfare (Brehm & Brehm, 1981). For example, most people refuse to abandon voting rights at any economic price, even though a single vote has minimal effect on election results (e.g., Güth & Weck-Hannemann, 1997). Similarly, Lind et al. (1993) found that litigants in corporate lawsuits accepted monetary awards based primarily on perceived procedural fairness, not objective outcomes.
Our results imply that decision makers respond less negatively to no-choice situations that are construed as non-coercive or as preventing significant losses. In Experiment 1, we included a random “computer” no-choice condition for a subset of participants to “watch and learn”. Procedural utility effects were strongest when comparing the choice manager to the no-choice manager, which deliberately undermined choice. This distinction is important because it indicates that the way “no-choice” is portrayed matters. Experiments that use non-social, uncoercive no-choice conditions are more common in cognitive science experiments on procedural utility, but may find weaker effects (e.g., Leotti & Delgado, 2014).
Loss of choice may also be perceived less negatively if framed as preventing instrumental losses. For example, the United States Patriot Act, which limits certain civil liberties and increases domestic surveillance, was passed after the 9/11 terrorist attacks. The Act was framed as a necessary safeguard against dire future attacks portrayed as significantly worse (loss) than previous attacks (status quo) (Farber, 2008). In a national survey, Davis and Silver (2004), found that people with stronger perceptions of threat were more willing to sacrifice civil liberties for security (see also Nelson, Clawson & Oxley, 1997). Political messages often frame issues as avoiding losses to cherished goods like life, liberty, or economic security (Cornforth, 2009). These framing effects may be important when considering tradeoffs between procedural and outcome utility, especially in politics and governance. We mention this research to draw attention to a topic of great societal significance and high growth potential for procedural utility research (see DeCaro, 2018; Ostrom, 1980; Ryan & Deci, 2017; Sen, 1999).
Different choice procedures pose different costs to individuals. There are situations where people do not prefer choice, such as decisions involving too many choices, skilled, effortful, complex, or time-consuming decisions, or decisions with undesirable or tragic choice options (Anderson, 2003; Beattie et al., 1994; Burger, 1989; Schwartz, 2000; Shapiro, Schwartz & Austin, 1996). Self-Determination Theory claims that choice is taxing and unsatisfying when dealing with uninteresting, unimportant, or extrinsically motivating topics (Moller, Deci & Ryan, 2006).
In a review of desire for control, Burger (1989) noted that individuals react negatively to personal control when significant hardship could be avoided by letting a more capable person take control. For example, individuals prefer to give control to someone with better task performance to avoid painful penalty shocks (Miller, 1980). Patients may defer medical decisions to doctors for similar reasons (e.g., Arora & McHorney, 2000). Self-efficacy is a crucial factor in these decision situations. Individuals respond more positively to control when they feel capable of handling the decision (see also Burger, Brown & Allen, 1983).
Factors that increase the perceived difficulty of the task, or the physical or psychological costs (e.g., stress) of choice, may alter the weight placed on choice. Consistent uncontrollable failure (losses) during decision making can generate learned helplessness, a general aversion to personal control (Seligman, 1972). In our experiments, participants performed well and felt competent making decisions, so these factors were not focal issues. However, if the decision tasks were substantially harder, choice may not have been valued so highly.
Individuals are also more reluctant to make decisions that are tragic or regretful. Beattie et al. (1994) found that most individuals (82%) preferred not to choose which of two sick children would die (due to insufficient supply of bone marrow); instead, they wanted the decision to be “made” by fate (e.g., biologically determined eligibility/match) (see also, Botti, Orfali & Iyengar, 2009). Thus, there are complex costs associated with choice that may moderate procedural utility (see also, Markus & Schwartz, 2010).
Subjective definitions of self-determination and procedural fairness differ culturally. Individuals in Western societies (e.g., United States) emphasize individual choice, and perceive most actions as choices (Savani et al., 2010). In contrast, individuals in collectivistic cultures (e.g., China, Russia) emphasize inclusive autonomy, meeting their fundamental needs by deferring choice to accepted social groups and authority figures (Rudy et al., 2007; Shao et al., 2013). For example, United States employees typically judge managers that undermine individual choice as unfair and more coercive than Chinese employees do (e.g., Brockner et al., 2001). Some Western forms of choice (e.g., personal control) may therefore be a disutility for individuals with different cultural worldviews of democracy (DeCaro & Stokes, 2013).
Finally, individual differences in desire for control may be context-specific (Beattie et al., 1994; Burger, 1989; Shapiro et al., 1996), even if self-determination is a fundamental need (Ryan & Deci, 2006). In the study of preferences for the U.S. Patriot Act (Davis & Silver, 2004), political liberals and African Americans were less likely to sacrifice their civil liberties for national security. The authors attributed this finding to African Americans’ historic struggle for political empowerment and liberals’ perception of civil liberties as sacred. Wetherell, Reyna, and Sadler (2013) demonstrated that political conservatives oppose universal healthcare, in part, due to fear of “big government” (i.e., reduced individual control).
Some individuals are especially averse to risk and uncertainty, heightening their fear of loss (Tom et al., 2007). This increased sensitivity may decrease preference for choice in risky or uncertain situations (e.g., Beattie et al., 1994). Finally, individuals find particular decision tasks or domains particularly interesting, fundamentally altering the perceived costs (e.g., effort) of choice (Moller et al., 2006).
These individual differences could potentially be accounted for in our models by decreased (or increased) procedural utility “bonuses” (i.e., intercepts) for choice. For example, risk aversion could yield an even smaller procedural utility bonus for losses or a disutility (i.e., negative value). It will be important to model the effects of such factors.
If choice is valued by decision makers, questions about tradeoffs and boundary conditions of procedural utility must be addressed in decision science research to properly account for human behavior. Our experiments add to this endeavor by identifying the role of losses in preference for choice and the procedural utility derived from exercising choice. Financial losses capture decision makers’ attention, encouraging them to prioritize financial outcomes over their freedom of choice.
Abelson, R. P., & Levi, A. (1985). Decision making and decision theory. In G. Lindzey & E. Aronson (Eds.), The Handbook of Social Psychology, 3rd Ed., Volume 1 (pp. 231–309). NY: Random House.
Anderson, Christopher J. (2003). The psychology of doing nothing: forms of decision avoidance result from reason and emotion. Psychological Bulletin, 129(1), 139–167.
Arora, N. K., & McHorney, C. A. (2000). Patient preferences for medical decision making: who really wants to participate?. Medical care, 335–341.
Arrow, K. J. (1951/2012). Social choice and individual values (Vol. 12). Yale University Press.
Ajzen, I. (1991). The theory of planned behavior. Organizational Behavior and Human Decision Processes, 50, 179–211.
Baumeister, R. F., Bratslavsky, E., Finkenauer, C., & Vohs, K. D. (2001). Bad is stronger than good. Review of General Psychology, 5(4), 323–370.
Baumeister, R. F., & Leary, M. R. (1995). The need to belong: desire for interpersonal attachments as a fundamental human motivation. Psychological Bulletin, 117(3), 497–529.
Beattie, J., Baron, J. Hershey, J. C., & Spranca, M. D. (1994). Psychological determinants of decision attitude. Journal of Behavioral Decision Making, 7, 129–144.
Bechara, A., Damásio, A. R., Damásio, H., & Anderson, S. W. (1994). Insensitivity to future consequences following damage to human prefrontal cortex. Cognition, 50, 7–15.
Becker, G. S. (1982). The economic approach to human behavior. Chicago, IL: Chicago University Press
Benz, M., & Frey, B. S. (2008a). The value of doing what you like: Evidence from the self-employed in 23 countries. Journal of Economic Behavior & Organization, 68, 445–455.
Benz, M., & Frey, B. S. (2008b). Being independent is a great thing: Subjective evaluations of self-employment and hierarchy. Economica, 75, 362–383.
Birnbaum, M. H. (1999). Paradoxes of Allais, stochastic dominance, and decision weights. In J. Shanteau, B. A. Mellers & D. A. Schum (Eds.), Decision science and technology: Reflections of the contributions of Ward Edwards, (pp. 27–52). Norwell, MA: Kluwer Academic Publishers.
Botti, S., Orfali, K., & Iyengar, S. S. (2009). Tragic choices: Autonomy and emotional responses to medical decisions. Journal of Consumer Research, 36(3), 337–352.
Bowles, S. (2008). Policies designed for self-interested citizens may undermine “the moral sentiments”: evidence from economic experiments. Science, 320, 1605–1609.
Brockner, J., Ackerman, G., Greenberg, J., Gelfand, M. J., Francesco, M. A., Chen, Z. X., Leung, K., Bierbrauer, G., Gomez, C., Kirkman, B. L., & Shapiro, D. (2001). Culture and procedural justice: the influence of power distance on reactions to voice. Journal of Experimental Social Psychology, 37(4), 300–315.
Brehm, S. S., & Brehm, J. W. (1981). Psychological Reactance: A Theory of Freedom and Control. Academic Press.
Burger, J. M. (1989). Negative reactions to increases in perceived personal control. Journal of Personality and Social Psychology, 56(2), 246–256.
Burger, J, M., Brown, R., & Allen, C. A. (1983). Negative reactions to personal control. Journal of Social and Clinical Psychology, 1, 322–342.
Busemeyer, J. R. & Townsend, J. T. (1993). Decision Field Theory: A dynamic cognition approach to decision making. Psychological Review, 100, 432–459.
Camerer, C. F., Loewenstein, G. & Rabin, M. (Eds). (2004). Advances in behavioral economics. Princeton University Press.
Chess, C., & K. Purcell. (1999). Public participation and the environment: Do we know what works? Environmental Science and Technology, 33(16), 2685–2692.
Colquitt, J. A. (2001). On the dimensionality of organization justice: A construct validation measure. Journal of Applied Psychology, 86(3), 386–400.
Cornforth, A. (2009). Behaviour change: insights for environmental policy making from social psychology and behavioural economics. Policy Quarterly, 5(4), 21–28.
Dacey, R. (2003). The S-shaped utility function. Synthese, 135(2), 243–272.
Davis, D. W., & Silver, B. D. (2004). Civil liberties vs. security: public opinion in the context of the terrorist attacks on America. American Journal of Political Science, 48(1), 28–46.
DeCaro, D. A. (2018). Humanistic rational choice and compliance motivation in complex societal dilemmas. In S. Siddiki, S. Espinosa, & T. Heikkila (Eds), Contextualizing compliance in the public sector: Individual motivations, social processes, and institutional design (pp. 126–147). Routledge, New York, USA.
DeCaro, D. A. (2019). Humanistic rational choice: understanding the fundamental motivations that drive self-organization and cooperation in commons dilemmas. In B. Hudson., J. Rosenbloom, & D. Cole (Eds.), Routledge handbook of the study of the commons (pp. 117–131). Routledge, New York, USA.
DeCaro, D. A., Janssen, M. A., & Lee, A. (2015). Synergistic effects of voting and enforcement on internalized motivation to cooperate in a resource dilemma. Judgment and Decision Making, 10(6), 511–537.
DeCaro, D. A., & Stokes, M. K. (2013). Public participation and institutional fit: a social–psychological perspective. Ecology and Society, 18(4), 40. http://dx.doi.org/10.5751/ES-05837--180440.
Deci, E. L., & Ryan, R. M. (1985). Intrinsic motivation and self-determination in human behavior. New York: Plenum.
Deci, E. L., & Ryan, R. M. (1987). The support of autonomy and the control of behavior. Journal of Personality and Social Psychology, 53(6), 1024–1037.
Deci, E. L., Eghrari, H., Patrick, B. C., & Leone, D. R. (1994). Facilitating internalization: The self-determination theory perspective. Journal of Personality, 62, 119–142.
Deci, E. L., & Ryan, R. M. (2000). The “what” and “why” of goal pursuits: Human needs and the self-determination of behavior. Psychological Inquiry, 11, 227–268.
De Cremer, D., & Blader, S. L. (2006). Why do people care about procedural fairness? The importance of belongingness in responding and attending to procedures. European Journal of Social Psychology, 36(2), 211–228.
Diecidue, E., Schmidt, U., & Wakker, P. P. (2004). The utility of gambling reconsidered. The Journal of Risk and Uncertainty, 29(3), 241–259.
Edwards, W. (1954). The theory of decision making. Psychological Bulletin, 51(4), 380–417.
Farber, D. A. (2008). Security v. liberty. Conflicts between civil liberties and national security in American history. Russell Sage Foundation.
Frey, B. S., & Stutzer, A. (2005). Beyond outcomes: measuring procedural utility. Oxford Economic Papers, 57(1), 90–111.
Frey, B. S., Benz, M., & Stutzer, A. (2004). Introducing procedural utility. Not only what, but also how matters. Journal of Institutional and Theoretical Economics, 160, 377–401.
Fiske, A. P., Tetlock, P. E. (1997). Taboo trade-offs: Reactions to transactions that transgress the spheres of justice. Political Psychology, 19(2), 255–297.
Gärling, T., Axhausen, K., Brydsten, M. (1996). Travel choice and the goal/process utility distinction. Applied Cognitive Psychology, 10, 65–74.
Greenberg, J. (2000). Promote procedural justice to enhance acceptance of work outcomes. In E. A. Locke (Ed.), A Handbook of Principles of Organizational Behavior (pp. 181–195). Oxford, England: Blackwell.
Güth, W., Weck-Hannemann, H. (1997). Do people care about democracy? An experiment exploring the value of voting rights. Public Choice, 91, 27–47.
Harmon-Jones, E, Amodio, D. M., & Zinner, L. R. (2007). Social psychological methods of emotion elicitation. Handbook of Emotion Elicitation and Assessment, 91, 91–105.
Heath, C., Larrick, R. P., & Wu, G. (1999). Goals as reference points. Cognitive Psychology, 38, 79–109.
Hertwig, R., & Ortmann, A. (2001). Experimental practices in economics: a methodological challenge for psychologists?. Behavioral and Brain Sciences, 24(3), 383–403.
Hsee, C. K., Rottenstreich, Y., & Xiao, Z. (2005). When is more better? On the relationship between magnitude and subjective value. Current Directions in Psychological Science, 14(5), 234–237.
Kahneman, D. (1992). Reference points, anchors, norms, and mixed feelings. Organizational Behavior and Human Decision Processes, 51, 296–312.
Kahneman, D., & Tversky, A. (1979). Prospect theory: An analysis of decisions under risk. Econometrica, 47, 263–291.
Kahneman, D., Wakker, P. P., & Sarin, R. (1997). Back to Bentham? Exploration of experienced utility. The Quarterly Journal of Economics, 112(2), 375–405.
Koop, G. J., & Johnson, J. G. (2012). The use of multiple reference points in risky decision making. Journal of Behavioral Decision Making, 25(1), 49–62.
Le Menestrel, M. (2001). A process approach to the utility for gambling. Theory and Decision, 50, 249–262.
Leotti, L. A., & Delgado, M. R. (2011). The inherent reward of choice. Psychological Science, 22(10), 1310–1318.
Leotti, L. A. and Delgado, M. R. (2014). The value of exercising control over monetary gains and losses. Psychological science, 25(2), 596–604.
Leotti, L. A., Iyengar, S. S., & Ochsner, K. V. (2010). Born to choose: The origins and value of the need for control. Trends in Cognitive Science, 14(10), 457–463.
Levenson, H. (1981). Differentiating among internality, powerful others, and chance. In Herbert M. Lefcourt (Ed.), Research with the Locus of Control Construct (Vol. 1., pp. 15–63). New York, NY: Academic Press, Inc.
Lind, E. A., Kulik, C. T., Ambrose, M., & de Vera Park, M. V. (1993). Individual and corporate dispute resolution: Using procedural fairness as a decision heuristic. Administrative Science Quarterly, 38(2), 224–251.
Lopes, L. L. (1987). Between hope and fear: The psychology of risk. Advances in Experimental Social Psychology, 20, 255–295.
Markus, H. R., & Schwartz, B. (2010). Does choice mean freedom and well-being? Journal of Consumer Research, 37(2), 344–355.
Mellers, B. A. (2000). Choice and the relative pleasure of consequences. Psychological Bulletin, 126(6), 910–924.
Mellers, B. A., Yin, S., & Berman, J. (in preparation). Reconciling loss aversion and gain seeking in judgments of emotion. Working paper shared April 10, 2020.
Miller, S. M. (1980). Why having control reduces stress: If I can stop the roller coaster, I don’t want to get off. In J. Garber & M. E. P. Seligman (Eds.), Human helplessness: Theory and applications (pp. 71–95). New York: Academic Press.
Moller, A. C., Deci, E. L. & Ryan, R. M. (2006). Choice and ego-depletion: the moderating role of autonomy. Personality and Social Psychology Bulletin, 32(8), 1024–1036.
Mukherjee, S., Sahay, A., Pammi, V. S. C., & Srinivasan, N. (2017). Is loss-aversion magnitude-dependent? Measuring prospective affective judgments regarding gains and losses. Judgment and Decision making, 12(1), 81–89.
Nelson, T. E., Clawson, R. A., & Zoe, M. (1997). Media framing of civil liberties conflict and its effects on tolerance. American Political Science Review, 91(3), 567–583.
Novemsky, N., & Kahneman, D. (2005). The boundaries of loss aversion. Journal of Marketing Research, 42, 119–128.
Ostrom, E. (1998). A behavioral approach to the rational choice theory of collective action Presidential Address, American Political Science Association, 1997. American Political Science Review, 92(1), 1–22.
Ostrom, E. (2005). Understanding institutional diversity. Princeton, NJ: Princeton University Press.
Ostrom, V. (1980). Hobbes, covenant, and constitution. Publis, 10(4), 83–100.
Rick, S. (2011). Losses, gains, and brains: Neuroeconomics can help to answer open questions about loss aversion. Journal of Consumer Psychology, 21(4), 453–463.
Rudy, D., Sheldon, K. M., Awong, T., & Tan, H. H. (2007). Autonomy, culture, and well-being: the benefits of inclusive autonomy. Journal of Research in Personality, 41, 983–1007.
Ryan, R. M. (1982). Control and information in the intrapersonal sphere: An extension of cognitive evaluation theory. Journal of Personality and Social Psychology, 43, 450–461.
Ryan, R. M., & Connell, J. P. (1989). Perceived locus of causality and internalization: Examining reasons for acting in two domains. Journal of Personality and Social Psychology, 57(5), 749–761.
Ryan, R. M., & Deci, E. L. (2006). Self-regulation and the problem of human autonomy: Does psychology need choice, self-determination, and will? Journal of Personality, 74(6), 1557–1585.
Ryan, R. M., & Deci, E. L. (2017). Pervasive social influences, Part II. Economic and political systems (pp. 591–615). Self-determination theory: Basic psychological needs in motivation, development, and wellness. Guilford Publications.
Samuelson, W., & Zeckhauser, R. (1988). Status quo bias in decision making. Journal of Risk and Uncertainty, 1, 7–59.
Schoemaker, P. J. H. (1982). The expected utility model: Its variants, purposes, evidence, and limitations. Journal of Economic Literature, 20, 529–563.
Schwarz, G. E. (1978). Estimating the dimension of a model. Annals of Statistics, 6(2), 461–464.
Schwartz, B. (2000). Self-determination: The tyranny of freedom. American Psychologist, 55, 79–88.
Sen, A. (1997). Maximization and the act of choice. Econometrica, 65(4), 745–779.
Sen, A. (1999). Development as freedom. New York: Anchor Books.
Shao, R., Rupp, D. E., Skarlicki, D. P., & Jones, K. S. (2013). Employee justice across cultures: A meta-analytic review. Journal of Management, 39(1),.263–301.
Shapiro, D. H. Jr., Schwartz, C. E., & Astin, J. A. (1996). Controlling ourselves, controlling our world: Psychology’s role in understanding positive and negative consequences of seeking and gaining control. American Psychologist, 51(12), 1213–1230.
Sheldon, K. M., & Filak, V. (2008). Manipulating autonomy, competence, and relatedness support in a game-learning context: New evidence that all three needs matter. British Journal of Social Psychology, 47(2), 267–283.
Sheldon, K. M., Elliot, A. J., Ryan, R. M., Chirkov, V., Kim, Y., Wu, C., Demir, M. and Sun, Z. (2004). Self-concordance and subjective well-being in four cultures. Journal of Cross-Cultural Psychology, 35(2), 209–223.
Simon, H. A. (1955). A behavioral model of rational choice. Quarterly Journal of Economics, 69, 99–118.
Slovic, P., Fischgoff, B., & Lichtenstein, S. (1977). Behavioral decision theory. Annual Reviews of Psychology, 28, 1–39.
Smith, A. (1759/2010). The theory of moral sentiments. Penguin.
Szrek, H., & Baron, J. (2007). The value of choice in insurance purchasing. Journal of Economic Psychology, 28(5), 529–544.
Sokol-Hessner, P., Hsu, M., Curley, N. G., Delgado, M. R., Camerer, C. F., & Phelps, E. A. (2009). Thinking like a trader selectively reduces individuals’ loss aversion. Proceedings of the National Academy of Sciences, 106(13), 5035–5040.
Takenishi, M., Takenishi, A (2006). Group-value and self-value of procedural justice: Examining the social identity mediation model on group-oriented behaviors and self-esteem. Japanese Journal of Social Psychology, 22(2), 198–220.
Tom, S. M., Fox, C. R., Trepel, C. & Poldrack, R. A. (2007). The neural basis of loss aversion in decision-making under risk. Science, 315(5811), 515–518.
Tversky, A., & Kahneman, D. (1981). The framing of decisions and the psychology of choice. Science, 211(4481), 453–458.
Tversky, A., & Kahneman, D. (1991). Loss aversion in riskless choice: A reference-dependent model. The Quarterly Journal of Economics, 106, 1039–1061.
Tyler, T. R. (1989). The psychology of procedural justice: A test of the group-vale model. Journal of Personality and Social Psychology, 57: 830–838.
Tyler, T. R. (1988). What is procedural justice? Law and Society Review, 22, 301–335.
Tyler, T. R. (2006). Process utility and help seeking: What do people want from experts? Journal of Economic Psychology, 27, 360–376.
van Prooijen, J. W. (2009). Procedural justice as autonomy regulation. Journal of Personality and Social Psychology, 96(6), 1166–1180.
Von Neumann, J., & Morgenstern, O. (1947). Theory of games and economic behavior (2nd Ed.). Princeton, NJ: Princeton University Press.
Wetherell, G., Reyna, C., & Sadler, M., 2013. Public option versus the market: Perceived value violations drive opposition to healthcare reform. Political Psychology, 34(1), 43–66.
Yechiam, E., & Hochman, G. (2013). Losses as modulators of attention: review and analysis of the unique effects of losses over gains. Psychological Bulletin, 139(2), 497–518.
This article is based on a dissertation submitted to Miami University and was supported by a Dissertation Research Grant from Miami University.
Copyright: © 2020. The authors license this article under the terms of the Creative Commons Attribution 3.0 License.
This document was translated from LATEX by HEVEA.