The attribute framing bias is a well-established phenomenon, in
which an object or an event is evaluated more favorably when
presented in a positive frame such as “the half full glass” than
when presented in the complementary negative framing. Given that
previous research showed that visual aids can attenuate this bias,
the current research explores the factors underlying the attenuating
effect of visual aids. In a series of three experiments, we examined
how attribute framing bias is affected by two factors: (a) The
display mode—verbal versus visual; and (b) the representation of
the critical attribute—whether one outcome, either the positive
or the negative, is represented or both outcomes are represented. In
Experiment 1 a marginal attenuation of attribute framing bias was
obtained when verbal description of either positive or negative
information was accompanied by corresponding visual representation.
In Experiment 2 similar marginal attenuation was obtained when both
positive and negative outcomes were verbally represented. In
Experiment 3, where the verbal description represented both positive
and negative outcomes, significant attenuation was obtained when it
was accompanied by a visual display that represented a single outcome,
and complete attenuation, totally eliminating the framing bias, was
obtained when it was accompanied by a visual display that represented
both outcomes. Thus, our findings showed that interaction between
the display mode and the representation of the critical attribute
attenuated the framing bias. Theoretical and practical implications
of the interaction between verbal description, visual aids and
representation of the critical attribute are discussed, and future
research is suggested.
Various writers have suggested that biases in judgments and decisions
may be reduced by concrete and visual presentation of data (e.g.,
Gigerenzer et al., 2007). In this paper we focus on the
attribute-framing bias and examine whether it is moderated by
displaying the critical attribute visually in a graph alongside the
verbal description. While previous studies have already showed
attenuation of the framing bias using visual aids (e.g.,
Garcia-Retamero & Cokely, 2011; Garcia-Retamero & Galesic, 2010) the
aim of the current research was to explore the factors underlying this
attenuation. Based on the literature, we propose that two factors are
involved in visual attenuation. The first is the display
mode—whether the problem is presented verbally or visually. The
second factor is the representation of the critical
attribute—whether both the positive and the negative outcomes or
only one outcome are represented. Systematic examination of the
interaction of these two factors may shed light on the cognitive
processes underlying attribute-framing bias. Moreover, it may have
practical implications, given that attribute framings influence
important judgments and decisions in health, financial decisions,
consumer behavior, and many other domains (see review in Levin et al.,
1998).
1.1 Framing effects
Research on framing effects took off after Tversky and Kahneman (1981)
introduced the systematic reversals of preferences that people exhibit in
alternate framings of problems, contingencies or outcomes. Following Tversky
and Kahneman (1981), many studies examined the valence framing effect in
various contexts, demonstrating that the mere presentation of the same
glass as half full or half empty affects judgment and decision making (Frisch,
1993; Keren, 2010).
Reviewing the abundant research on framing effects, Levin et al. (1998)
discerned three types of framing: risky choice framing, goal framing, and
attribute framing. Tversky and Kahneman’s (1981) famous “Asian disease” is
the most well-known typical example of the first type, risky choice
framing. They demonstrated that people show reversed preferences between two
options when these were presented in either a positive (“lives saved”) or
negative (“lives lost”) frame. The second type, goal framing,
relates to the persuasive power of presenting the same message in either gain
terms when performing an action or loss terms when not performing it. A typical
context of goal framing is health related behavior, in which both society and
each individual would benefit if a particular health promoting or disease
preventing behavior is adopted. Rothman and Salovey (1997) proposed that the
perceived risk of the health behavior moderates the effectiveness of the
message frame: for relatively safe behaviors (e.g., prevention behavior)
positive framing is more effective, while for risky behaviors (e.g., detection
of an illness) negative framing is more effective. Although this moderating
effect was reported upon in the literature, recent meta-analysis has raised
some doubt about its empirical veracity (Gallagher & Updergraff, 2012).
In this paper we focus on the third type, attribute
framing. Specifically, we examine the situation in which one can refer
to an object or event by presenting either the positive aspect of a
central attribute (e.g., the success rate in an academic course) or
the complementary negative aspect of the same attribute (e.g., the
failure rate in the same course). Such framing was shown to result in
a bias in evaluation. For example, Levin and Gaeth (1988) showed that
people evaluated the quality of ground beef as better when it was
labeled as “75% lean” (positive framing) relative to “25% fat”
(negative framing). Attribute framing typically shows a robust effect
with an advantage for the positive versus negative framing when
evaluating events or objects. Levin et al. (1998) reviewed dozens of
studies and concluded that, in most of them, positive framing resulted
in more favorable evaluations of objects or events relative to
negative framing. In a meta-analysis of 30 studies, Pinon and Gambara
(2005) reported an average attribute framing effect size of 0.26, but
they suspected that this relatively small effect size reflected an
underestimate due to the statistical methods used for the
meta-analysis.
Levin et al. (1998) proposed a theoretical explanation for the cognitive
mechanism through which attribute framing affects people’s judgments and
evaluations. They suggested that presenting an object or an event in positive
or negative framing affects information processing in a way similar to priming.
Positive or negative framing activates corresponding favorable or unfavorable
associations that bias people’s judgments and evaluations (Levin et al., 1998).
This theoretical explanation attributed the framing bias to information
encoding and processing and was not restricted to verbal presentation.
Although most studies examined verbal attribute framing, we argue that
examining the effect of visual display mode on attribute-framing bias might
help understand the cognitive processes underlying framing bias.
Table 1: The text and/or figures presented in the four conditions of
Experiment 1.
Positive framing
Negative framing
Verbal display
You know a driving instructor 85% of whose
students pass their driving test the first time they
take it.
You know a driving instructor 15% of whose
students fail their driving test the first time they
take it.
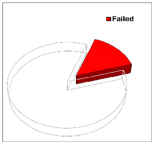
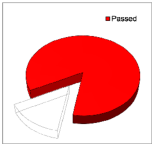
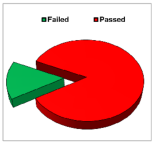
Visual display
You know a driving instructor some of whose students
pass their driving test the first time they take it,
as described in the adjacent figure:
You know a driving instructor some of whose students
fail their driving test the first time they take it,
as described in the adjacent figure:
1.2 Visual framing versus verbal framing
In discussing people’s errors in the evaluation of quantitative data, Gigerenzer
et al. (2007) argued that one reason for errors and biased evaluations may be
that the presentation of numerical data is too difficult and that presenting
data visually might offer a more concrete representation that would be easier
to process and thereby attenuate biases relative to verbal presentation of
numerical data.
Several studies examined the possible effect of visual and graphical
presentation on framing bias. For example, Sun et al. (2012) altered the
spatial characteristics of a graphical display presenting two attributes of MP3
products, namely reliability and capability: Product A had superior reliability
while product B had superior capability. The products were presented visually
in a figure where the X axis represented capability and the Y axis represented
reliability. The relative length of the axes was manipulated such that in one
figure the axis representing capability was longer than that representing
reliability, and in the other this was reversed. Participants gave higher
evaluations to the product (either A or B) when its superior aspect was
represented by the longer axis. Thus, the authors concluded that the aspect
that presents the differences in a more salient fashion had a stronger effect
on participants’ evaluations (Sun et al., 2012) and suggested that evaluations
are affected by the spatial characteristic of the visual display. Sun et al.
examined framing problems in the broader or loose definition of framing. They
did not examine the effect of visual display on valence framing.
More relevant to the current paper are papers that showed that visual aids
facilitated the processing of statistical information (e.g., Kurz-Milcke et
al., 2008) in the context of applied psychology. For example, recent studies
examined the efficacy of visual aids in preventing framing biases related to
goal framing (Garcia-Retamero & Cokely, 2011) and attribute framing
(Garcia-Retamero & Galesic, 2010) in the context of health information. In
these studies participants were presented with a verbal message framed either
in a positive or negative manner accompanied by an identical visual display.
These findings clearly indicate that visual presentation of the statistical
information can reduce the framing bias. These studies, however, did not
explore what factors in the visual display contribute to the attenuation of the
framing bias. Possibly, the visual attenuation may be due to the fact that an
identical graph was presented in both positive and negative framing conditions.
Thus, while the Garcia-Retamero and Galesic (2010) study manipulated framing by
presenting either the positive or the negative outcome in the verbal
description, it did not manipulate framing in the visual display because both
positive and negative outcomes were equally represented in the graphs. The
current research aims to extend the investigation about the factors affecting
the attenuation of framing bias by systematically manipulating two factors:
display mode—whether the problem is presented verbally or visually—and the
representation of the critical attribute—whether both the positive and the
negative outcomes or only one outcome are represented.
1.3 Review of the experiments
In a series of three experiments, we systematically manipulated two factors,
namely display mode and representation of the critical attribute, in order to
examine their interactive contribution to the attenuation of the attribute
framing bias. In Experiment 1 we represented only one outcome of the critical
attribute, either the positive or the negative, and examined whether and to
what extent adding a visual display of a particular outcome attenuates framing
bias compared to verbal description without visual aids. Experiments 2 and 3
examined to what extent the representation of the critical attribute—whether
both the positive and the negative outcomes or only one outcome are
represented—affects attenuation of the framing bias. Experiment 2 focused
on verbal descriptions and examined to what extent the mixed representation of
both the positive and the negative outcomes attenuates framing bias compared to
a single-outcome representation. Experiment 3 focused on visual display to
similarly examine to what extent visual display of mixed versus single
representation of the outcomes attenuate framing bias compared to a single
outcome visual display.
2 Experiment 1
The aim of Experiment 1 was to examine whether and to what extent visual display
attenuates framing bias when different visual displays are used to represent
the positive and negative outcomes. Whereas Garcia-Retamero and Galesic (2010)
presented the same graphs for the negative and positive framing conditions, in
this experiment we used different graphs to present the positive and negative
numerical information (see Table 1). If visual aids generally attenuate the
verbal framing bias, we would expect to replicate the attenuating effect found
by Garcia-Retamero and Galesic (2010). If, however, the attenuation of the
framing bias actually results from the presentation of identical graphs for
both the positive and negative framing conditions, we would expect only
marginal attenuation of the framing bias, if any.
2.1 Method
2.1.1 Participants
Participants were 141 undergraduate students in an undergraduate program in an
Israeli higher education institution (85% female; mean age 23.5 with a
standard deviation of 1.8) who participated in the study in partial fulfillment
of their course requirement.
2.1.2 Design and Procedure
Experiment 1 comprised a between-participants 2x2 factorial design that
manipulated the display mode (verbal versus visual) and the framing (positive
versus negative). There were 35–36 participants in each experimental condition.
Participants were informed that the study examined people’s behavior in various
situations, and that the results of the questionnaire were anonymous and would
be used for research purposes only. Thereafter, they were presented with
several questions. The first question related to the present study, and the
others related to a different study. In the target question all participants
were asked to imagine that a young acquaintance of theirs is asking them about
a driving instructor. Participants were provided with information about the
success rate (in the positive framing condition) or failure rate (in the
negative framing condition) of this driving instructor’s previous students. The
success or failure rates were presented differently in the verbal and visual
display modes (see Table 1). In the Verbal Display mode, the positive
framing related to the driving instructor’s students’ 85% success rate while
the negative framing related to his students’ 15% failure rate (see Table 1).
In the Visual Display mode, the text related to the instructor’s
success rate (in the positive framing condition) or failure rate (in the
negative framing condition), and participants were referred to the pie-chart
(see Table 1). In the charts the red areas created the visual framing such that
in the positive framing the more salient red area represented the 85% passing
rate of the students of this instructor and in the negative framing the more
salient red area represented the 15% failing rate. The complementary failure
or success rates were outlined by faded contours, giving them a transparent
look. The salient colored area in each condition was placed at the top right
side of the figure to comply with visual scanning patterns of Hebrew readers
(e.g., Abed, 1991; Nachshon et al., 1977). Finally, all participants were asked
the same question regarding their recommendation intentions: Would you
recommend this driving instructor to your acquaintance? The answers were given
on a 7-point scale, ranging from 1 (I definitely won’t), to 2 (I won’t), 3 (I
probably won’t), 4 (maybe I will and maybe I won’t), 5 (I probably will), 6 (I
will), and 7 (I definitely will).
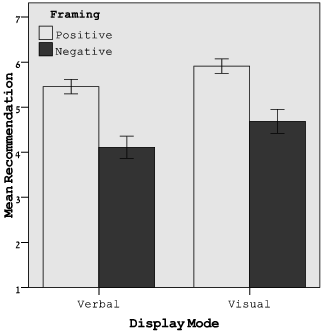
Figure 1: The means of recommendation intentions as a function of the display
mode and framing (error bars represent 1 standard error).
2.2 Results and discussion
Figure 1 presents the means of participants’ ratings of their
intentions to recommend the driving instructor
(recommendation intentions) as a function of the
display mode and framing. In both the verbal and visual display modes,
participants exhibit higher recommendation intentions in the positive
(vs. negative) framing conditions. The size of the attribute framing
effect was relatively large and statistically significant for both the
verbal display mode (Cohen’s d = 1.08; t(69) = 4.57,
p = .00), and the visual display mode (d
=0.94; t(68) = 3.93, p = .00).
A two-way ANOVA predicting the recommendation intentions from the display mode
and the framing revealed an insignificant interaction (F(1, 137) =
0.08, p = .79); the attribute framing effect was significant
(F(1, 137) = 36.0, p = .00), indicating that the
recommendation intentions were higher in the positive relative to the negative
framing, for both verbal and visual conditions. Finally, the effect of the
display mode was also significant (F(1, 137) = 5.78, p =
.02), indicating that the recommendation intentions were higher in the visual
relative to the verbal display mode (d = 0.37).
The main result of Experiment 1 was that visual presentation of the
numerical information about success and failure rates in a pie-chart
did not attenuate attribute framing bias. While Garcia-Retamero and
Galesic (2010) found attenuation of the framing effect using identical
visual display for the positive and negative framing, our finding
shows that, when different visual displays are used, the framing bias
is barely attenuated. This result suggests that visual presentation of
the numerical information cannot by itself attenuate the framing
bias. In fact, it might be possible to create a visual presentation
that would highlight only one of the two outcomes and elicit a framing
bias similar to the conventional verbal framing bias.
3 Experiment 2
Table 2: The text presented in the four conditions of Experiment 2.
Attribute representation
Positive framing
Negative framing
Single-outcome
You know a driving instructor
85% of whose students pass
their driving test the first time they take it.
You know a driving instructor
15% of whose students fail
their driving test the first time they take it.
Mixed
You know a driving instructor
85% of whose students pass
their driving test the first time they take it, while
15% fail it.
You know a driving instructor
15% of whose students fail
their driving test the first time they take it, while
85% pass it.
In order to disentangle the effects of the display mode and the attribute
representation, in Experiment 2 we focused on verbal presentation. Most
previous studies of framing bias represented only a single-outcome of the
critical attribute, while very few studies used a mixed representation (Bigman
et al., 2010; and see O’Connor et al., 1985, and O’Connor, 1989 for mixed
effects in risky choice framing). Of particular interest for the current
research is Bigman et al.’s (2010) study examining attribute framing. In this
study participants were asked to evaluate an HPV vaccine and rate their
intentions to recommend it to their acquaintances. The vaccine was described as
effective against HPV strains that cause 70% of cervical cancers (positive
framing) or as ineffective against HPV strains that cause 30% of cervical
cancers (negative framing). The experiment included four framing conditions:
positive, negative or mixed representation with either the positive preceding
the negative or vice versa. For the perceived effectiveness, the results
revealed a framing bias, but this bias was significant only between the
positive and negative conditions and not in the mixed conditions. For the
recommendation intentions only small and insignificant framing bias was
revealed between the positive and negative conditions. Thus, this study did not
resolve the question of whether the mixed representation of the critical
attribute attenuates the framing bias.
3.1 Method
3.1.1 Participants and procedure
There were 155 participants in this study, with mean age of 29.2 (SD =
12.1); 40% were males. Participants were sampled in a train station in the
Sharon area of Israel, and were given a small candy bar after filling in the
short questionnaire. Participants were approached individually and asked to
fill in the short self-administrated pen-and-paper questionnaire. The
experimenters reported a high rate of cooperation among the passengers.
3.1.2 Design and materials
The vignette presented to the participants was similar to the one used in
Experiment 1. The design was 2 framing conditions (positive versus negative) X
2 critical attribute representation (single-outcome versus mixed-outcome). The
single-outcome condition replicated the conventional verbal presentation of
either positive or negative information in a manner that was identical to the
verbal display mode of Experiment 1. In the mixed condition, both positive and
negative verbal information was presented and framing manipulated their order
of appearance—in the positive framing condition the positive outcome was
presented first and the negative second, and in the negative framing condition
the order was reversed. Table 2 presents the text for each of the four
experimental groups, in which there were between 37 and 42 participants. The
recommendation question was identical to one described in Experiment 1. We
hypothesized that in the mixed condition attribute framing bias would be
attenuated relative to the conventional single-outcome condition.
3.2 Results and discussion
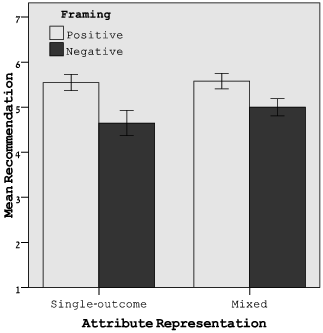
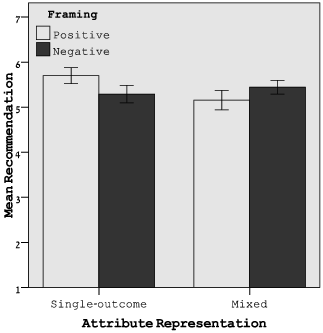
Figure 2 presents the means of participants’ recommendation intentions
as a function of attribute representation and framing. In the
single-outcome and mixed conditions participants exhibit higher
recommendation intentions in the positive versus negative framing
conditions. The attribute framing effect sizes were medium and
statistically significant for both the single-outcome (Cohen’s
d = 0.62; t(77) = 2.76, p = .01), and the
mixed (d =0.52; t(74) = 2.25, p = .03)
conditions.
A two-way ANOVA predicting the recommendation intentions from attribute
representation and framing revealed a non-significant interaction (F(1,
151) = 0.59, p = .44); the attribute framing effect was significant
(F(1, 151) = 12.5, p = .00), indicating that the
recommendation intentions were higher in the positive relative to the negative
framing, for both the single-outcome and the mixed conditions. Finally, the
effect of attribute representation was not significant (F(1, 151) =
0.84, p = .36), indicating that the recommendation intentions were
similar in the single-outcome relative to the mixed conditions (d =
0.12).
The main finding of Experiment 2 was that verbal presentation of both the
success and failure rates did not substantially attenuate attribute framing
bias. The results show comparable framing effect sizes for the single-outcome
condition and for the mixed condition. Consequently, it seems that, when both
positive and negative outcomes are represented, a framing bias can be generated
merely by reversing the order of their appearance.
Figure 2: The means of recommendation intentions as a function of the framing
and the verbal attribute representation (error bars represent 1 standard
error).
4 Experiment 3
Table 3: The text and figures presented in the four conditions of Experiment 3.
Attribute representation
Positive framing
Negative framing
Single-outcome
You know a driving instructor some of whose students
pass their driving test the first time they take it, and some
of whom fail it, as described in the adjacent figure:
You know a driving
instructor some of whose students fail their driving test the
first time they take it, and some of whom pass it, as
described in the adjacent figure:
Mixed
You know a driving instructor some of whose students
pass their driving test the first time they take it, and some
of whom fail it, as described in the adjacent figure:
You know a driving instructor some of whose students
fail their driving test the first time they take it, and some
of whom pass it, as described in the adjacent figure:
Experiment 3 used the same experimental design as in Experiment 2, but this time
we manipulated visual presentation using two factors: framing (positive versus
negative) and attribute representation (single-outcome versus mixed; see Table
3). In the single-outcome condition, we used the same visual display as in
Experiment 1, highlighting either the positive or negative outcome. In the
mixed condition, we presented both negative and positive outcomes using
different colors with similar saliency. Note, however, that in all four
conditions the verbal description accompanying the visual representation
included both positive and negative framing outcomes, ordered in a manner
reflecting the framing manipulation (as in the mixed condition of Experiment
2).
Experiments 1 and 2 found minor attenuation of the framing bias caused by a
visual display (Experiment 1) and by using mixed attribute representation
(Experiment 2). Hence, we predicted small attenuation of the framing bias in
the single-outcome visual presentation that combines visual representation of a
single outcome with verbal mixed attribute representation (see top panels in
Table 3). In contrast, in view of the attenuation shown in the findings of
Garcia-Retamero and Galesic (2010), we predicted that, in the mixed visual
presentation, where both outcomes are graphically balanced, framing bias would
be attenuated (bottom panels in Table 3). Moreover, given that in
Garcia-Retamero and Galesic (2010) the verbal description represented
only one outcome, whereas here the verbal description in the mixed visual
presentation included both outcomes, we may expect a larger attenuation or even
total elimination of framing bias.
4.1 Method
4.1.1 Participants and procedure
There were 149 participants in this study, with mean age of 28.9 (SD =
11.5); 39% were males. The sampling and the procedure were similar to the ones
reported for Experiment 2.
4.1.2 Design and materials
The vignette presented to the participants was similar to the one used in
Experiment 2. The design was similar to that of Experiment 2 but here we
substituted the numerical presentation of the information by figural
presentation: 2 framing conditions (positive versus negative) X 2 attribute
representation conditions (single-outcome versus mixed). Table 3 presents the
stimuli used in the four conditions that had between 36 and 38 participants. In
both attribute representation conditions, the text introduced both positive and
negative framing of success and failure, while manipulating their order of
presentation according to the framing condition—in the positive framing
condition the positive outcome was presented first and the negative second, and
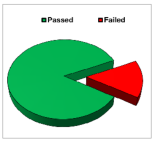
in the negative framing condition the order was reversed. The visual figure
used in the different conditions distinguished between the single-outcome and
mixed-outcome representations: For the single-outcome condition, either the
positive (the teacher’s 85% passing rate) or negative (the teacher’s 15%
failing rate) outcome of the critical attribute was presented in red while the
complementary failure or success rates were outlined by faded contours, giving
them a transparent look (replicating the visual manipulation of framing in
Experiment 1). In the mixed condition, the pie-charts presented either the
positive or negative outcome of the critical attribute in red on the right side
while the complementary outcome was presented in green on the left side of the
figure. As Table 3 demonstrates, the use of such different visual displays
allowed us to create visual representations that corresponded to the four
conditions of single-outcome versus mixed representation, and positive versus
negative framing. The recommendation question was identical to the one
described in Experiments 1 and 2.
Figure 3: The means of recommendation intentions as a function of framing and
the visual attribute representation (errors bar represent 1 standard error).
4.2 Results and discussion
Figure 3 presents the means of participants’ recommendation intentions
as a function of the attribute representation and framing. The
attribute framing effect sizes were small and not statistically
significant for both the single-outcome (Cohen’s d = 0.36;
t(73) = 1.56, p = .12), and the mixed (d
=-0.25; t(72) = −1.07, p = .29) conditions. The
means show that positive framing slightly enhanced participants’
recommendation intentions relative to negative framing in the
single-outcome condition, while the mixed condition showed the
opposite effect.
A two-way ANOVA predicting the recommendation intentions from
attribute representation and framing revealed an interaction effect
that approached significance (F(1, 145) = 3.45, p =
.065). Neither the attribute framing effect (F(1, 145) =
0.11, p = .74) nor the effect of attribute representation
(F(1, 145) = 1.07, p = .30) was significant. These
results suggest that, when mixed verbal representation was accompanied
by visual presentation, the framing bias was too small to be
statistically significant.
5 General discussion
Is a picture worth a thousand words? The findings of this research join
previous findings in suggesting the answer is—not
always; rather it depends on the words and the picture used.
Whereas some visual aids may attenuate or even eliminate the framing
bias, some may elicit a bias similar to the conventional verbal framing bias.
In this series of experiments we manipulated both the verbal and
visual presentation of the critical attribute in order to examine
their relative contribution to the attenuation of the attribute
framing bias. Only negligible attenuation was observed when verbal
description of a single outcome was accompanied by a corresponding
single outcome graphical presentation (Experiment 1). Similarly,
negligible attenuation was obtained when no visual aids were used and
the verbal description included both the positive and negative
outcomes of the critical attribute (Experiment 2). Attenuation was
obtained when mixed presentation in the verbal description was
accompanied by single outcome graphical presentation, and attribute
framing was totally eliminated when mixed presentation was used both
in the verbal description and in the graphical display. These results
demonstrate that two factors affect framing bias: Supplementing the
verbal description with a visual aid, and representing the critical
attribute by one or two outcomes.
With respect to the first factor, previous studies indicated that visual
aids presenting the numerical information attenuated framing bias
(Garcia-Retamero & Cokely, 2011; Garcia-Retamero & Galesic, 2010; Sun et al.,
2012). A possible theoretical explanation for this attenuation was that visual
display of numerical information may reduce biases in judgment and decision
making because visual presentations are more concrete, and therefore, easier to
understand (Gigerenzer et al., 2007). Indeed, Garcia-Retamero and Galesic
(2010) showed that visual aids are more effective in attenuating framing bias
for people with low numeracy. It seems, however,
that visual aids do not always attenuate the framing bias to
the same extent. Garcia-Retamero and Galesic (2010) used different types of
graphical presentation such as icon array, horizontal bar graphs, vertical bar
graphs and pie charts (see Figure 1 in Garcia-Retamero & Galesic, 2010) and
found that the different graphical presentations attenuated attribute framing
bias to varying degrees. The current findings further suggest
that the visual representation of one versus two
outcomes affects the attenuation of framing bias. Using conventional
single-outcome verbal framing, we found in Experiment 1 only marginal
attenuation whereas Garcia-Retamero and Galesic (2010) found significant
attenuation. These different results can be attributed to the differences in
the visual aids used. Whereas we used a single-outcome graphical presentation
that represented either the positive or negative outcome of the critical
attribute, Garcia-Retamero and Galesic (2010) used an identical graphical
presentation for the positive and negative framing conditions.
An additional factor that could attenuate framing bias is attribute
representation: does the verbal description represent the positive, the
negative or both outcomes? Previous studies of framing bias typically
represented only a single outcome of the critical attribute. The few studies
that used a mixed representation did not find conclusive results. One of the
few studies that examined mixed representations in the context of attribute
framing was the study of Bigman et al. (2010). Since they did not find the
conventional framing bias with regard to recommendation intentions, it is not
possible to draw conclusions about the effect of mixed representation on the
attenuation of the framing bias and to compare these findings to ours. Further
research is needed to clarify whether mixed presentation of the positive and
negative outcomes attenuates framing bias and to what extent. Our results
suggest that merely presenting one frame before the other is sufficient to
cause considerable framing bias, consistent with a theoretical explanation of
the primacy effect. If future research replicates our results, the use of a
mixed representation in verbal description in order to prevent framing bias
might be questionable.
Previous studies examined either the effect of visual aids or the effect of
verbal mixed representation on framing bias. Critically, our research
manipulated both factors and the results indicate that the effect of visual
aids interacts with attribute representation (single-outcome versus mixed). We
succeeded in eliminating attribute framing bias only when both verbal and
visual presentations represented both outcomes of the critical attribute. This
interaction could be explained by Levin et al.’s (1998) Association Theory.
According to Levin et al. (1998), the positive and negative framing would evoke
positive and negative associations respectively. Representing only one outcome
of the critical attribute either verbally or visually evokes highly polarized
associations in the different framing conditions. In contrast, representing
both the positive and negative outcomes evokes less polarized associations. Our
results suggest that when both the verbal and the visual presentations include
a mixed representation of the critical attribute, the polarization is
eliminated.
The findings of this research have important practical implications. Unlike
previous studies, we demonstrated that visual aids might not always attenuate
framing bias, but rather the attenuation depends on whether a single or mixed
attribute representation is used. There are contexts in which one would wish to
refrain from affecting people’s judgment and decision making for ethical or
other considerations. For example, medical authorities need to supply patients
and their families with information about the success and failure rates of
medical intervention in order to enable them reach an informed decision. The
framing literature repeatedly demonstrated the possible effect of presenting
either the success or failure rates on people’s judgment and decision making.
This research showed that using verbal descriptions of both success and failure
in either order, accompanied by graphical display of the two possible results,
can prevent attribute framing bias. It is interesting to note that previous
studies that used various types of identical graphical presentation for the
positive and negative framing succeeded in reducing attribute framing bias, but
did not eliminate it altogether (Garcia-Retamero & Galesic, 2010), possibly
because they used verbal description of a single outcome. Our findings suggest
that total elimination of attribute framing bias requires verbal mixed
representation of both positive and negative outcomes along with graphical
display representing the two complementary outcomes.
Future studies could further explore the possible attenuating effects of
single-outcome versus mixed presentation of both verbal and visual display
modes using different graphical display of the data. In this research we used
pie-charts, which to some extent imply the complementary outcome of the
critical attribute even when it is outlined by faded contours. Future research
could examine whether the use of other graphical displays that convey the
complementary outcome to a lesser extent (e.g., bar charts) or to a higher
extent (e.g., pie charts presenting the complementary outcome in a manner that
is in-between the two modes used in this research—faded and green contours)
would influence framing effect size. We predict that the former presentation
would increase framing effect sizes while the latter would attenuate them
relative to the display used in this research (e.g., in Experiment 1).
Additional future studies are needed in order to examine possible moderation of
visual display on other types of framing effects such as goal framing and
message framing. On a broader scale, the knowledge that would be gained from
the attenuating effect of visual aids on framing bias could be further
generalized to other contexts of biases in judgment and decision making.
6 References
Abed, F. (1991). Cultural influences on visual scanning patterns.
Journal of Cross-Cultural Psychology, 22, 525–534.
Bigman, C. A., Cappella, J. N., & Hornik, R. C. (2010). Effective or
ineffective: Attribute framing and the human papillomavirus (HPV)
vaccine. Patient Education and Counseling, 81, S70-S76.
Frisch, D. (1993). Reasons for framing effects. Organizational Behavior
and Human Decision Processes, 54, 399–429.
Gallagher, K. M., & Updegraff, J. A. (2012). Health message framing effects on
attitudes, intentions, and behavior: A meta-analytic review. Annals of
Behavioral Medicine, 43, 101–116.
Garcia-Retamero, R., & Cokely, E. T. (2011). Effective communication of risks
to young adults: Using message framing and visual aids to increase condom use
and STD screening. Journal of Experimental Psychology: Applied, 17,
270-287.
Garcia-Retamero, R., & Galesic, M. (2010). How to reduce the effect of framing
on messages about health. Journal of General Internal Medicine, 25,
1323-1329.
Gigerenzer, G., Gaissmaier, W., Kurz-Milcke, E., Schwartz, L. M., & Woloshin,
S. (2007). Helping doctors and patients make sense of health
statistics. Psychological Science in the Public Interest, 8, 53–96.
Keren, G. (2010). On the definition and possible underpinnings of framing
effects: A brief review and a critical evaluation. In G. Keren (Ed.),
Perspectives on framing (pp. 3-33). New York: Psychology Press.
Kurz-Milcke, E., Gigerenzer, G., & Martignon, L. (2008). Transparency in risk
communication. Annals of the New York Academy of Sciences, 1128,
18-28.
Levin, I. P., & Gaeth, G. J. (1988). How consumers are affected by the framing
of attribute information before and after consuming the product.
Journal of Consumer Research, 15, 374–378.
Levin, I. P., Schneider, S. L., & Gaeth, G. J. (1998). All frames are not
created equal: A typology and critical analysis of framing effects.
Organizational Behavior and Human Decision Processes, 76, 149–188.
Nachshon, I., Shefler, G. E., & Samocha, D. (1977). Directional scanning as a
function of stimulus characteristics, reading habits, and directional
set. Journal of Cross-Cultural Psychology, 8, 83–99.
O’Connor, A. M. (1989). Effects of framing and level of probability on patients’
preferences for cancer chemotherapy. Journal of Clinical Epidemiology,
42, 119–126.
O’Connor, A. M. C., Boyd, N. F., Tritchler, D. L., Kriukov, Y., Sutherland, H.,
& Till, J. E. (1985). Eliciting preferences for alternative cancer drug
treatments the influence of framing, medium, and rater variables.
Medical Decision Making, 5, 453–463.
Piñon, A., & Gambara, H. (2005). A meta-analytic review of framing effect:
Risky, attribute and goal framing. Psicothema, 17, 325–331.
Rothman, A. J., & Salovey, P. (1997). Shaping perceptions to motivate healthy
behavior: The role of message framing. Psychological Bulletin, 121,
3-19.
Sun, Y., Li, S., Bonini, N., & Su, Y. (2012). Graph-framing effects in decision
making. Journal of Behavioral Decision Making, 25, 491–501.
Tversky, A., & Kahneman, D. (1981). The framing of decisions and the psychology
of choice. Science, 211, 453–458.