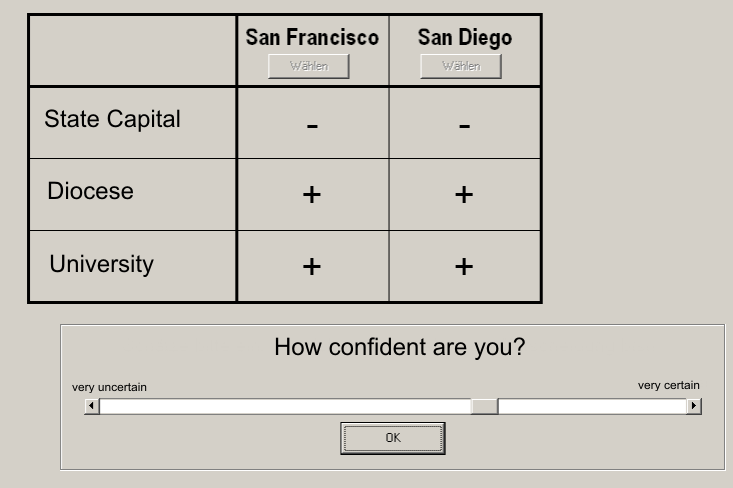
| Figure 1: Decision task. |
Judgment and Decision Making, vol. 6, no. 1, January 2011, pp. 23-42
Processing of recognition information and additional cues: A model-based analysis of choice, confidence, and response timeAndreas Glöckner* Arndt Bröder# |
Research on the processing of recognition information has focused on testing the recognition heuristic (RH). On the aggregate, the noncompensatory use of recognition information postulated by the RH was rejected in several studies, while RH could still account for a considerable proportion of choices. These results can be explained if either a) a part of the subjects used RH or b) nobody used it but its choice predictions were accidentally in line with predictions of the strategy used. In the current study, which exemplifies a new approach to model testing, we determined individuals’ decision strategies based on a maximum-likelihood classification method, taking into account choices, response times and confidence ratings simultaneously. Unlike most previous studies of the RH, our study tested the RH under conditions in which we provided information about cue values of unrecognized objects (which we argue is fairly common and thus of some interest). For 77.5% of the subjects, overall behavior was best explained by a compensatory parallel constraint satisfaction (PCS) strategy. The proportion of subjects using an enhanced RH heuristic (RHe) was negligible (up to 7.5%); 15% of the subjects seemed to use a take the best strategy (TTB). A more-fine grained analysis of the supplemental behavioral parameters conditional on strategy use supports PCS but calls into question process assumptions for apparent users of RH, RHe, and TTB within our experimental context. Our results are consistent with previous literature highlighting the importance of individual strategy classification as compared to aggregated analyses.
Keywords: parallel constraint satisfaction, probabilistic inferences,
recognition, strategy classification, decision time, confidence.
Imagine you visit a nice conference in southern France. Your presentation was successful and you want to reward yourself with a good wine. You are offered a Château Teyssier and a Château Margaux. The waiter presents you both bottles. You have not tried the wines before but you remember having heard of Château Margaux. The offered 2001 Château Teyssier is from St. Emilion, and has a Grand Cru classification. The Château Margaux is from the Medoc, has a Premier Cru classification and is from 2004. How would you predict which wine you will like better? A simple strategy would be to select the wine you recognize. Alternatively you might compare the bottles on the available cues in a stepwise manner, starting, for instance, with the region and instantly choose the Château Teyssier because you know that wine from the St. Emilion region usually meets your preferences. Or you could weigh all pieces of information against each other, taking into account their importance and also their constellation. You might quickly come up with a consistent interpretation for all pieces of information: although Château Margaux has an outstanding classification and is well known, it would be suboptimal to drink such a wine so early. The Château Teyssier is clearly preferable because it comes from an excellent region, has a good classification and has been sufficiently matured.
In this paper we investigate how recognition information is processed and integrated with other available cue information in such decisions.1 Particularly, we compare whether people apply simple noncompensatory strategies like the two strategies known as recognition heuristic (RH, as applied to the situation with known cue values), the take the best heuristic (TTB), and an enhanced version of RH which combines them (RHe); or whether people alternatively rely on more complex partially automatic processes that generate consistent interpretations, referred to as a parallel constraint satisfaction (PCS) strategy. Most previous research on processing recognition information has focused on testing for or against the RH. This is one of the first studies (see also Marewski, Gaissmaier, Schooler, Goldstein, & Gigerenzer, 2010) that compare different strategies and which in addition contains a fine-grained analysis of the underlying process models taking into account choices, decision times and confidence ratings simultaneously.
Goldstein and Gigerenzer (1999, 2002) formulated the RH as a noncompensatory rule, claiming that no additional probabilistic cues are searched for when recognition allows for deciding between two objects in a domain with high validity of the recognition information. This notion fits within a framework that postulates “fast and frugal” decision making which uses efficient and resource-saving rules of thumb for inferences. However, the empirical prediction of noncompensatory use of recognition information in decision making has raised some controversy, and Goldstein’s and Gigerenzer’s (2002) initial empirical demonstration was criticized on methodological grounds (see Bröder & Eichler, 2006; Newell & Shanks, 2004; Pachur, Bröder, & Marewski, 2008; Richter & Späth, 2006). It has also been argued that several assumptions underlying the recognition principle and fast and frugal heuristics in general are psychologically implausible from the viewpoint of cognitive psychology (Dougherty, Franco-Watkins, & Thomas, 2008). Furthermore, a bunch of studies challenged RH and found support for the processing of additional cues beyond recognition in situations where the RH could have been used (Bröder & Eichler, 2006; Hilbig & Pohl, 2008, 2009; Newell & Fernandez, 2006; Newell & Shanks, 2004; Oppenheimer, 2003; Pachur, et al., 2008; Pohl, 2006; Richter & Späth, 2006). All studies acknowledge that recognition information heavily influences decisions if it is valid, but they also suggest that it is integrated with additional cue knowledge to draw probabilistic inferences. Hence, the picture emerges that subjective recognition information is treated like other evidence and integrated in a compensatory fashion. This influence of a metacognitive cue (recognition) on decisions is in itself a noteworthy empirical finding, regardless of the additional (and probably mistaken) claims of its noncompensatory use.
However, Pachur et al. (2008) in turn identified potential criticisms of some of the above-mentioned studies, criticisms they tried to avoid in their experiments, particularly in their Experiment 3, where they used a domain with high recognition validity and pre-existing recognition and cue knowledge of subjects (see Pachur et al., 2008, for a discussion of these variables). Although these authors therefore created perfect conditions for applying the RH in this experiment, additional cue information was shown to affect the decisions at the group level, thus again challenging the claim of noncompensatory processing. However, when they broke down their analysis to the individual-subject level, the choices of about 50% of subjects were strictly in accordance with the RH. If compatibility of choice predictions and choices (i.e., the so-called adherence rate) is used to infer the strategy, a large proportion of subjects would thus be classified as genuine noncompensatory RH users.
However, it is still unclear whether these subjects actually used the RH for decision making. Hilbig and Pohl (2008; see also Hilbig, 2010) convincingly argued that the fit of choices with predictions alone might be an insufficient indicator of noncompensatory cue use since additional cue information might have been processed anyway. If the subjective weights of this information were not sufficient to jointly overrule the impact of recognition information, the resulting choices would still be consistent with RH despite the processing of multiple cues. Data on choice outcome alone cannot readily distinguish between two different processing models that predict the same choices. Hilbig and Pohl (2008; see also Pachur & Hertwig, 2006; Pohl, 2006) invented a very clever way to prove the use of additional cue information based on outcome data alone: Their “discrimination index” (DI) compares the proportion of RH-consistent choices for cases in which RH is correct with the proportion of RH choices if the heuristic fails. Any reliable difference clearly signifies that additional information must have been processed, and the index can be assessed individually. This sophisticated reasoning is a major progress, but still, a DI of about zero (apparently consistent with RH) may result if subjects consulted additional knowledge that is simply not valid. Hence, the index may still overestimate the proportion of “true” RH users who do not consider other information besides recognition, and it would be worthwhile to include predictions about other dependent variables that might allow for differentiating various process models empirically.
An important step in this direction was done by Hilbig and Pohl (2009), who found that individuals’ response time was not related to the number of steps necessary to perform the RH. In contrast — and in line with the predictions of PCS models (Glöckner & Betsch, 2008b; Holyoak & Simon, 1999; Thagard & Millgram, 1995) as well as other information integration models (Busemeyer & Johnson, 2004; Busemeyer & Townsend, 1993) — it was found that on average response times increased with decreasing advantage of the evidence speaking for the favored option as compared to the evidence for the non-favored option. However, Hilbig and Pohl’s (2009) investigation did not classify strategies on the individual level.
In another approach, Hilbig, Erdfelder and Pohl (2010) recently developed a formal measurement model to assess how often the RH was truly used, that is, the proportion of cases in which subjects relied on recognition alone. This multinomial processing tree model (Batchelder & Riefer, 1999; Erdfelder, et al., 2009) provides a better measure of RH use and can also be applied at the individual level to classify subjects as users or non-users of the RH. However, it does not provide information on which alternative strategies may have been applied by the non-users. Also, it does not take response times or confidence ratings into account and therefore will still tend to overestimate the usage of RH.
Hence, different methods may overestimate RH use, but to different degrees. While an undifferentiated use of adherence rates is generally problematic (Hilbig, 2010), the DI and the multinomial processing tree model are much less prone to overestimation and have particular merits in situations in which tight experimental control is not possible (i.e., in situations in which controlling the cues, cue values, and cue validities available to decision makers is impossible). In these situations the method used in the current study (see below) cannot be applied.
All the above-mentioned approaches except Marewski et al. (2010) focus on testing against the RH as the null hypothesis and show more or less severe deviations from it. Thereby, individual differences in strategy use are rarely taken into account (but see Hilbig, 2008; Marewski, et al., 2010; Pachur, et al., 2008), and no specific alternative models are provided (but see Marewski, et al., 2010). This state of affairs is unsatisfactory. In this paper we go beyond testing against the RH, which has been shown not to account for all data. We test an enhanced version of RH (i.e., RHe) against other specific process models for how recognition information is integrated with explicitly provided cue information. In our approach, we take into account potential individual differences by classifying strategies on an individual level, and we simultaneously analyze multiple dependent measures for strategy classification.
Overall, we take a four step analytical approach: first, for comparative reasons, we descriptively analyze aggregated choices, decisions times, and confidence ratings; second, we apply a choice based strategy classification (Bröder & Schiffer, 2003a) testing multiple models simultaneously; third, we extend strategy classification by simultaneously taking into account choices, decision time and confidence using the method of Glöckner (2009) which uses more behavioral information for classification and reveals potential overestimations of RHe use; and fourth, we analyze the fit of confidence and decision time predictions to the data conditional on strategy use in order to make a fine-grained analysis of the considered process models as suggested by Glöckner (2009). The RHe is defined in the next section.
In the following, we will briefly describe the two strategy classification methods used as well as a set of potential process models which we consider as competitors. Then we discuss some methodological requirements that are necessary for conducting strategy classification. Finally, we report an experiment using the city size task, eliciting not only choices but also decision times and confidence ratings, which are then used to distinguish amongst different process models at the individual level using the four step analytical approach described above.
Bröder and Schiffer (2003a) developed a simple outcome-based classification method for individual strategies which, in a nutshell, identifies the strategy from a predefined set for which the observed choice data are most likely, given a to-be-estimated probability of response errors. The application of the model hence requires the prediction of different choice patterns by each strategy. Often, however, strategies will show a tremendous overlap of choice predictions. Strictly speaking, a noncompensatory choice vector as predicted by RH, RHe or TTB can also be generated by a weighted additive process (WADD) if the weights are chosen appropriately (see Martignon & Hoffrage, 1999). Compensatory decision making mimicking WADD choices, on the other hand, can be achieved by very different processes, such as deliberate calculations or by automatic processes like sequential evidence accumulation as described in decision field theory (Busemeyer & Townsend, 1993) or by activation spread in a network as assumed by PCS (Betsch & Glöckner, 2010; Glöckner & Betsch, 2008b; see also Glöckner & Betsch, 2008c). Hence, choice outcomes alone are not always sufficient for discriminating between different process models. This problem has been outlined above with respect to RH.
Fortunately, however, many strategies are formulated as process models that allow for additional predictions, for example concerning response times or confidence ratings. Hence, with the addition of two data dimensions, many more options for disentangling the models become available. Glöckner (2009, 2010) extended the maximum likelihood approach to handle the additional data dimensions and to classify strategies based on empirical choice vectors, response time vectors and confidence judgment vectors simultaneously (called MM-ML for multiple-measure maximum likelihood). Since response times cannot be predicted precisely by any heuristic (due to idiosyncratic speed variations), the method relies on within-subject contrasts of different item types that predict varying response times and/or confidence judgments. These can be coded as contrast weights. For details on the method, application examples, and instructions of implementation, we refer the reader to Glöckner (2009, 2010; see also Jekel, Nicklisch, & Glöckner, 2010). In model recovery simulations the MM-ML method has been shown to be unbiased and more efficient than previously used methods (Glöckner, 2009).
One prerequisite for strategy classification with MM-ML is the formulation of a strategy set that covers the most plausible candidates for a given inference situation. According to previous findings, one should consider models for noncompensatory and compensatory use of recognition information in probabilistic inferences (here, a city size task). We therefore chose to compare the following competitors: RHe, TTB, and two variants of a PCS model.
Enhanced recognition heuristic and take-the-best heuristic. The extended variant of RH tested here relies on recognition information exclusively if it discriminates in a binary choice. However, instead of guessing in the other cases, the model assumes that subjects follow a TTB strategy according to the subjective cue validity hierarchy they expressed in the experiment. This so-called RHe heuristic has the advantage to be applicable also in cases where both objects are recognized and to exploit the power of TTB to increase accuracy. It is equivalent to Gigerenzer’s and Goldstein’s (1996) fast and frugal TTB heuristic which entails the recognition principle. Therefore, we think that RHe is a natural fast and frugal extension of RH in the spirit of the adaptive toolbox. RHe can be compared to other strategies across all decision tasks rather than only the subset of so called RU (Recognized vs. Unrecognized) cases with only one of two objects recognized. However, we will also report model comparisons with the original RH only for the RU cases to show that our conclusions do not hinge on this extension.
Subjects applying a noncompensatory strategy might, however, not always use recognition information as the most valid cue as suggested by RH. Therefore we additionally implemented TTB by assuming that subjects used the cue validity hierarchy expressed by them in a post-test, including recognition information as one of the cues. They search the cues in decreasing validity order and stop search when a discriminating cue is found. Note that RHe and TTB are indistinguishable if a subject judged the recognition cue to be the most valid one, which was, however, only sometimes the case (31%). Response time predictions are easy to derive from both strategies assuming sequential cue search: The more cues are looked up, the longer the decision should take (see Bröder & Gaissmaier, 2007; Glöckner, 2001). Put differently, RHe and TTB make the same processing time predictions for tasks in which a certain number of cues (e.g., only one cue) has to be considered to differentiate between the options due to the fact that the same cognitive operations are applied (cf. Payne et al., 1988).
The sequential nature of heuristic processing has repeatedly been highlighted by many proponents of the fast and frugal heuristics approach (e.g., Gigerenzer & Goldstein, 1999, p. 79; Goldstein & Gigerenzer, 1999, p. 57; Martignon & Hoffrage, 1999, p. 137) and consequently, heuristics are assumed to be fast because they are frugal. This is also assumed for the RH (Pachur & Hertwig, 2006, p. 986; p. 989). Hence, although concrete implementations in various cognitive architectures may alter very specific aspects of the predictions due to model-specific constraints, we take as a starting point the obvious predictions that can easily be generated by taking the often-claimed seriality assumption seriously.2
Confidence predictions for TTB are explicitly stated in Gigerenzer, Hoffrage, and Kleinbölting’s (1991) theory of probabilistic mental models, which states that the cue validity of the cue on which the inference relies is given as a confidence rating. Hence, confidence ratings were predicted to correspond to the stated subjective cue validity of the differentiating cue.3 We extended this principle to RH and RHe as well.
Parallel Constraint Satisfaction models. The PCS model was developed by Glöckner and Betsch (2008b) based on previous work on connectionist networks (e.g., Holyoak & Simon, 1999; McClelland & Rumelhart, 1981; Monroe & Read, 2008; Read, Vanman, & Miller, 1997; Thagard & Millgram, 1995) and describes the decision process as an automatic increase of mutual consistency between a choice and the cue information by means of spreading activation in a network. Cues as well as options have activations that are changed over time depending on information input and the strength of links between cues and options which reflect cue predictions. Importantly, there is mutual inhibition of activation between options which is essentially a contrast-enhancing mechanism (see also Montgomery, 1989; Svenson, 1992). A “general validity” node, which reflect prior beliefs about cue validities, has connections to each cue node. When cue information is fed into the network, activation will spread bidirectionally, and the network will finally settle in a stable state with a differential activation of the options. The choice prediction of the network corresponds to the most activated option; the time prediction corresponds to the number of iterations necessary for settling in a stable consistent representation; and confidence predictions correspond to the difference between the activations of different options (see Appendix A for details). All cue information is considered simultaneously and in a compensatory manner, so choice predictions do not necessarily differ from those of deliberate compensatory strategies. However, the model predicts a unique response time pattern which is not predicted by a deliberate weighted additive strategy.
Appendix A reports in detail how the predictions for choice, decision time and confidence were derived from the competitors. We modeled the decision process on an individual level by applying each of the four considered strategies to the specific cue-information and cue-validities of each single person in each decision. This resulted in 3 (i.e., choice [A/B]; time [contrast value]; confidence [contrast value]) x 120 (i.e., number of decision tasks) prediction values per person and strategy. Note that the predictions concerning decision time comprise no absolute decision times (i.e., the decision A vs. B will take 2.5 sec) but only contrast predictions (e.g., for PCS: A vs. B = 200 iterations, A vs. C = 150 iterations, C vs. D = 100 iterations; interval-scale level is assumed). The same holds true for confidence predictions.
We used two different variants of PCS here (PCS1 and PCS2), which differ only in the transformation function used to model subjects’ prior beliefs about cue validities from their expressed subjective validities (i.e., cue usage). PCS1 assumes a simple linear transformation, whereas PCS2 uses a quadratic transformation, which would reflect an accentuation of differences between cues (see Appendix A for details). We used two versions of PCS to avoid complex model fitting of individual transformation parameters in PCS but nevertheless to put noncompensatory and compensatory strategies at the same footing (i.e., using two strategies each).4
Recent findings indicate that choices, decision time and confidence in probabilistic inferences (Glöckner, 2008; Glöckner & Betsch, 2008c; Glöckner & Hodges, in press) and risky choice tasks (Glöckner & Betsch, 2008a; Glöckner & Herbold, 2011) are well in line with the predictions of the PCS model. Considering these findings, the decision time findings (Hilbig & Pohl, 2009) and findings concerning arousal (Hochman, Ayal, & Glöckner, 2010) in line with PCS but in conflict with RH and the further challenges to RH mentioned above, we expected PCS to account better for judgments incorporating recognition information than RH and even RHe.
As introduced above, in this paper we attempt to identify the different strategies used for integrating recognition information and further cues on an individual level. This requires that precise and differentiating predictions are derived. The information that subjects might use has to be thoroughly controlled and decision tasks have to be selected that differentiate between strategies. For our research goal it is of course also essential to use real recognition information and a domain in which recognition is a valid cue. We asked subjects to select the larger of two cities and used real cities with cue patterns5 for which sufficiently divergent predictions of the considered strategies could be expected. To have control over the information that might be used, cue information for known and unknown cities was presented to the subjects.
There have been extended debates about methodological details in investigating fast and frugal heuristics in general and the RH specifically (Bröder & Schiffer, 2003b; Hilbig, 2010; Pachur, et al., 2008) and a number of conditions have been put forward that — according to proponents of fast and frugal heuristics — are necessary for a fair test of these models. Taken together, these requirements make it hard to test the prevalence of RH against other models. For instance, it was postulated that only natural cue information should be used which means that one should rely only on the information that people already have about the cities before coming to the experiment (Pachur, et al., 2008). Because further cue knowledge is conditional on knowing the city (i.e., you have to know the city before you can know more about it) and because people are likely to encode and generate mainly positive cue values (Dougherty, et al., 2008) this implies that all reasonable strategies often make the same predictions for all choices. Hence, decision strategies cannot be differentiated, and even perfect individual adherence rates with RH (e.g., Pachur, et al., 2008; observed for half of the subjects) do not provide conclusive (if any) evidence whether RH was used or not (Hilbig, 2010). Restricting empirical tests to these circumstances will make it hard to derive clear contrasting predictions from different models. In a first attempt to do so, several strategies were developed that are testable also under these circumstances (Marewski, et al., 2010). These strategies comprise the use of other cues that are available for the known (i.e., recognized) option and that override the recognition cue in decisions between recognized and unrecognized cases.
Using a different approach, in this study we focused on a situation where the recognition cue was valid and natural, whereas additional cue information was provided by the experimenter. This allows deriving clear contrasting predictions from the models. We are aware that our conclusions may not generalize to situations in which cue information is not provided and inferences must be made from memory, because the RH is very likely more useful in these situations. Here, as a reasonable first step, we prefer a maximum of experimental control. Arguably, the differences between studies that respect all methodological caveats (e.g. Study 3 of Pachur et al., 2008) or not (e.g., Bröder & Eichler, 2006; Newell & Shanks, 2004) seem to be a matter of degree rather than category. In addition, as our introductory example shows, inference situations in which recognition is relevant whereas cues are provided (even for the unrecognized object) may be quite common. They, for instance, prevail in most buying situations, in which only some of the products are known and further information concerning price and quality of all products is provided (as in supermarkets and Web sites for shopping).
We expected to replicate the finding that additional cue information beyond the recognition cue has an effect on choices. More specifically, according to previous findings we expected that at the individual level, a PCS model will better capture the actual strategy of subjects than RH/RHe and TTB (H1). According to findings supporting decision time and confidence predictions of PCS in contrast to that of RH (Hilbig & Pohl, 2009; Hochman, et al., 2010), it was furthermore assumed that the estimated proportion of PCS users increases if decision time and confidence ratings are taken into account in addition to mere choices (H2). Furthermore, we investigated fits of decision times and confidence for different strategies in a more fine-grained manner. Specifically, we tested the undirected hypothesis whether there is a difference in fit for supposed users of the different strategies (H3). A low conditional fit would put process assumptions of the respective strategy into question. Finally, we aimed to explore which problems and misinterpretations can arise if data are analyzed at the group level rather than the individual level.
We investigated the use of recognition information in inferences from givens and particularly the underlying processes using decision time and confidence as additional dependent measures. In an incentivized task, subjects decided repeatedly which of two American cities has more inhabitants, approximately half of them being known and half of them being unknown as determined by a pilot study. For this decision they were provided with additional cue information about the cities.
Subjects and design. Eighty-three students of different subjects from the University of Erfurt took part in the experiment (62 female, mean age 21.6 years). The experiment lasted about 20 minutes and was part of an experimental battery with another unrelated study. In addition to a participation fee for the battery of on average 6 Euro they received between 0.15 Euro and 1.15 Euro performance-contingent payments for the study. No between-subjects manipulation was used but the structure of the decision task was manipulated within subjects (see below).
Figure 1: Decision task.
Materials. In a pilot study (n = 48) we selected 8 mid-size US-American cities between 50.000 and 300.000 inhabitants which were mainly known or mainly unknown, respectively.6 The cities were selected so that they had specific properties concerning the considered cues in this study which were: a) is the city a state capital or not? b) is the city a diocese / has it a bishop or not? c) has the city a major university (with more than 4000 students) or not? Cities were selected so that they represented all eight possible (i.e., 23) cue combinations for known cities as well as for unknown cities. The resulting 16 cities (see Appendix B, Table B1) were all compared to each other in the main experiment, resulting in 120 decision tasks.
Procedure. Subjects were informed that they should make decisions concerning which of two US-American cities has more inhabitants and that they would receive 2 Cents for each correct answer and loose 1 Cent for each wrong answer. The three cues and the presentation format were introduced (Figure 1). Additionally they were told that in case there are different US cities with the same name, the larger one is referred to. Finally, they were introduced to the confidence measure which was presented after the decision and they were instructed to make good decision and to proceed as fast as possible. Then subjects solved a warm-up trial. If there were no more questions, subjects started working on the 120 decisions, which were presented in individually randomized orders. The presentation order of the two cities on each screen (i.e., left / right) was also randomized. Confidence was measured on a scale from very uncertain (−100) to very certain (100) using a horizontal scroll-bar. Choices were indicated by mouse click. Although this may create some noise in the reaction time data, we wanted to avoid subjects switching the input device. Decision trials were separated by a blank screen with a continue button in the centre of the screen. A pause screen announcing a voluntary 1-minute-break was presented after half of the tasks to reduce effects of decreasing attention.
After the choices were completed we measured subjects’ cue-usage and perceived cue-validity. First we asked subjects to indicate how much they relied on the three cues when making their decision and how much they relied on whether they knew the city before on a scale from not used (0) to very much used (100). Subjects indicated which of the four pieces of information (3 cues plus recognition of the city) predicts the size of US-cities best by bringing them in an order (i.e., assigning numbers between 1 and 4).7 Subjects were asked about their prior knowledge about the cities on a three point scale (1-unknown, 2-I knew the name, 3-I knew more than the name). Finally we measured estimations of cue-validities directly by asking subjects to indicate how many of 100 US-cities with the respective property are larger than cities without it for the three cues and recognition using a horizontal scroll-bar (scale: 50–100).
Manipulation check. We checked whether our manipulation of recognition was efficient. For the “unknown cities” (i.e., cities 1–8) across subjects we found that 74% of them were indeed unknown, for 25% the name was known and for 1% more than the name was known. For the “known cities” we found that 7% were unknown, for 61% the name was known and for 33% more than the name was known. Hence, our manipulation of city recognition as determined by the pilot study was highly effective. Each “unknown city” was unknown to the majority of the subjects and the reverse was true for the “known cities”.
Cue validity ratings and cue usage. Individuals’ explicated cue-hierarchies (according to the ordering of the predictive power of the information) were very heterogeneous. 49% subjects said that state capital is the best predictor, whereas 5%, 14%, and 31% indicated diocese, university, or recognition as most valid cue, respectively. A similar order was found in the numerical cue-validity ratings (in the same order with SE in parentheses): 82 (1.4), 62 (1.2), 79 (1.3), and 77 (1.6); and in the cue-usage rating: 70 (3.0), 31 (2.6), 69 (2.5), and 69 (3.1). Subjects were rather consistent in their answers to all three measures. Order of cues correlated highly negative with cue usage (MD(Rho)= −.80) and cue validity (MD(Rho)= −.80); and the latter also correlated highly with each other (MD(Rho)= .80).
Choices. To analyze at the group level whether recognition information is used in a noncompensatory manner and to provide a test for the “pure” RH we ran a logistic regression predicting choices for unknown cities when they were compared with known cities only (i.e., RU-cases). As predictors we used three variables that coded whether the respective probabilistic cue predicted in favor of the known city (1), or against it (−1), or was indifferent (0). If the known city, for instance, was a state capital and the unknown city was no state capital the variable was coded 1. Positive predictions on all three cues significantly increased the probability of choices for the known city (Table 1) indicating a compensatory integration of cues with the recognition cue which confirmed our expectations and former results in the literature. It clearly speaks against the application of the “pure” RH in cases in which recognition differentiates.8
Table 1: Logistic regression predicting choices for the known cities when compared with unknown cities by cues. Statistics are corrected for 83 clusters in observations due to repeated measurement (Rogers, 1993); all cues coded: 1=for known city, −1=against; 0=indifferent *** p < 0.001.)
Odds ratio z statistic Cue 1 (capital) 4.869*** (8.81) Cue 2 (diocese) 2.790*** (9.43) Cue 3 (university) 5.249*** (12.43) Observations 4775
Next, we analyzed the overall adherence rate of choice outcomes with strategy predictions. Therefore, we calculated predictions of RHe/RH, TTB, and the two versions of PCS (i.e., cue usage transformation linear=PCS1, quadratic=PCS2) for the decision tasks and compared the predictions with individual choices (Table 2).9 Overall, predictions of RH and RHe were least accurate. Predictions of TTB fit better, and PCS predicted actual choices best. This was found for all cases (i.e., RHe) as well as for RU-cases in which one city is recognized and the other one is not recognized (i.e., RH). Nevertheless, differences in aggregated prediction performance were rather small, except for the considerably worse performance of RH in RU-cases (see also Appendix, Figure B1). On the basis of similar data patterns it has been occasionally argued that simple noncompensatory models are better in describing individuals’ behavior than more complex compensatory models according to an Occams’ razor argument (e.g., Brandstätter, Gigerenzer, & Hertwig, 2006). We suspect that such conclusions might be wrong due to different aggregation artifacts. Just to mention a simple example: assuming that half of the people use strategy A, the other use strategy B which predict exactly opposite choices. Nobody uses strategy C which predicts choices half in line with A and half in line with B. Looking at the aggregates will show that strategy C predicts the data equally well as strategies A and B (i.e., 50% correct) although nobody used strategy C. As we mentioned above, it has also been convincingly shown on a more general level that adherence rates are not particularly informative concerning peoples’ strategy use (Hilbig, 2010).
Table 2: Adherence rates. Proportion of individual choices in line with strategy predictions (adherence rate) is indicated by p(correct). p(no pred) indicates the proportion of choices in which the strategy makes no predictions. RU-cases comprise only decisions in which one city was known and the other city was not known (48% of the cases). RH is only defined for RU-cases whereas RHe is defined for all cases. Both analyses are run for the same cases for all strategies. Adherence rates per subject are shown in Appendix B (Figure B4).
all cases (n=9960) RU-cases only (n=4775) p(correct) p(no pred) p(correct) p(no pred) RHe/RH 0.73 0.02 0.70 0 TTB 0.78 0.02 0.80 0 PCS1 0.79 0.03 0.81 0.002 PCS2 0.79 0.03 0.82 0.002
Decision time. Subjects followed the instruction and made rather quick decisions (M = 3039 ms, SD = 2284 ms, MD = 2310 ms, Skew = 2.7, Kurt = 15.6). To reduce skewness and the influence of outliers decision times were log-transformed for further analyses. To analyze at an aggregated level whether the time predictions of the different strategies fit with observed decision times, we conceptually calculated the average decision times for each decision task (e.g., average decision time for Tempe vs. Miami Beach; Tempe vs. Mobile, etc.) and correlated them with the average decision time prediction of the strategy for these tasks. Specifically, we analyzed time scores (i.e., time-residual after log-transformation and partialling out order effects) of all 120 decision tasks, averaged across subjects. We correlated the resulting 120 averaged prediction values per strategy with the averaged decision times for the respective decision tasks. The correlation was significant for PCS1 (r = .57, p < .001) and PCS2 (r = .39, p < .001) but not for TTB (r = .09, p = .34) and RHe (r = .02, p = .84) (see Appendix, Figure B2).10
Confidence. Overall, subjects indicated that they were not very confident in their decisions and showed high variance, M = 8.7, SD = 45.3 (scale: −100 to 100). To analyze whether confidence predictions of the different strategies fit the observed confidence measures, we calculated correlations between predictions and data after averaging for each of the 120 decision tasks across subjects (missing and zero predictions were excluded). The correlations for PCS1 (r = .62, p < .001) and PCS2 (r = .57, p < .001) turned out to be significant, and — although being considerably lower — so did the correlation for TTB (r = .19, p = .04), whereas the correlation for RHe (r = .11, p = .25) did not (see Appendix, Figure B3).
Figure 2: MM-ML Strategy Classification. Bars with labels containing multiple-strategy (e.g., “RHe/TTB”) indicate that behavioral data were equally likely for both strategies. 
To investigate strategies at an individual level, we first analyzed the data using the choice-based strategy classification method (Bröder, 2010; Bröder & Schiffer, 2003a). Results indicate a clear predominance of compensatory PCS models.11 For 63.75% of the subjects, choice patterns were best explained by PCS models, whereas for only 32.5% choice patterns were more in line with noncompensatory strategies. Hence there is support for our first hypothesis that PCS captured choice behavior of the majority of people better than noncompensatory models. The proportion of RHe users was small (between 5% and 13.75%; when interpreting all ties in probabilities as RHe users).
In a third step we analyzed the overall behavioral data simultaneously (i.e., choices, confidence, and response time) using the MM-ML strategy classification method outlined above (Glöckner, 2009, 2010). The test was done because MM-ML allows for a more efficient strategy classification. It provides a more precise estimate of strategy use and allows us to test our second hypothesis: with further dependent measures the predominance of PCS should increase and the number of potential users of noncompensatory strategies should decrease.
In line with our expectations, simultaneously considering choices, decision times and confidence in MM-ML leads descriptively to an increased classification of PCS users (77.5%) and fewer users of noncompensatory strategies (22.5%) (Figure 2). Our final estimate for usage of RHe in such situations is therefore 5%–7.5%.
In our study the pure choice-based strategy classification method seems to overestimate noncompensatory strategy use by about 10 percentage points as compared to MM-ML. However, the difference in noncompensatory vs. compensatory strategy use between analysis methods did not reach conventional significance levels, χ 2(N=157, df=1)=2.47, p = .12. Hence, we found only weak support for our second hypothesis.
The reliability of MM-ML strategy classification can be evaluated by inspecting error rates and likelihood ratios. We found that average estimated error rates for strategy application were rather low, except for RHe (Table 3). The Likelihood-ratios were high indicating a good reliability of strategy classification. For PCS2 the value was particularly lower which was due to the fact that PCS1 and PCS2 often made similar predictions.
Table 3: Strategy classification results MM-ML. N is the number of subjects classified as user of the respective strategy. p(error) indicates the average percentage of choices that deviated from the predictions of the respective strategy (considering supposed users of each strategy only). L-Ratio is the ratio of the likelihoods of the classified strategy divided by the likelihood of the second most likely strategy. High numbers indicate high reliability.
N p(error) SE MD(L-Ratio) RHe 4 .28 .02 274 TTB 12 .16 .03 427 RHe/TTB 2 .26 .05 70 PCS1 38 .19 .01 79 PCS2 24 .14 .01 4 not classified 3
When considering only PCS1 and comparing it against RHe and TTB, the proportion of PCS1 users was 73%. For PCS2 the proportion was 74%. Hence, when dropping either of the PCS strategy implementations from the analysis the former user of this strategy were almost all classified as user of the remaining PCS strategy. Hence, the general result seems to be largely independent of the specific assumptions about the form of the transformation function that relates subjective cue usage ratings to links in the mental representation networks.
Table 4: Fine-grained analysis of time and confidence predictions. p(time_sig) is the proportion of significant time contrasts for the respective strategy considering all subjects at p < .05; p(time_sig|strat use) is the same proportion for users of the respective strategy only. p(conf_sig) and p(conf_sig|strat use) are the respective proportions for confidence contrasts. MD(rtime) and MD(rconf) are median correlations of time and confidence contrasts with individuals’ data vectors (unconditional on strategy use).
RHe TTB PCS1 PCS2
Besides an overall measure of fit, the MM-ML method provides individual tests of whether the confidence and decision time predictions of the respective strategy contributed to explaining the data of each individual. These measures are relevant to our third hypothesis. They can be used to learn more about the underlying processes and to improve aspects of models (Glöckner, 2009). Specifically, within each MM-ML estimation for each person and each strategy, we can ask whether the contrast coefficients for time and confidence are significantly different from zero using a z-test (i.e., whether the coefficient contributes significantly to explain the data). We counted how often the time and confidence predictions of the respective strategies contributed to explaining the data of each individual at p < .05. We calculated overall proportions for all subjects and proportions conditional for people who (supposedly) used the respective strategy (Table 4). Considering all subjects, the time and confidence predictions of PCS turned out to be significant very often, whereas this was not the case for the RHe and TTB predictions. These results are in line with the aggregated analyses reported above. More importantly, even when looking only at the subjects who supposedly used the respective strategy (according to MM-ML), the proportion of significant time and confidence predictions of RHe and TTB remained rather low, whereas the proportions were very high for PCS. This result suggests that even for the few subjects who were classified as TTB and RHe users might not have used the processes suggested by the respective strategies, although their choices were mainly in line with these strategies. Note, that this result does not undermine the validity of the MM-ML method, it just indicates that the process assumptions of TTB and RHe should be rethought (Glöckner, 2009, p. 197). For both proportions p(time_sig) and p(conf_sig), χ 2-tests indicated that the observed differences in proportions of significant predictions were different between strategies, time: χ 2(3; N=324) = 65.6, p < .001, and confidence: χ 2(3; N=324) = 91.1, p < .001. This difference indicates that the fit of time and confidence predictions with the data conditional on strategy usage are higher for PCS than for RHe and TTB (cf. H3). To back this analysis up with more conventional measures of fit, we correlated confidence and time contrasts with the data for each person. Median correlations are reported in Table 4 (unconditional on strategy usage). The results clearly point in the same direction: the overall fit of decision time and confidence with the predictions by RHe and TTB is low whereas the correlation with the predictions of PCS is considerably higher.
In the current study we investigated the processing of recognition information and further provided cue knowledge. Specifically, we tested how well two versions of a compensatory PCS model can account for decision behavior when analyzing choices, decision times and confidence simultaneously, compared to RHe and TTB. We show that the large majority of subjects’ (77.5%) integrates information in a weighted compensatory manner as predicted by PCS. Decision times and confidence ratings of these subjects are well in line with the predictions of the PCS model. Only for a very small proportion of subjects’ (5%–7.5%) choice behavior can be explained with RHe, which assumes that recognition is a special cue that is always used first. Several subjects seemed to use a TTB strategy with recognition information being one of the cues (15%–17.5%). Hence, PCS accounts better for choice behavior of the majority of subjects than noncompensatory models in our experimental task.
A more fine-grained analysis of the considered process models was conducted by investigating the fit of predicted and observed decision time and confidence ratings separately for supposed users of the respective strategies. For PCS users the fit was high whereas it was rather low for RHe and TTB users. This indicates that RHe and TTB users’ strategy classification was mainly driven by the good fit of choices alone. The additional process assumptions of RHe and TTB therefore do not appear to describe the actual decision processes well.
Further research is needed to investigate alternative models (see Marewski, et al., 2010). One plausible assumption is that people may generally adopt the PCS mechanism, but they sometimes feed noncompensatory cue weights into it which mimics choices of noncompensatory rules (Glöckner & Hilbig, 2010).
As discussed above, most previous research on RH was not able to reliably detect how many people indeed used RH. When using an unbiased strategy classification method, particularly in contrast to methodologically problematic estimations based on average adherence rates of choices with RH-predictions, RH cannot account for subjects’ decision behavior. As we mentioned above, using a city-size paradigm, Pachur et al. (2008) found that for roughly 50% of the subjects choices were perfectly in line with RH-predictions. Considering the discussed methodological concerns and taking into account our findings, these results should not be interpreted as evidence for 50% RH users in the former study. According to our results, which include processing aspects, if RH is applied at all, its prevalence rate seems to be much lower.
Parts of the differences might, of course, be attributed to methodological differences. Whether our findings, for instance, generalize to situations in which cue information is retrieved from memory is an interesting question for further research. For example, Bröder and Schiffer (2003b; 2006) found more choices in line with a noncompensatory TTB strategy when information had to be retrieved from memory, and response times of presumable TTB users were in line with the predictions (Bröder & Gaissmaier, 2007). Also, Pachur et al. (2008) found a somewhat larger impact of additional cue knowledge when cues were explicitly provided rather than retrieved from subjects’ semantic memory. These results show that there may be processing differences due to memory retrieval or demand effects induced by experimenter-provided cues. Both factors may promote compensatory decision making and hence, the massive preponderance of PCS found in our task may be somewhat attenuated in other situations that demand cue retrieval from memory.
Nevertheless, if strategies are selected based on previous learning of their performance in a certain domain (Rieskamp & Otto, 2006), theoretically there should be no difference in strategy application between decisions from memory and decisions from givens. Assuming (close to) perfect memory, the strategies’ performance — and consequently also the result of strategy learning — is of course independent of whether information is acquired from memory or from a computer screen. We suspect that previously observed high adherence rates (e.g., 95% in Pachur et al., 2008, Exp. 3) might be mainly due to the fact that decision tasks were selected that were not diagnostic for RH use in that PCS and RH made the same predictions (Glöckner & Betsch, 2008a).
Our findings might at first glance appear to conflict with recent results of Marewski et al. (2010). As mentioned above, Marewski et al. developed several models in which naturally available cues for the known option were assumed to override the recognition cue and would lead to choices against recognition. For example, the weighted-fluency heuristic predicted that people find a known city to be smaller than an unknown city if recognition takes longer than a certain time threshold. The take-one-cue heuristic assumed that for the recognized option another cue is known and if the value of this cue is below/above a certain threshold people choose the unrecognized object. Marewski et al. (2010) found similar or higher adherence rates for RH as compared to these alternative models, concluding that the newly developed competitor heuristics performed worse than the RH. A closer look indicates that the results do not conflict with our findings. Although Marewski et al. also included simple compensatory models such as tallying-of-negative-cues into the comparison, they did not include a comprehensive weighted compensatory strategy in which all relevant pieces of information (including recognition) are integrated according to a weighted sum that would be comparable to PCS. Furthermore, the fact that the authors based their argument only on adherence rates might weaken their conclusions concerning RH use (Hilbig, 2010). The adherence rates observed in their third study, for instance, were similar to the ones in our experiment. Our results highlight that fact that even such relatively high adherence rates can be easily found if almost nobody uses RH. The problem is of course not unique for RH or RHe, and all conclusions concerning strategy use based on adherence rates only should be made cautiously. Furthermore, Marewski et al.’s observation of increased choices for the recognized object in decisions in which further cues supported the recognition cue was replicated in our study and is exactly what PCS and other compensatory models would predict, while RH would predict no influence (Hilbig, 2010; Pohl, 2006; but see Marewski, et al., 2010, for a different interpretation).
PCS has proven to be a good model to describe choices, decision times and confidence in city-size tasks with recognition knowledge. This result extends previous findings showing that PCS can account well for probabilistic inferences from memory (Glöckner & Hodges, in press) and from givens (Glöckner, 2008; Glöckner & Betsch, 2008c). The recognition cue and the other cues are integrated in a weighted compensatory manner, and the well-specified spreading activation processes assumed by PCS can capture these processes and choice outcomes well.
Our findings again highlight the problems of using aggregated data to evaluate process models and individual strategy use, especially if predictions from different models are confounded and cannot be teased apart with the method applied. This problem has been acknowledged for a long time (e.g., Estes, 1956). From the aggregated analyses of choices, one might have argued that TTB performs almost as well as the compensatory strategies in predictions and might be preferred as a model for the data because it is simpler (Gigerenzer & Goldstein, 1999). Our analysis of choice showed that, on an aggregated level, predictions of RH, RHe and TTB were largely supported, whereas individual analyses lead to the opposite results. Hence, considering choices on an aggregated level only, the conclusions from the data would have been blatantly wrong. This problem is hence relevant for studies of behavioral decision making, also of course for those who claim support for fast and frugal heuristics (e.g., Brandstätter, et al., 2006).
To put our findings in perspective, we admit that the recognition cue may still be one of the most powerful ones hitherto identified for certain inference tasks in which it is valid. Nevertheless, its power does not suffice to keep people from considering additional information (as suggested by Goldstein & Gigerenzer, 2002). The result of the inference process will sometimes “look” noncompensatory because subjects deliberately or automatically scale down the importance of the additional information, but obviously, they are not ignoring it as the choice and process data show.
One obvious limitation of the MM-ML method is that conclusions are restricted to the strategy set investigated. The best of a set of models is probably still not the “true” model. However, this weakness is inherent in most scientific endeavors that test sufficiently specific hypotheses against each other. Of course, subjects may also use other strategies or even mixes of strategies, but the classification will yield only the model fitting closest to behavior in terms of data likelihood. Hence, the strategy set might be improved qualitatively or quantitatively in the future.12
In this study we found that PCS is an appropriate model to account both for choices and underlying processes reflected in decision times and confidence judgments. Research on processing of recognition information should move away from merely testing against the RH and from testing decisions in the niche for which RH is assumed to be applied according to its’ proponents (e.g., memory-based decision with no further information provided; in RU-cases only). Further research should focus on testing more complex models using rigorous strategy classification methods, instead. With PCS we suggest such a model in this paper and encourage researchers to critically test against it.
Batchelder, W. H., & Riefer, D. M. (1999). Theoretical and empirical review of multinomial process tree modeling. Psychonomic Bulletin & Review, 6, 57–86.
Betsch, T., & Glöckner, A. (2010). Intuition in judgment and decision making: Extensive thinking without effort. Psychological Inquiry, 21, 279–294.
Brandstätter, E., Gigerenzer, G., & Hertwig, R. (2006). The priority heuristic: Making choices without trade-offs. Psychological Review, 113, 409–432.
Bröder, A. (2010). Outcome-based strategy classification. In A. Glöckner & C. L. M. Witteman (Eds.), Foundations for tracing intuition: Challenges and methods (pp. 61–82). London: Psychology Press & Routledge.
Bröder, A., & Eichler, A. (2006). The use of recognition information and additional cues in inferences from memory. Acta Psychologica, 121, 275–284.
Bröder, A., & Gaissmaier, W. (2007). Sequential processing of cues in memory-based multiattribute decisions. Psychonomic Bulletin & Review, 14, 895–900.
Bröder, A., & Schiffer, S. (2003a). Bayesian strategy assessment in multi-attribute decision making. Journal of Behavioral Decision Making, 16, 193–213.
Bröder, A., & Schiffer, S. (2003b). Take The Best versus simultaneous feature matching: Probabilistic inferences from memory and effects of reprensentation format. Journal of Experimental Psychology: General, 132, 277–293.
Busemeyer, J. R., & Johnson, J. G. (2004). Computational models of decision making. In D. J. Koehler & N. Harvey (Eds.), Blackwell handbook of judgment and decision making (pp. 133–154). Malden, MA: Blackwell Publishing.
Busemeyer, J. R., & Townsend, J. T. (1993). Decision field theory: A dynamic-cognitive approach to decision making in an uncertain environment. Psychological Review, 100, 432–459.
DeKay, M. L., Patino-Echeverri, D., & Fischbeck, P. S. (2009). Distortion of probability and outcome information in risky decisions. Organizational Behavior and Human Decision Processes, 109, 79–92.
Dougherty, M. R. P., Franco-Watkins, A. M., & Thomas, R. (2008). Psychological plausibility of the theory of probabilistic mental models and the fast and frugal heuristics. Psychological Review, 115, 199–211.
Erdfelder, E., Auer, T.-S., Hilbig, B. E., Aßfalg, A., Moshagen, M., & Nadarevic, L. (2009). Multinomial processing tree models: A review of the literature. Zeitschrift für Psychologie - Journal of Psychology, 217, 108–124.
Estes, W. K. (1956). The problem of inference from curves based on group data. Psychological Bulletin, 53, 134–140.
Gigerenzer, G., & Goldstein, D. G. (1996). Reasoning the fast and frugal way: Models of bounded rationality. Psychological Review, 103, 650–669."
Gigerenzer, G., & Goldstein, D. G. (1999). Betting on one good reason: The take the best heuristic Simple heuristics that make us smart (pp. 75–95). New York, NY: Oxford University Press.
Gigerenzer, G., Hoffrage, U., & Kleinbölting, H. (1991). Probabilistic mental models: A Brunswikian theory of confidence. Psychological Review, 98, 506–528.
Glöckner, A. (2001). The maximizing consistency heuristic: Parallel processing in human decision making. Unpublished Diploma Thesis, University of Heidelberg, Germany.
Glöckner, A. (2006). Automatische Prozesse bei Entscheidungen [Automatic processes in decision making]. Hamburg, Germany: Kovac.
Glöckner, A. (2008). Does intuition beat fast and frugal heuristics? A systematic empirical analysis. In H. Plessner, C. Betsch & T. Betsch (Eds.), Intuition in judgment and decision making (pp. 309–325). Mahwah, NJ: Lawrence Erlbaum.
Glöckner, A. (2009). Investigating intuitive and deliberate processes statistically: The Multiple-Measure Maximum Likelihood strategy classification method. Judgment and Decision Making, 4, 186–199.
Glöckner, A. (2010). Multiple measure strategy classification: Outcomes, decision times and confidence ratings. In A. Glöckner & C. L. M. Witteman (Eds.), Foundations for tracing intuition: Challenges and methods. (pp. 83–105). London: Psychology Press & Routledge.
Glöckner, A., & Betsch, T. (2008a). Do people make decisions under risk based on ignorance? An empirical test of the Priority Heuristic against Cumulative Prospect Theory. Organizational Behavior and Human Decision Processes, 107, 75–95.
Glöckner, A., & Betsch, T. (2008b). Modeling option and strategy choices with connectionist networks: Towards an integrative model of automatic and deliberate decision making. Judgment and Decision Making, 3, 215–228.
Glöckner, A., & Betsch, T. (2008c). Multiple-reason decision making based on automatic processing. Journal of Experimental Psychology: Learning, Memory, and Cognition, 34, 1055–1075.
Glöckner, A., Betsch, T., & Schindler, N. (2010). Coherence shifts in probabilistic inference tasks. Journal of Behavioral Decision Making, 23, 439–462.
Glöckner, A., & Herbold, A.-K. (2011). An eye-tracking study on information processing in risky decisions: Evidence for compensatory strategies based on automatic processes. Journal of Behavioral Decision Making, 24, 71–98.
Glöckner, A., & Hilbig, B. E. (2010). What is adaptive about adaptive decision making? Testing single- versus multiple-strategy models in probabilistic inference tasks. Manuscript submitted for publication.
Glöckner, A., & Hodges, S. D. (in press). Parallel constraint satisfaction in memory-based decisions. Experimental Psychology.
Goldstein, D. G., & Gigerenzer, G. (1999). The recognition heuristic: How ignorance makes us smart Simple heuristics that make us smart (pp. 37–58). New York, NY: Oxford University Press.
Goldstein, D. G., & Gigerenzer, G. (2002). Models of ecological rationality: The recognition heuristic. Psychological Review, 109, 75–90.
Hilbig, B. E. (2008). Individual differences in fast-and-frugal decision making: Neuroticism and the recognition heuristic. Journal of Research in Personality, 42, 1641–1645.
Hilbig, B. E. (2010). Reconsidering “evidence” for fast and frugal heuristics. Psychonomic Bulletin & Review, 17, 923–930.
Hilbig, B. E., Erdfelder, E., & Pohl, R. F. (2010). One-reason decision-making unveiled: A measurement model of the recognition heuristic. Journal of Experimental Psychology: Learning, Memory, & Cognition, 36, 123–134.
Hilbig, B. E., & Pohl, R. F. (2008). Recognizing users of the recognition heuristic. Experimental Psychology, 55, 394–401.
Hilbig, B. E., & Pohl, R. F. (2009). Ignorance- versus evidence-based decision making: A decision time analysis of the recognition heuristic. Journal of Experimental Psychology: Learning, Memory, and Cognition, 35, 1296–1305.
Hochman, G., Ayal, S., & Glöckner, A. (2010). Physiological arousal in processing recognition information: Ignoring or integrating cognitive cues? Judgment and Decision Making, 5, 285–299.
Hogarth, R. M. (2001). Educating intuition. Chicago, IL: University of Chicago Press.
Holyoak, K. J., & Simon, D. (1999). Bidirectional reasoning in decision making by constraint satisfaction. Journal of Experimental Psychology: General, 128, 3–31.
Jekel, M., Nicklisch, A., & Glöckner, A. (2010). Implementation of the Multiple-Measure Maximum Likelihood strategy classification method in R: Addendum to Glöckner (2009) and practical guide for application. Judgment and Decision Making, 5, 54–63.
Marewski, J. N., Gaissmaier, W., Schooler, L., Goldstein, D. G., & Gigerenzer, G. (2010). From recognition to decisions: Extending and testing recognition-based models for multi-alternative inference. Psychonomic Bulletin & Review, 17, 287–309.
Martignon, L., & Hoffrage, U. (1999). Why does one-reason decision making work? A case study in ecological rationality Simple heuristics that make us smart (pp. 119–140). New York, NY: Oxford University Press.
McClelland, J. L., & Rumelhart, D. E. (1981). An interactive activation model of context effects in letter perception: I. An account of basic findings. Psychological Review, 88, 375–407.
Monroe, B. M., & Read, S. J. (2008). A general connectionist model of attitude structure and change: The ACS (Attitudes as Constraint Satisfaction) model. Psychological Review, 115, 733–759.
Montgomery, H. (1989). From cognition to action: The search for dominance in decision making. In H. Montgomery & O. Svenson (Eds.), Process and structure in human decision making (pp. 23–49). Oxford, England: John Wiley & Sons.
Newell, B. R., & Fernandez, D. (2006). On the binary quality of recognition and the inconsequentially of further knowledge: Two critical tests of the recognition heuristic. Journal of Behavioral Decision Making, 19, 333–346.
Newell, B. R., & Shanks, D. R. (2004). On the role of recognition in decision making. Journal of Experimental Psychology: Learning, Memory, and Cognition, 30, 923–935.
Oppenheimer, D. M. (2003). Not so fast! (and not so frugal!): Rethinking the recognition heuristic. Cognition, 90, B1-B9.
Pachur, T., Bröder, A., & Marewski, J. N. (2008). The recognition heuristic in memory-based inference: Is recognition a non-compensatory cue? Journal of Behavioral Decision Making, 21, 183–210.
Pachur, T., & Hertwig, R. (2006). On the psychology of the recognition heuristic: Retrieval primacy as a key determinant of its use. Journal of Experimental Psychology-Learning Memory and Cognition, 32, 983–1002.
Payne, J. W., Bettman, J. R., & Johnson, E. J. (1988). Adaptive strategy selection in decision making. Journal of Experimental Psychology: Learning, Memory, and Cognition, 14, 534–552.
Pohl, R. F. (2006). Empirical tests of the recognition heuristic. Journal of Behavioral Decision Making, 19, 251–271.
Read, S. J., Vanman, E. J., & Miller, L. C. (1997). Connectionism, parallel constraint satisfaction processes, and Gestalt principles: (Re)introducing cognitive dynamics to social psychology. Personality and Social Psychology Review, 1, 26–53.
Richter, T., & Späth, P. (2006). Recognition is used as one cue among others in judgment and decision making. Journal of Experimental Psychology: Learning, Memory, and Cognition, 32, 150–162.
Rieskamp, J., & Otto, P. E. (2006). SSL: A theory of how people learn to select strategies. Journal of Experimental Psychology: General, 135, 207–236.
Rogers, W. H. (1993). Regression standard errors in clustered samples. Stata Technical Bulletin, 13, 19–23.
Russo, J. E., Carlson, K. A., Meloy, M. G., & Yong, K. (2008). The goal of consistency as a cause of information distortion. Journal of Experimental Psychology: General, 137, 456–470.
Simon, D., Krawczyk, D. C., Bleicher, A., & Holyoak, K. J. (2008). The transience of constructed preferences. Journal of Behavioral Decision Making, 21, 1–14.
Svenson, O. (1992). Differentiation and Consolidation Theory of human decision making: A frame of reference for the study of pre- and post-decision processes. Acta Psychologica, 80, 143–168.
Thagard, P., & Millgram, E. (1995). Inference to the best plan: A coherence theory of decision. In A. Ram & D. B. Leake (Eds.), Goal-driven learning (pp. 439–454). Cambridge, MA: MIT Press.
The predictions for RHe were calculated by implementing a RH strategy with afterwards applying a TTB strategy, if necessary. The recognition cue was always used as the most valid cue and the other cues were ordered according to subjects’ explicitly expressed ordering of cues (as indicated by assigned numbers 1 to 4; see methods section). For the TTB strategy, all cues including the recognition cue were ordered according to individuals cue ordering. For both strategies time predictions were derived based on the steps necessary to differentiate (Bröder & Gaissmaier, 2007; Glöckner, 2001). Confidence predictions were derived from subjects’ evaluation concerning cue-validity (i.e., subjects estimations concerning how many cities with a positive cue value are larger than cities without it; see methods section) of the differentiating cue (Gigerenzer, et al., 1991).
For the simulation of PCS we used the network model proposed by Glöckner and Betsch (2008b). Spreading activation in the network is simulated by an iterative updating algorithm which uses a sigmoid activation function proposed by McClelland and Rumelhart (1981; see also Read and Miller, 1998):
| ait+1 = ait (1−decay)+ |
| (1) |
with
| inputit= |
| wij ajt (2) |
ait represents the activation of the node i at iteration t. The parameters floor and ceiling stand for the minimum and maximum possible activation (in our model set to a constant value of −1 and +1). inputit is the activation node i receives at iteration t, which is computed by summing up all products of activations and connection weights wij for node i. Decay is a constant decay parameter.
The model was applied without free parameters. We used standard parameters from previous simulations (e.g., Glöckner, et al., in press) which are presented in Table A1. Cue values for city A and B were transformed into weights of −.01 (negative prediction) or .01 (positive prediction). A priori cue validities were computed from individuals’ expressions of cue-use. The only difference between PCS1 and PCS2 was the transformation function for cue usage. In PCS1 cue-usage was linearly transformed (divided by 100), whereas in PCS2 the result was squared. This captured individuals’ differences in translating their cue-usage into numbers. Note that in PCS models the influence of cues on choices follows a monotonically increasing but concave function. Hence the marginal influence of cues decreases which is corrected for by squaring input values.
The option with the highest final activation is predicted to be chosen. The number of iterations to find the solution is used as predictor for decision time, the absolute difference in activation between the two options is used as predictor for confidence (Glöckner, 2010; Glöckner & Betsch, 2008b).
In some previous publications (Glöckner, 2006; Glöckner & Hodges, in press) we also used a slightly higher decay (.10) and a lower inhibitory connection between the options (wo1-o2 = −.10) than in the current study (and in Glöckner, et al., 2010). We have, however, found in a series of (yet unpublished) simulations that PCS predictions are robust against such slight changes in parameters.
Finally, to test the stability of our findings and to rule out the objection that PCS might benefit from the fact that it uses subjects’ cue-usage estimations instead of their cue-validity estimations — as it is the case for TTB and RH — we recalculated choice predictions of PCS1 and PCS2 based on cue-validity estimations. We thereby used the transformation functions w = ((v−50)/100) and w = ((v−50)/100)2 to scale the values between 50 and 100 down to acceptable weights. The adherence rates for both strategies remained essentially stable but decreased slightly (all cases: PCS1=.774; PCS2=.771; RU-cases: PCS1=.804, PCS2=.802). Also the correlations between aggregated choice predictions of PCS and observed choices (see Figure B1) could be replicated (PCS1=.92, PCS2=.90). Correlations between aggregated PCS time predictions and observed times (see Figure B2) decreased somewhat but remained considerably higher than the correlations for RHe and TTB (PCS1=.48, PCS2=.16). The respective correlations for confidence predictions remained stable (PCS1=.60, PCS2=.55). Hence, the additional analysis demonstrates the robustness of the results. The slight drop in predictive performance, however, also indicates that measures of cue-usage should be preferred over measures of cue-validity as input for PCS models, as one would expect on theoretical grounds. Specifically, in the terminology of the classic lens model (Brunswik, 1955), PCS models the personal weighting of these cues (i.e., the subjective part / the right side of the lens) instead of the objective relation between distal criterion and cues (i.e., the left side of the lens). Both might on the long run converge in so called “kind environments” with appropriate feedback (Hogarth, 2001).
Table A1: Model parameters for PCS simulations.
Value / Function | Description | |
| Decay | .05 | Decay parameter for node activation; influences the overall activation level of the nodes, the higher the value the lower the final activation level. |
| wo1-o2 | −.20 | Inhibitory connection between options; influences the size of coherence shifts; the stronger the inhibitory connection the stronger the coherence shifts. |
| wc-o | .01/−.01 | Connection between cues and options representing positive or negative cue predictions. |
| wv | PCS1: w=(v/100) vs. PCS2: w=(v/100)2 | Links between general validity node and cues representing a priori cue validity. We divide the cue validities v (measured as peoples cue usage on a scale from 0 to 100) by 100. For PCS2 we take the result to the power of 2. |
| ceiling / floor | 1/−1 | Upper and lower limit for cue activations. |
| Stability criterion | 10−6 | The network was considered having reached a stable solution if there was no energy change in the network for 10 iterations which exceeded 10−6. |
Table B1: US-American cities and cue patterns. Sources for city-sizes: http://de.wikipedia.org/wiki/ St%C3%A4dte_in_den_Vereinigten_Staaten; for diocese: http://www.katolsk.no/utenriks/namerika.htm; and for university: http://www.utexas.edu/world/univ/state/ and the respective home pages of the universities.
| No. | City | Inhabitants (in 1000) | Recognition | State capital | Diocese | University |
| 1 | Hialeah | 212 | − | − | − | − |
| 2 | Carson City | 52 | − | + | − | − |
| 3 | Mobile | 191 | − | − | + | − |
| 4 | Tempe | 174 | − | − | − | + |
| 5 | Lansing | 115 | − | + | + | + |
| 6 | Trenton | 84 | − | + | + | − |
| 7 | Topeka | 123 | − | + | − | + |
| 8 | Stockton | 290 | − | − | + | + |
| 9 | Miami Beach | 87 | + | − | − | − |
| 10 | Charleston | 51 | + | + | − | − |
| 11 | Oklahoma City | 274 | + | − | + | − |
| 12 | Bufallo | 272 | + | − | − | + |
| 13 | Salt Lake City | 181 | + | + | + | + |
| 14 | Richmond | 200 | + | + | + | − |
| 15 | Albany | 96 | + | + | −* | + |
| 16 | Orlando | 228 | + | − | + | + |
| * This cue value was changed to fit the cue pattern. In reality Albany is a Diocese. | ||||||
Figure B1: Correlation between observed and predicted choices by
strategy. Values are collapsed by decision tasks (i.e., averaging
across subjects) resulting in a total of 120 data points per
strategy. Graphs include a regression line and the correlation between
choice prediction and choice. Missing predictions were excluded. Graphs
include all subjects and are not conditional on strategy
classification.
Figure B2: Correlation between observed and predicted response times by
strategy. Values are collapsed by decision tasks (i.e., averaging
across subjects). Graphs include a regression line and the
correlation between strategy predictions and time. Time scores are
time-residual after partialling out order effects and
log-transformation. Missing predictions were excluded. Time predictions
of strategies have different scales (i.e., PCS iterations are in the
range of 50 to 200 whereas TTB / RHe calculation steps are in the range
of 1 to 4). Graphs include mean values across all subjects and are not
conditional on strategy classification.
Figure B3: Correlation between observed and predicted confidence by
strategy. Values collapsed by decision tasks (i.e., averaging
across subjects). Graphs include a regression line and the
correlation between strategy predictions and confidence. Missing and
zero predictions were excluded. Predictions of strategies have
different scales (i.e., TTB / RHe cue validities are between 50 and 100
(out of 100); PCS confidence is calculated from differences in option
activations and ranges from 0 to 2). Graphs include all subjects and
are not conditional on strategy classification.
Figure B4: Adherence rates by strategy and by subject. Each set of
four bars represents one subject and is calculated over all 120
tasks. Tasks for which no predictions can be derived are dropped per
strategy (see Table 2). Note that the proportion of choices in line
with a strategy should not be equated with the probability
that a person used the strategy, unless equal priors of the strategies
are assumed. The likelihood of the data given the application of a
certain strategy is estimated by the Multiple-Measure Maximum
Likelihood method (results see Table 3).
This document was translated from LATEX by HEVEA.