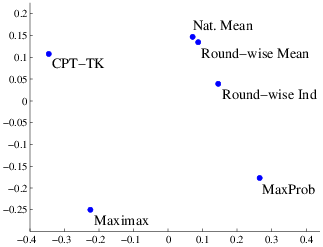
| Figure 1: MDS mapping of the six models based on their rate of identical predictions for the choices in the Hertwig et al. (2004) data. |
Judgment and Decision Making, vol. 6, no. 8, December 2011, pp. 821-831
Pair-wise comparisons of multiple modelsStephen B. Broomell* David V. Budescu# Han-Hui Por# |
Often research in judgment and decision making requires comparison of multiple competing models. Researchers invoke global measures such as the rate of correct predictions or the sum of squared (or absolute) deviations of the various models as part of this evaluation process. Reliance on such measures hides the (often very high) level of agreement between the predictions of the various models and does not highlight properly the relative performance of the competing models in those critical cases where they make distinct predictions. To address this important problem we propose the use of pair-wise comparisons of models to produce more informative and targeted comparisons of their performance, and we illustrate this procedure with data from two recently published papers. We use Multidimensional Scaling of these comparisons to map the competing models. We also demonstrate how intransitive cycles of pair-wise model performance can signal that certain models perform better for a given subset of decision problems.
Keywords: decision models, measures of fit, model comparison, pair-wise
comparisons.
The field of behavioral decision making is, to a large degree, phenomena driven. After a certain empirical regularity is discovered and validated, researchers test multiple models (some old, and some new) to explain the result. For example, every model of decision making under risk is expected to account for the classical Allais paradox. When new models are proposed, researchers often justify them by a series of comparisons against the older models in the field. There are several approaches for testing decision models. In the context of axiomatic models, there is a focus on small subsets of problems judiciously chosen to be diagnostic and differentiate optimally between certain models (e.g., Birnbaum, 2008b; Cavagnaro, Myung, Pitt, & Kujala, 2010; Glöckner & Betsch, 2008). Others seek data from multiple published studies involving decision problems selected by different researchers by various (often, unspecified) criteria and compare how well the models predict them (e.g., Brandstätter, Gigerenzer, & Hertwig, 2006; González-Vallejo, 2002). An alternative approach is to compare the models’ ability to predict decision behavior in a sample of problems that are sampled randomly from a well defined universe of problems (e.g., Erev, Roth, Slonim, Barron, 2002).
In all these methods the researcher assembles a data set consisting of an array of N decision problems and M models. For each problem there is one empirical response (decision), Di(i=1… N), which can take one of many forms such as a binary choice, a probability of a choice pattern, a numerical value such as a probability estimate, a certainty equivalent, etc., and a set of predictions Di(i=1… N), generated by the various models. There are numerous ways to evaluate the fit of the models (see for example the special issue of the Journal of Mathematical Psychology, 2000, vol. 44, issue 1) and a full review is well beyond the scope of this note. For our purposes it is sufficient to say that most of them are based on some discrepancy function f(Di,Di) between the responses and the predictions that summarizes discrepancies across all N decisions, and can be formulated to take its optimal (desirable) value in the case of N perfect predictions. Thus, one can always rank (and in some cases also scale) models according to how close or distant they are from a perfect fit. Some simple examples of such functions are (a) proportion of correct predictions, or of predictions corrected for chance; (b) mean (or median) f(Di,Di) where f could rely on squared deviations (Di−Di)2, absolute deviations |Di−Di|, ratios Di/Di, or their logarithms log(Di/Di); (c) relative measures such as relative squared deviations (Di−Di)2 / Di; (d) measures based on the likelihood function of the data under a certain model, etc.
To illustrate the approach, we review in some detail a few such studies: Brandstätter, Gigerenzer, and Hertwig (2006) report results of four model contests using different data sets with a total of N = 260 decision problems (N1=14; N2=90; N3=56; N4=100). They compared M = 14 models and used several sets of parameters for models with free parameters such as cumulative prospect theory (Tversky & Kahneman, 1992). Their measure of fit was percent correct prediction of a majority of subjects (henceforth majority choice), averaged across all the Ni decision problems in each data set. They also report percent correct prediction of majority choice and the percent agreement between all model pairs across the N = 260 decision problems. A similar approach is used in several chapters in Gigerenzer, Todd, and the ABC Research Group (1999). Hau, Pleskac, Kiefer, and Hertwig (2008) considered N = 732 decision problems involving 123 subjects from three experiments and compared M = 16 models (see Figure 6 in their paper). Their measure of fit was overall percent correct predictions. Erev et al. (2010) analyzed three model contests, each using a different decision paradigm, with two problem sets (N = 60 in each set). The contestants submitted their favorite models (they received M = 7–8 submissions for the various contests) and the measure of fit (by which the winner was identified) was the mean squared deviation of the model from the choices in the competition data set.
The measures used in these papers aggregate discrepancies in a compensatory fashion to provide global fit summaries. These global fit summaries have a variety of limitations and shortcomings: (a) they are insensitive to the number of identical predictions between models, or the diagnostic ability of the problem set; (b) they are compensatory in nature so they hide the relations between the models (for example, if two models have the same sum of squared deviations from the actual data—one cannot tell if the two models make similar predictions for all problems, or make distinct predictions with one model working better for some problems and the other being superior for a different subset); (c) the performance of certain models, as measured by a global fit index, can be manipulated by judicious choices of the decision problems; and (d) some measures (such as majority choice) are sometimes used sub-optimally (e.g., majority choice counts ignore the relative magnitude of prediction error, yet it is occasionally used to evaluate models that make quantitative predictions).
These limitations are well recognized in the literature (Birnbaum, 1973; Birnbaum, 1974; Birnbaum, 2008a; Glöckner & Betsch, 2008; Hilbig, 2008). Several recent papers advocate methodologies that address these limitations such as a maximum likelihood strategy for model comparison (Bröder and Schiffer, 2003) and adding multiple dependent measures like response time and confidence when choice predictions alone are not sufficiently diagnostic (Glöckner, 2009).
We outline an approach that supplements comparisons based on such global fit measures, addresses some of their weaknesses, and provides additional information and insights about the merit of the various models. Essentially, we propose a “tournament” where every model is a competitor and every decision provides a new confrontation between all pairs of models. Thus, one can determine a winner for each pair of models by using some scoring rule (see examples of scoring rules in the following sections). Furthermore, one can combine the results of these direct head to head confrontations to determine an overall ranking of the models.1 We also show that this overall ranking does not have to be in complete agreement with the ranking based on the global discrepancy function (see Budescu & Yu, 2007 for a previous application).
In addition to providing more detailed information about the relative performance of the model, this approach has the ability to focus only on the most relevant comparisons for each pair. A fact that is often ignored in standard model comparisons is that many decision problems are non-diagnostic in the sense that all models make identical predictions. In the pair-wise approach these cases are excluded and every pair of models is compared only on the basis of the cases where they make distinct predictions, so these diagnostic cases carry more weight (compared to the global approach where all cases contribute equally, regardless of their diagnosticity).
Global summaries can potentially overlook key insights in model comparison that can be revealed with this extended methodology. For example, a ranking of all models based on a global measure may obscure intransitive cycles that could signal that each of the models perform better for a different subset of decision problems (as shown in one of our examples).2 The new pair-wise comparison method identifies such cases.
We illustrate the proposed method with two examples.
In the traditional description based decision making paradigm DMs are asked to choose between gambles with known (“described”) outcomes and their respective probabilities. In the experience based decision making paradigm the DM does not know the outcomes and their respective probabilities. Instead the DM is allowed to experience the gambles by repeatedly sampling from their distributions (typically by pressing buttons shown on a computer screen and at no cost). The outcomes are sampled randomly from the two gambles with well defined probability distributions. The DM samples as much as he/she wants before making a final choice. Thus, these final decisions are based on a collection of random experiences and the subjective estimates that the DM forms, instead of descriptions of the outcomes and their respective probabilities. This paradigm poses an interesting and unique challenge for modeling choices because the models need to use each individual’s unique history of experiences to predict his/her choices. Because of the random nature of these experiences, there is little control over the diagnosticity of the decision problems. For example, experiences may induce obvious choices (that all decision models would predict) even in cases where the gambles’ parameters would lead to more heterogeneous predictions.
We analyze the choices from the Hertwig et al. (2004) EBDM study where 50 subjects were given access to two buttons that, when pressed, produced independent experiences from the risky gambles. DMs sampled from these gambles until they decided they were ready to choose which button to play for real payment. A median of 15 samples were drawn before making a choice.3 We compare M = 6 different models previously used in the literature.4 They include the three best models reported by Hau et al. (2008): maximax, the natural mean heuristic, and the cumulative prospect theory two-stage model with Tversky and Kahneman (1992) parameters (CPT-TK) as applied by Fox and Hadar (2006). Three additional models include maximal probability (Broomell, 2010), and two variants of the round-wise comparison model (Broomell, 2010; Hills and Hertwig, 2010). See Appendix A for details on the models.
Table 1 shows the overall correct prediction rate, and the chance adjusted rate given by Cohen’s κ (computed as (percent correct – 0.5)/(1 – 0.5)), for all models. The highest performing models are the two round-wise models, natural mean, and maximal probability models. The adjusted rates show that all models perform well above chance level, and the rates of correct predictions for these models are quite similar. This can be due to agreement between the models’ correct (and incorrect) predictions of the same choices, or their ability to predict correctly (and incorrectly) distinct subsets of choices. Table 2 displays the percent of identical predictions and of identical correct predictions made by each pair of models. To put these values in perspective, consider the expected level of agreement between models. Let PCi and PCj be the rate of predictions of a certain choice by Models i and j, respectively, and PCij be the rate of identical predictions by both models. The Frechet bounds provide upper and lower bounds for the amount of agreement between two models given each model’s marginal percentage of correct choices.5 The closer the observed rate of agreement, PCij, is to the upper (lower) bounds the higher (lower) the fraction of identical predictions by the two models. Consider the best two models in Table 1: They predict correctly 0.84 and 0.82 of the choices (and are incorrect in 0.16 and 0.18 of the cases), respectively, so the rate of joint correct predictions must be between the lower bound (0.84 + 0.82 –1.00) = 0.66 and 0.82. The actual rate is 0.82, matching the upper bound indicating that both models predict correctly the same choices. In fact, all 6 models analyzed make identical predictions in 48% of the cases examined and the same correct predictions in 44% of the cases. The results show an extremely high number of identical predictions between the natural mean, round-wise mean, and round-wise indicator models. Conversely, the CPT-TK has the lowest number of identical predictions with the other models (especially with the maximal probability model).
Table 1: Percent of correct predictions by six models for the Hertwig et al (2004) data.
Model Raw percent correct Cohen’s κ Maximax 0.73 0.46 Nat. Mean 0.79 0.58 CPT-TK 0.68 0.36 Maximal prob. 0.78 0.56 Round-wise Indicator 0.84 0.68 Round-wise Mean 0.82 0.64 Note: Winning model is in bold.
Table 2: Proportion of identical predictions (above the diagonal) and proportion of identical correct predictions (below the diagonal) for each pair of models applied to the Herwtig et al. (2004) data.
Maximax Nat. Mean CPT-TK Max. Prob. Round-wise ind. Round-wise mean
Figure 1: MDS mapping of the six models based on their rate of identical predictions for the choices in the Hertwig et al. (2004) data.
Table 3: Ratio of the number of choices favoring the row model and the number of choices favoring the column model in the Herwtig et al. (2004) data. Entries above the diagonal are reciprocals of the entries below the diagonal such that rij = 1/rji.
Maximax Nat. mean CPT-TK Max. prob. Round-wise ind. Round-wise mean Number of unique predictions made by the row model when compared to the column model. Maximax Nat Mean CPT-TK Max. prob. Round-wise ind. Round-wise mean
The level of similarity between the various models can be visualized by performing a Multidimensional Scaling (MDS) that uses the proportion of identical predictions (shown above the diagonal in Table 2) as the measure of proximity. The MDS solution considers all pairs simultaneously and generates a map of all models where the distances between points reflect their level of similarity—the higher (lower) the rate of identical predictions, the closer (more distant) the models are in the two dimensional configuration. Figure 1 illustrates vividly the pattern described above: CPT-TK is distant from the maximum probability model, with the natural mean and round-wise models being very close to each other and located roughly in the middle. Maximax (which does not use probability information) is equally distant from all the models.
Table 3 displays a pair-wise comparison of the six models based only on the cases where they make distinct predictions. Each entry in the top panel of Table 3 is the ratio of the number of correct predictions of the row model over the number of correct predictions of the column model. Values greater (lower) than 1 show more correct predictions for the row (column) model. One simple way to think of this ratio is as the odds of making a correct prediction by betting on the Row model, rather than the Column model. The last column in the table is the geometric mean of these ratios weighted by the number of unique predictions and, accordingly, it is labeled WGM.6 This is the overall score of the model in the context of the competition.
The bottom panel of Table 3 shows the number of unique predictions of the row model when compared with the column model. Typically, this matrix is symmetric, but some models cannot make unique predictions based on certain experienced samples, so it is slightly asymmetric. This matrix determines the number of decision problems used to assess relative performance. This number can be low for two reasons. When the models make many identical predictions (see round-wise mean and the natural mean models in Table 3) we face a low diagnosticity problem. In such cases this low count is more informative than the actual comparison, as it indicates that the competing models are, essentially, identical.
The other reason for a low count could be that the models do not produce predictions for all problems. For example, a model that makes predictions in only a small subset of problems—and these predictions are extremely accurate—can easily outperform models that make predictions for all problems regardless of the performance of these models on the remaining problem set. Such cases are indicative of a more basic problem of differential generality of the models. Competitions are meaningful and most informative only when they compare models that apply to a similar range of problems, and in our view, models with a restricted range of predictions should be excluded from large tournaments. Of course, one can always set additional tournaments that focus only on limited classes of problems where all models are on equal footing. For example, a model that does not make predictions about choices between mixed prospects should be excluded from a general tournament of models of choice, but should be included in similar restricted tournaments of models of choice between positive (or negative) prospects.
The results in Table 3 show that the round-wise indicator model is the winner. It beats all the other models (all ratios > 1) in the cases where its predictions differ from its competitors, and it is correct on average twice as often as it is wrong. Conversely, this particular instantiation of the CPT-TK (using the group parameters from Tversky & Kahneman, 1992) loses all its direct competitions (all ratios < 1), and it is wrong on average twice as often as it is right. Finally, we compared the weighted geometric means from Table 3 with the rate of correct predictions (Table 1). The six models are ranked identically, and their scores are highly correlated (r = 0.96).
The recent model competition run by Erev et al. (2010) provided a unique platform for generating, testing, and evaluating decision models for three types of decision problems: description based decisions, experience based decisions, and feedback based decisions. The organizers randomly generated and paired gambles and produced two data sets that were used in the “competition” of models. The first data set contained the parameters of two gambles (one risky and one safe) and the choices of a sample of subjects. Subjects in the competitions used these data to derive decision models that were then used to fit the choices in the second data set (generated by a different sample of subjects). The proportion of risky choices predicted by each model was compared to the observed proportion of risky choices, and models were rated according to the mean squared deviation (MSD) of each of the 8 competing models (see Appendix B for model descriptions). Table 4 lists the results of the competition for choices from description. Model M1 is the best, followed quite closely by models M6 and M4. Model M8 is in last place.
Table 4: The mean squared deviation between the predicted and observed choice proportions in the competition for predicting decisions from description data (Erev et al. 2010).
Model Overall MSD M1 0.0126 M2 0.0291 M3 0.0268 M4 0.0165 M5 0.0213 M6 0.0134 M7 0.0187 M8 0.0375
Unlike the Hertwig et al. (2004) data where the predictions were binary (correct or incorrect), the measure of fit in this example is continuous (proportion of risky choices). To implement our approach, we counted the number of times a proportion predicted by a model was closer to the observed proportion than the prediction of the competing model on a trial by trial basis. In this competition the number of identical predictions is very small (less than 5 out of a total of 60 for all pairs), so this is not a major factor. Each entry in Table 5 represents the number of wins of the row model divided by the number of wins by the column model.
Interestingly, no model beats all its competitors and no model is beaten by all the others. According to the weighted geometric mean of the ratios, model M6 is the best, followed by models M1 and M4. Model M2 is in the last place. Table 5 shows the intransitive pattern of relations among the top 3 models:7 model M1 beats M4 but not M6; M6 beats M1, but not M4; and model M4 beats M6, but not model M1! This intransitivity suggests that there is no best model, so we tested if various models work best for some choices. We contrasted the cases where each of the top models, M1 and M6, performs better. There were only 2 cases (out of 60) where the two models were equally close to the actual proportion of choices, and 28 (30) trials where model M1 (M6) outperformed model M6 (M1) (see Table 5). The striking pattern is that model M1 outperforms model M6 for gambles with negative expected values, and M6 is better than M1 for gambles with positive expected values! Thus, the obvious conclusion is that each of the models is more accurate for a specific subset of the domain. Such patterns suggest that some of the models are much more narrow and specific than the intended domain of the tournament. Many discrepancies of this type indicate that there is a basic mismatch between the desired goal of testing general models and the nature of the available models.
The new approach is not restricted to counts of agreement with, or proximity to, the correct value. It can be implemented with a variety of metrics of performance. We illustrate this point in Appendix C with two additional pair-wise tournaments of these models.
Table 5: Ratio of row/column counts of model closer to observed choice rate (Erev et al. 2010, decisions from description). Entries above the diagonal are reciprocals of the entries below the diagonal such that rij = 1/rji.
M1 M2 M3 M4 M5 M6 M7 M8 WGM M1 1.00 1.76 1.40 1.15 1.55 0.93 1.50 1.80 1.35 M2 0.57 1.00 0.97 0.46 0.58 0.48 0.69 1.00 0.69 M3 0.71 1.03 1.00 0.87 0.61 0.49 0.57 1.19 0.78 M4 0.87 2.17 1.15 1.00 1.07 1.11 1.04 1.71 1.21 M5 0.65 1.73 1.64 0.93 1.00 0.72 1.11 1.71 1.12 M6 1.07 2.11 2.05 0.90 1.39 1.00 2.11 1.46 1.43 M7 0.67 1.46 1.76 0.97 0.90 0.47 1.00 1.19 0.98 M8 0.56 1.00 0.84 0.58 0.58 0.69 0.84 1.00 0.75
Many experiments attempt to select decision problems that are maximally diagnostic to optimally differentiate between specific decision models. Other researchers use (and re-use) many sets of decision problems or randomly generated problems. In these settings our pair-wise tournament of models approach is an important, useful supplement to the global, compensatory, measures of performance that are used routinely. We have illustrated the approach with two different types of data (binary choices and probability of choice) and with various metrics of fit (ratios of counts, differences of deviations, etc). This demonstrates the flexibility and generality of the approach, and suggests that researchers can easily adopt this framework to other problems and other metrics that best fit the focus and context of their research.
For example, one of the reviewers suggested using this method to analyze the performance of a single model consisting of several stages. The Priority Heuristic (Brandstätter, Gigerenzer, and Hertwig, 2006) outlines a non-compensatory lexicographical model based on three simple decision rules that focus on different attributes: the minimal outcome, the probability of the minimal outcome, and the maximal outcome. These three decision rules can be treated as competing models in the pair-wise tournament to evaluate the performance of the full Priority Heuristic model with each component decision rule. Thus, one could set a tournament where Model 1 = Priority Heuristic, Model 2 = Maximin, Model 3 = minimize the probability of losing, Model 4 = Maximax, and Model 5 = Maximin followed by minimization of the probability of losing. The pair-wise method could reveal, for example, to what degree the predictions of the Priority Heuristic (Model 1) are in agreement with the first decision rule in the hierarchy (Model 2) and the first two (Model 5) .
Most importantly, the application of the pair-wise tournament to both the Hertwig et al. (2004) and Erev et al. (2010) data provided new insights about the models that could not have been extracted from the original data analyses. The most revealing aspect of the Hertwig et al. (2004) data was the high level of agreement between the predictions of the models. The pair-wise analysis revealed that almost half of the decision problems did not differentiate between any of the models. In addition to focusing the model comparison process to the diagnostic cases, we are able to illustrate (see Figure 1) the similarity between the models (the natural mean and round-wise mean) that could not be detected using global measures.
In the Erev et al. (2010) data set our approach uncovered several interesting facts. The first is the intransitivity among the top three models which suggests the winner has a very weak (and questionable) advantage. The second insight is that different measures rank the models differently (including the top 2 models) showing that the rankings are not very robust in this case. Finally, and maybe most revealing, when we compared the cases where M1 or M6 are best, we found that they performed best in different subsets of decision problems. None of these results could be inferred from standard measures of global performance and they illustrate the potential of this new, simple, transparent, easy to implement and interpret tool that addresses successfully many methodological concerns.
Researchers should consider carefully the most appropriate metric for each application. In some cases counts of correct predictions are all that matter (and all that is available to work with) as in the Hertwig et al. (2004) example. In other cases, one may wish to use quantitative measures in the metrics of probabilities, outcomes, etc. Our method can work with multiple metrics (as we illustrated in Appendix C with the Erev et al. 2010 data) and allows researchers to explore the robustness of their conclusions.
In the Hertwig et al. (2004) example the ranking of the models inferred from the pair-wise tournament agreed with the ranking based on overall correct prediction and in the Erev et al. (2010) example the correspondence was much lower. This raises the question of how often the pair-wise approach is in agreement with the global measures of fit. We address this issue at some length in Appendix D where we show that, even with as few as M = 3 models, the two approaches will diverge, and that the likelihood of such inconsistencies increases as a function of the number of decisions. We also use a bootstrapping approach to document the level of inconsistency between the pair-wise ranking and the global measures of fit for the two examples. Both analyses clearly confirm that the pair-wise comparison approach can add meaningful information and lead to new insights.
We believe that the new approach can add considerable information to the process of comparing and evaluating model performance. It provides a more detailed analysis and focuses attention toward diagnostic problems. However, the pair-wise tournament is not a magic solution and it cannot eliminate all the problems that can plague the model comparison process. Some of the problems are more general and are not related to the specific model comparison methodology employed. Thus, when using the new proposed scaling produced by the pair-wise tournament one should continue to watch for the well documented pitfalls of this process. One such problem is the use of inappropriate measures of fit (see Birnbaum 1973, 1974 on the improper use of the correlation as a measure of fit, and problems with other measures including the overall percent correct, Birnbaum, 2008a; Hilbig, 2010). One should also remember that the selection of problem sets can determine to a large degree the performance of models on global measures of fit. We emphasize the importance of diagnostic experimental designs and problem sets for differentiating between decision models. Finally, recall that comparisons between models depend on the proper and fair treatment of models with and without free parameters. Applying global fit summaries to parametric models with arbitrarily selected parameters or with parameters estimated by various methods and in different contexts can bias the process and misidentify the best models (Birnbaum 2008a).
Birnbaum, M. H. (1973). The devil rides again: Correlation as an index of fit. Psychological Bulletin, 79, 239–242.
Birnbaum, M. H. (1974). Reply to the devil’s advocates: Don’t confound model testing and measurement. Psychological Bulletin, 81, 854–859.
Birnbaum, M. H. (2008a). Evaluation of the Priority Heuristic as a descriptive model of risky decision making: Comment on Brandstatter, Gigerenzer, and Hertwig (2006). Psychological Review, 115, 253–262.
Birnbaum, M. H. (2008b). New paradoxes of risky decision making. Psychological Review, 115, 463–501.
Brandstätter, E., Gigerenzer, G., & Hertwig, R. (2006). The priority heuristic: Making choices without trade-offs. Psychological Review, 113, 409–432.
Broder, A., & Schiffer, S. (2003). Bayesian strategy assessment in multi-attribute decision making. Journal of Behavioral Decision Making, 16, 193–213.
Broomell, S. B. (2010). Studies of experience based decision making. (Doctoral dissertation, University of Illinois, 2010) Retrieved from https://www.ideals.illinois.edu/handle/2142/16719.
Budescu, D.V., & Yu, HY. (2007). Aggregation of opinions based on correlated cues and advisors. Journal of Behavioral Decision Making, 20, 153–177.
Budescu, D., Zwick, R., & Rapoport, A. (1986). A comparison of the eigenvalue method and the geometric mean procedure for ratio scaling. Applied Psychological Measurement, 10, 69–78.
Cavagnaro, D. R., Myung, J. I., Pitt, M. A., & Kujala, J. V. (2010). Adaptive design optimization: A mutual information based approach to model discrimination in cognitive science. Neural Computation, 22, 887–905.
Erev, I., Ert, E., Roth, A. E., Haruvy, E., Herzog, S. M., Hau, R., Hertwig, R., Stewart, T., West, R. and Lebiere, C. (2010). A choice prediction competition: Choices from experience and from description. Journal of Behavioral Decision Making, 23, 15–47.
Erev, I., Roth, A. E., Slonim, R. L., & Barron, G. (2002). Predictive value and the usefulness of game theoretic models. International Journal of Forecasting, 18, 359–368.
Fox, C. R., & Hadar, L. (2006). Decisions from experience = sampling error + prospect theory: Reconsidering Hertwig, Barron, Weber & Erev (2004). Judgment and Decision Making, 1, 159–161.
Gigerenzer, G., Todd, P., & ABC Research Group. (1999). Simple Heuristics That Make Us Smart. New York: Oxford University Press.
Glöckner, A. (2009). Investigating intuitive and deliberate processes statistically: The multiple-measure maximum likelihood strategy classification method. Judgment and Decision Making, 4, 186–199.
Glöckner, A. & Betsch, T. (2008). Do people make decisions under risk based on ignorance? An empirical test of the priority heuristic against cumulative prospect theory. Organization Behavior and Human Decision Processes, 107, 75–95.
González-Vallejo, C. (2002). Making trade-offs: A probabilistic and context-sensitive model of choice behavior. Psychological Review, 109, 137–155.
Hau, R., Pleskac, T., Kiefer, J. & Hertwig, R. (2008). The description-experience gap in risky choice: The role of sample size and experienced probabilities. Journal of Behavioral Decision Making, 21, 1 -26.
Hertwig, R., Barron, G., Weber, E., & Erev, I. (2004). Decisions from experience and the effect of rare events in risky choice. Psychological Science. 15, 534–539.
Hilbig, B. E. (2008). One-reason decision making in risky choice? A closer look at the priority heuristic. Judgment and Decision Making, 3, 457–462.
Hilbig, B. E. (2010). Reconsidering “evidence” for fast-and-frugal heuristics. Psychonomic Bulletin & Review, 17, 923–930.
Hills, T. T. & Hertwig, R. (2010). Information search in decisions from experience: Do our patterns of sampling foreshadow our decisions? Psychological Science, 21, 1787–1792.
Tversky, A., & Kahneman D. (1992). Advances in Prospect Theory: Cumulative representation of uncertainty. Journal of Risk and Uncertainty, 5, 297–323.
Weisstein, E. W. "Fréchet Bounds." From MathWorld--A Wolfram Web Resource. http://mathworld.wolfram.com/FrechetBounds.html
The Hertwig et al. (2004) data set includes the objective (generating) parameters of the decision problem, the DMs’ samples, and their choices. Each of the models in this tournament was fit using the experienced samples, so predictions for any given pair of gambles may differ across individuals as a function of the samples experienced. The decision models are described in Table A.1.
Table A.1. Model Descriptions for Hertwig et al. (2004) data.
Maximax: Chooses the gamble that provides the highest outcome experienced. Natural Mean Heuristic: Calculates the overall average of experienced outcomes from each gamble and chooses the gamble that provides the higher average outcome experienced. Cumulative Prospect Theory 2-stage Model: Uses the relative frequency of outcomes from each gamble as an estimate of probability, applies the weighting and utility transformations using the group parameters from Tversky and Kahneman (1992) to produce a value for each gamble and chooses the gamble with the higher value. Maximal Probability: The experiences are used to estimate a probability of obtaining each outcome and the model chooses the gamble that provides the higher probability of obtaining a higher outcome. Round-wise Indicator: Sampling is broken down into rounds (or runs) based on the switching behavior during the sampling process. The average experience of each round is compared and the gamble that wins the most rounds is chosen. Round-wise Mean: Sampling is broken down into rounds based on the switching behavior during sampling. The difference in the average experience from each gamble is calculated across all rounds, and is averaged. The gamble with the higher average is chosen. Note: Round-wise terminology is used in Hills and Hertwig (2010), the round-wise mean model is equivalent to the contrast model outlined in Broomell (2010).
The Erev et al. (2010) data set includes the objective parameters of the decision problem, the predicted proportion of choices favoring the risky gamble, and the observed proportion of choices favoring the risky gamble. The top three decision models are described in Table B.1.
Table B.1. Model Descriptions of top three models for Erev et al. (2010) data.
Model 1: Linear utility and logistic choice. Model 4: Prospect theory with aspiration levels. Model 6: Prospect theory without diminishing sensitivity with Luce’s choice rule.
We present two additional pair-wise tournaments of these six models based on (a) minimizing squared deviations, and (b) minimizing absolute deviations. First, we computed for each model the Squared Deviation (SD) and the Absolute Deviation (AD) from the observed proportion of choice. Then we calculated for each pair of models the difference in squared deviations (SDrow-SDcol) and the difference in absolute deviations (ADrow-ADcol). The results of these two analyses are presented in Tables C.1 and C.2, respectively. A difference is negative if the row model performs better and has a smaller (squared or absolute) deviation than the column model. The weighted row means provide an overall scaling of the models’ performance.
The order inferred from the pair-wise comparison based on squared deviations (Table C.1) is identical to the overall MSD (and the score is a linear transformation of the overall MSD reported in Table 4), favoring model M1 followed by M6 and M4, while the ordering inferred from absolute deviations (Table C.2) agrees with the count base analysis in Table 5 (M6 best followed by M1 and M4). Table C.3 shows the (Pearson and Kendall) correlations between the scores of the 8 decision models according to the various metrics. There is a reasonably high, but far from perfect agreement!
@percentTable C.1. Comparison of squared deviations from the observed choice proportion (SDrow-SDcol) for each pair of models (Erev et al. 2010, decisions from description). Lower numbers show better performance.
M1 M2 M3 M4 M5 M6 M7 M8 Mean M1 0.000 –0.016 –0.014 –0.004 –0.009 –0.001 –0.006 –0.025 –0.0093 M2 0.016 0.000 0.002 0.013 0.008 0.016 0.010 –0.008 0.0070 M3 0.014 –0.002 0.000 0.010 0.006 0.013 0.008 –0.011 0.0048 M4 0.004 –0.013 –0.010 0.000 –0.005 0.003 –0.002 –0.021 –0.0055 M5 0.009 –0.008 –0.006 0.005 0.000 0.008 0.003 –0.016 –0.0008 M6 0.001 –0.016 –0.013 –0.003 –0.008 0.000 –0.005 –0.024 –0.0086 M7 0.006 –0.010 –0.008 0.002 –0.003 0.005 0.000 –0.019 –0.0034 M8 0.025 0.008 0.011 0.021 0.016 0.024 0.019 0.000 0.0153
@percentTable C.2. Comparison of absolute deviations from the observed choice proportion (ADrow–ADcol) for each pair of models (Erev et al. 2010, decisions from description). Lower numbers show better performance.
M1 M2 M3 M4 M5 M6 M7 M8 Mean M1 0.000 –0.043 –0.036 –0.008 –0.018 0.004 –0.015 –0.057 –0.022 M2 0.043 0.000 0.007 0.036 0.025 0.047 0.028 –0.013 0.021 M3 0.036 –0.007 0.000 0.029 0.018 0.040 0.021 –0.021 0.014 M4 0.008 –0.036 –0.029 0.000 –0.011 0.012 –0.008 –0.049 –0.014 M5 0.018 –0.025 –0.018 0.011 0.000 0.022 0.003 –0.039 –0.004 M6 –0.004 –0.047 –0.040 –0.012 –0.022 0.000 –0.019 –0.061 –0.026 M7 0.015 –0.028 –0.021 0.008 –0.003 0.019 0.000 –0.041 –0.007 M8 0.057 0.013 0.021 0.049 0.039 0.061 0.041 0.000 0.035
Table C.3. Pearson correlation between the scores of the models (above diagonal) and Kendall rank order correlation between their ordering (below the diagonal) for the Erev et al. (2010) data (decisions from description).
Pair-wise
This analysis demonstrates that, similar to global comparisons, one can use several different metrics in the pair-wise tournament. Results based on these metrics are not always in agreement, potentially leading to different rank orders for the competing models. In some cases researchers may choose the most appropriate measures based on their research goals. For example, although the sum of squared deviation is the standard choice in social sciences, one may opt for the sum of absolute deviations, which is known to be much less sensitive to extreme and outlying cases, if the researcher suspects that some of the models compared may make such extreme predictions, or if the data set includes a small number of cases with payoffs that are markedly larger than all the rest and may affect the results disproportionally. In other cases, one may wish to compare multiple metrics. Although it may be tempting to resolve conflicting rank orderings from multiple metrics (or global summaries) by choosing a metric, we believe that such conflicts should be treated as a signal that there is no clear winning model and that additional collection of diagnostic data is warranted.
Assume the response is binary and assume that we have M competing models predicting N choices. Each model predicts correctly (or incorrectly) each of the N cases. Thus, for every case there can be anywhere between 0 (all models are wrong) and M (all models are right) correct predictions. This setup induces 2M possible patterns but two of them (when all models are wrong and when they are all right) are non-diagnostic and uninformative, so the analysis focuses on the remaining (2M–2) patterns. Table D.1 lists all cases involving M=3 models.
Global measures of fit (excluding N000 and N111) provide the total number of correct predictions for each of the M=3 models as: T1 = (N110 + N101 + N100); T2 = (N110 + N011 + N010); and T3 = (N101 + N011 + N001). The pair-wise measures of fit (excluding N000 and N111) provide the following ratios of the number of unique correct predictions: R12 = (N100 + N101) / (N010 + N011); R13 = (N100 + N110) / (N001 + N011); and R23 = (N010 + N110) / (N001 + N101) and recall that Rij = 1 / Rji. For each ratio we compute the geometric means to obtain a global scaling from the pair-wise tournament as: GM1=(1*R12*R13)1/3; GM2=(R21*1*R23)1/3; and GM3=(R31*R32*1)1/3.
We compared the ranking of the models based on T1, T2, T3 and GM1, GM2, GM3. We considered all possible patterns and computed the (Kendall) rank order correlations between the two rankings. To simplify interpretation we eliminated all cases involving ties (i.e., Ti=Tj and/or GMi = GMj). The results are summarized in Table D.2 for N = 25, 50, 75. There is a sizeable minority of cases where the two rankings are not in perfect agreement (τ < 1).8 Also note that the rate of such cases increases, and the mean correlation decreases, as the number of decisions increases, justifying the approach.
@percentTable D.1. All cases of incorrect and correct prediction for each of M=3 models.
Note: R = Right; W = Wrong
We further test the agreement between global measures of fit of the models and the scaling inferred from the pair-wise tournament. We produced B = 100 bootstrap samples for each data set by sampling with replacement N cases for each re-sample. These re-samples were used to produce B = 100 global summaries and v = 100 rankings of the models. The mean values of all the measures are shown in Table D.3. In the Hertwig et al. (2004) data the two global summaries agreed on the best model in 79% of the re-samples, and agreed on the worst model in 96% of the re-samples. In the Erev et al. (2010) bootstrapped re-samples the two global summaries agree on the best model only in 59% of the cases, and agree on the worst model in 38% of the re-samples.
Table D.2. Distribution of Kendall τ rank order correlation for simulation.
Kendall τ N=25 N=50 N=75 τ = 1/3 0.034 0.065 0.077 τ = 1 0.966 0.935 0.923 Mean value τ 0.977 0.957 0.949 No of cases 35,532 1,757,112 15,279,486
Table D.3. Mean (standard deviation) of the global measures of fit from the 100 bootstrap re-samples.
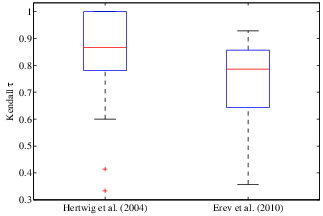
We computed the Kendall τ rank order correlation between the two rankings across the B re-samples. The distribution of rank order correlation for the 100 bootstrap samples is shown in Figure D.1. The box includes the central 50% of the distribution of τ values and the center line indicates the median τ . The whiskers extend to cover approximately 2.7 standard deviations from the mean with extreme data points marked in red. The mean correlation is τ = 0.87 for the Hertwig et al. (2004) data set, and τ = 0.74 for the Erev et al. (2010) data set. These results illustrate vividly the additional contribution of the new approach.
Figure D.1. Distribution of the Kendall τ rank order correlation between the model rankings derived from the global fit and pair-wise comparison approaches based on B = 100 bootstrap re-samples from each data set.
This document was translated from LATEX by HEVEA.