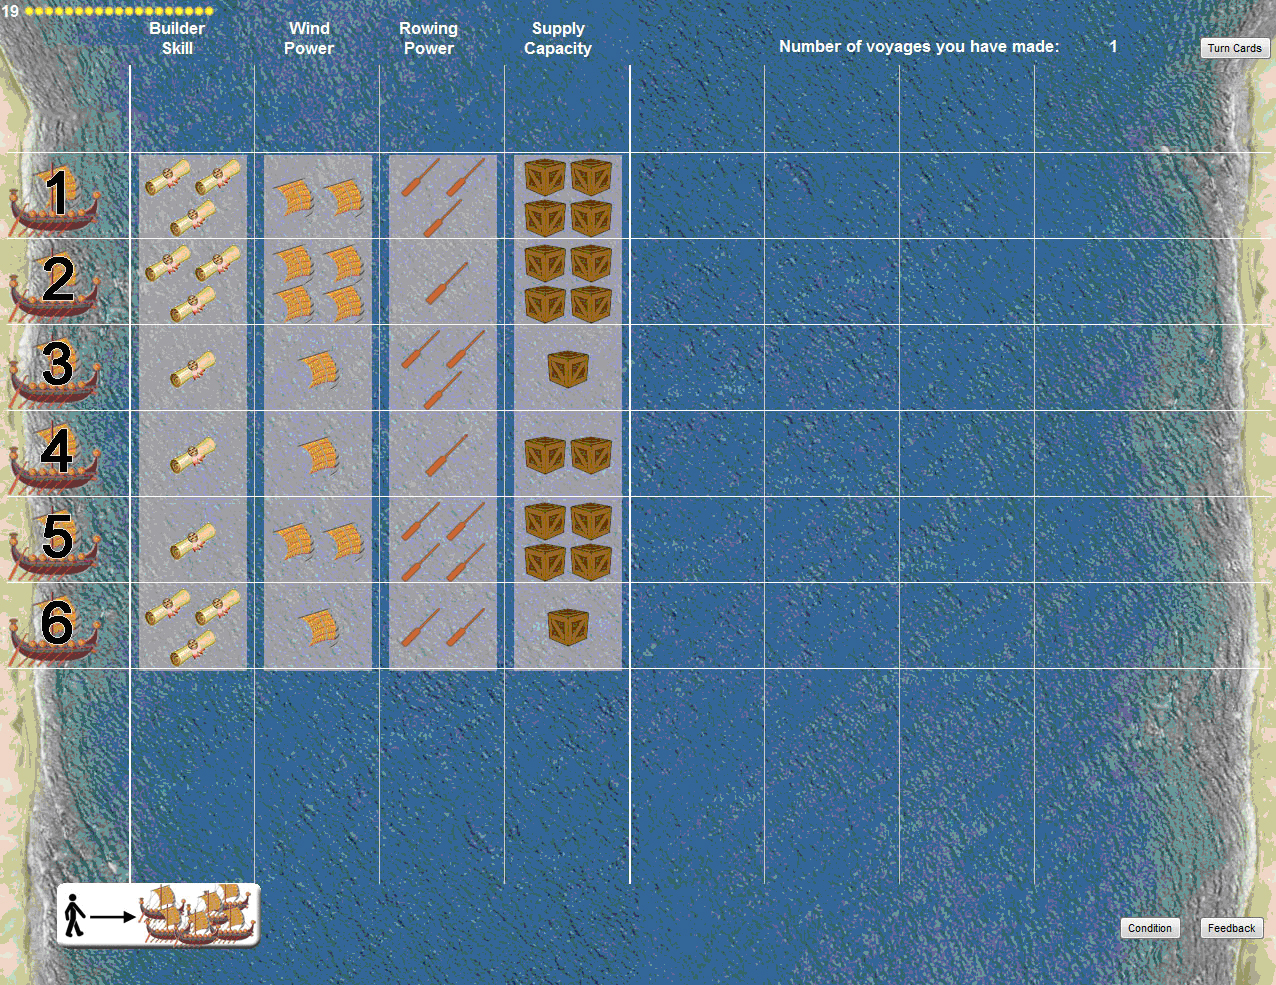
| Figure 1: Screenshot of the task used in the new experiment. |
Judgment and Decision Making, vol. 6, no. 3, April 2011, pp. 239-251
Are groups more likely to defer choice than their members?Chris M. White* Sebastian Hafenbrädl* Ulrich Hoffrage# Nils Reisen# Jan K. Woike# |
When faced with a choice, people can normally select no option, i.e., defer choice. Previous research has investigated when and why individuals defer choice, but has almost never looked at these questions when groups of people make choices. Separate reasons predict that groups may be equally likely, more likely, or less likely than individuals to defer choice. We re-analyzed some previously published data and conducted a new experiment to address this question. We found that small groups of people tended to defer choice more often than their members would. Assuming that the groups used a plurality rule but gave additional weight to individual preferences to defer choice allowed the groups’ responses to be predicted quite well. We discuss several possible explanations of these findings.
Keywords: group decision making, choice deferral, decision
avoidance, decision delay.
When given a choice, as well as being able to select one option, people are often also able to select none of the options, that is, to defer choice. Many of these choices are not made alone, but by a group of people, be it family members, friends, or colleagues. The current research investigates who is more likely to defer choice: groups making choices collectively or members of those groups making choices individually.
It is possible to think of situations in which groups are more likely to defer choice compared to their members — just think of any time you were assigned to a committee of people who could not reach a decision, even though each of the individual members had a clear preference. In contrast, some established principles of group decision making suggest that groups may be less likely to defer choice than their members. The phenomenon of groupthink implies, for instance, that members who are hesitant to make a decision as individuals are swayed by the team spirit. As a consequence, groups may be more prone than some of their members to make hasty decisions rather than to delay a decision (Janis, 1972). Empirical evidence concerning whether groups or individuals are more likely to defer choice appears to be non-existent. We address this gap by reanalyzing data from two previously published experiments and presenting a new experiment.
We refer to the behavior of not selecting one of a set of available options as choice deferral, which Anderson defined as “a situation in which an individual chooses not to choose for the time being” (2003, p. 144). Deferring choice may have different consequences in different situations: some or all of the options in the current set may not be available in the future and/or new options may appear. According to Anderson, choice deferral is a subcategory of the broader concept of decision avoidance, which also contains behaviors like choosing the status quo or default option, and taking no action. In this paper, we concentrate on choice deferrals, and we leave the question of whether our findings generalize to other types of decision avoidance to future research.
Some research on individual decision making has investigated when and why individuals defer choice (e.g., Greenleaf & Lehmann, 1995). Although this body of research is not extensive, one of the most important findings is that people defer choice not only in situations in which none of the available options is good enough but also in situations in which they are not sure which option is the best (e.g., Dhar, 1997). White and Hoffrage (2009, see also White, Hoffrage, & Reisen, n.d.) used these two independent reasons for deferring choice to explain the counter-intuitive result that people sometimes do not select an option as often when more options are available than when fewer options are available (Iyengar & Lepper, 2000; Schwartz, 2004; Shah & Wolford, 2007), although others have had difficulties replicating this result (for a review, see Scheibehenne, Greifeneder, & Todd, 2010).
Choice deferral has very rarely been studied in groups. As far as we are aware, no research directly addresses whether groups are more likely to defer choice than their members. Instances in which outcomes that could be described as choice deferrals have been studied in group decision making tasks mainly include hung juries and negotiation impasses. In jury decision making, individual jurors do not defer choice, a jury only fails to reach a collective decision and is said to be “hung” when the number of votes for either verdict fails to reach an externally-imposed criterion. “Negotiation impasse” typically describes a situation in which neither of two parties involved in a dispute wants to defer choice but nothing is decided because they cannot reach an agreement. Therefore, neither of these bodies of research is directly relevant to our research question.
Nijstad (2008) and Nijstad and Kaps (2008) did study a group decision task in which the group members could individually give a preference to defer choice as well as the group as a whole. Their participants were each given different combinations of information about a set of job candidates. After making an individual decision about which candidate to hire or if none of them should be hired, they made the same decision as part of a group of three people. The researchers never directly compared how often the individuals chose to defer choice to how often the groups deferred, but their data are amenable to such analyses, so we report the results of a re-analysis of their data below using the framework of Social Decision Scheme (SDS) theory (Davis, 1973; Stasser, 1999).
Which strategy a group uses to reach a decision or judgment often depends on the type of task they are performing. In inferential tasks in which there is a demonstrably correct solution, groups often use a “truth-wins” strategy: if one person can find the solution then she can often convince the group to use her response (Lorge & Solomon, 1955). In preferential tasks in which there is no “correct” response (e.g., political elections), the group must find a way to combine their individual preferences. Groups may do this by using a preference-based or an information-based strategy. The most prominent preference-based strategy is the plurality rule (i.e., select the option that receives the most votes). In contrast, when using information-based strategies, group members exchange information and form a decision based on this pooled information.
Social Decision Scheme theory (Davis, 1973; Stasser, 1999) can be used to investigate which type of decision rule groups of people use to reach collective decisions. When using this framework, different decision rules (called SDSs in this framework, e.g., a simple plurality rule) are applied to the distribution of initial individual preferences in each group. This yields a set of predicted group responses for each decision rule, and the fit between the predicted and observed group responses using each rule can then be assessed.
The standard SDS technique is quite simplistic in that each SDS (decision rule) is used merely to predict the total frequency of each type of response based on the frequency that each type of distribution of individual preferences was observed. The total frequencies of each type of response predicted by each SDS are then compared to the observed frequencies to see which SDS provides the best fit (Stasser, 1999). We used such an implementation with five different SDSs when analyzing the data from Nijstad (2008) and Nijstad and Kaps (2008). When analyzing the data from our new experiment, we used a more sophisticated technique than the one we used to analyze the data from Nijstad (2008) and Nijstad and Kaps (2008). The more sophisticated technique involved using each of the same five SDSs plus one additional rule to predict every group response based on the observed distribution of individual preferences; we then compared the mean prediction accuracy of each SDS across all groups to determine which achieved the highest fit.
One reason why we might predict groups to defer choice more often than their members is that groups have at least as many reasons to do so as individuals have. In previous work, we have argued that individuals may defer choice either because none of the options are good enough or because they are not sure which is the best (White & Hoffrage, 2009; White et al., n.d.). Nijstad (2008) and Nijstad and Kaps (2008) found evidence that groups may also defer choice because different members prefer or dislike different options. Groups may therefore defer choice due to disagreement, which is something that cannot occur when individuals make decisions alone. If groups have more reasons to defer choice than their members have then we may predict that groups will defer choice more often. This can be restated as hypothesis 1:
H1: Groups will defer choice more frequently than their members.
In contrast, one reason why we might predict groups to defer choice less often than their members is that groups can pool their knowledge together and reduce uncertainty. This argument may apply not only on the group level, but also for an individual member: discovering that other people share one’s own opinion may reduce the amount of subjective uncertainty in that opinion, thereby causing each individual to be less likely to want to defer choice after group discussion than before. Research investigating the difference in confidence between individuals and groups has indeed found this to be the case. Puncochar and Fox (2004) found that groups were not only more confident than individuals in their responses that were correct but also in their responses that were wrong, although this can at least partly be explained by the fact that the groups’ responses were more likely to be correct than those of individuals (see also Patalano & LeClair, 2011). Stephenson, Clark, and Wade (1986) observed a similar pattern of data and, in addition, found that four-person groups were even more confident in their responses than were two-person groups.
Thus, to the extent that uncertainty may lead to choice deferrals, and groups have less uncertainty, then groups may be less likely to defer choice. This can be restated as hypothesis 2:
H2: Groups will defer choice less frequently than their members.
Hypotheses 1 and 2 are obviously contradictory, so we looked at previously published data to assess which has more support and also conducted a new experiment. We first report our reanalysis of previously published data.
The 90 participants in the experiment reported by Nijstad (2008) and the 135 in that reported by Nijstad and Kaps (2008) were generally Dutch university-aged students (mean age = 21). There were three participants in each group, and so a total of 75 groups across the two experiments. Data about individual preferences were not available for one group, so only 74 groups (222 participants) are included in the analysis.
Different participants received different subsets of the available information about each of three job candidates. The paradigm was similar to the hidden profile paradigm (e.g., Stasser & Titus, 1985) except that the combined information did not favor any one candidate more than any other. The participants were first asked to individually decide which candidate should be hired or whether none of them should be hired and then became part of a three-person group that made a group response. For both the individual and group responses, participants were told that they should defer choice only “when they really thought that none of the current candidates was suitable” (Nijstad, 2008, p. 528).
The original focus of the study and analyses was on how the individuals’ positive or negative evaluations of each option were combined to make group decisions, and how these individual evaluations might cause the group to decide to defer choice. Whereas the combined information known collectively by all group members was the same in all conditions within each study, which pieces of information were presented to each person varied between groups. Specifically, in some groups, each person had a positive opinion about at least one candidate, in some groups each member had a negative opinion about at least one candidate, and in other groups each member had a neutral opinion about all candidates (Nijstad, 2008) or a positive opinion for some and a negative opinion for others (Nijstad & Kaps, 2008).
The main conclusion of the authors of this work was that negative opinions about options often had a stronger effect than positive opinions on the groups’ decisions, and that this effect often caused choice deferral. (The original publications provide additional details.) In our re-analysis of their data, we ignore how the individuals’ initial preferences were manipulated and instead concentrate on (a) determining whether groups tended to defer more or less than would be predicted by the initial preferences and (b) which decision rules predict the group response frequencies the best.
The seven distinct types of distributions of initial individual preferences within a group are listed on the left-hand side of Table 1. As an example, the upper four rows show preference distribution type A in which all three group members had an initial preference for option (candidate) 1. Because the option numbers are arbitrary, the situation of all members having a preference for option 1 is effectively the same as when they all have a preference for option 2, and so only one of these equivalent distributions is listed. The table also includes how often a group who had that type of distribution chose each type of option, with effectively equivalent responses averaged together, and the group response frequencies predicted by each Social Decision Scheme (SDS).
Table 1: The seven distinct types of individual preference distributions (first three columns), the observed frequency of the corresponding group responses (fourth column, from the Experiments by Nijstad, 2008, and Nijstad & Kaps, 2008), and the frequencies predicted by each of five social decision schemes (last five columns).
Predicted group response frequency Select option Note: Observed frequencies in italics denote average values. Observed and predicted frequencies of zero are denoted as ‘-’ to improve readability.
Table 2: Decision rules followed by each of the six Social Decision Schemes, their goodness-of-fit to the data from Nijstad (2008) and Nijstad and Kaps (2008), and their prediction accuracy in the new experiment.
a) defer choice if it is one of the tied options
b) else choose randomly between tied options
a) half the time defer choice
b) half the time choose randomly between tied optionsNote. SDS 6 makes identical predictions to SDS 5 in the experiments by Nijstad (2008) and Nijstad and Kaps (2008) because all groups had only three members.
The total frequencies are included at the bottom of Table 1, showing that 31 of the 74 groups (42%) deferred choice, while the other 43 selected a candidate. This was despite only 27 of the 222 participants (12%) having an initial preference to defer choice. This finding suggests that the group discussion resulted in a strong tendency to defer choice that cannot be explained by simply counting the initial preferences and applying a standard plurality rule. To confirm this conjecture, we performed an analysis using the SDS framework to determine what type of decision scheme might have been used.
SDS modeling allows one to predict how often each type of response would be observed assuming that a certain decision scheme was used. Five possible decision schemes are shown in Table 2, which includes a brief description of the rules used by each decision scheme and the results of a goodness-of-fit test comparing the total predicted response frequencies to the total observed response frequencies, which are given in the last two rows of Table 1. Prediction accuracies for the data from our new experiment are also included, which are explained in the report of that experiment below.
SDS #1 does not have an elevated tendency towards deferring choice. It simply predicts that the group response would be that which has a plurality of initial preferences (i.e., votes); if multiple responses are tied then it chooses randomly between those. Because all groups contained only three members in these experiments, the plurality and majority rules made identical predictions. SDS #1 predicts that groups would defer choice only about 8.7 times and select an option 65.3 times, which is a very bad fit to the observed frequencies of 31 and 43 times, respectively, χ ²(1) = 65.2, p < .001.
The other four SDSs have an increasing tendency towards deferring choice. SDS #2 generally uses the plurality rule, but, if there is a tie and if choice deferral is one of the tied options, it predicts that choice would always be deferred. This predicts there to be 14 group choice deferrals and 60 option selections, which is still a poor fit, χ ²(1) = 25.5, p < .001. SDS #3 always predicts choice to be deferred if at least one group member has an initial preference to defer (even if the two other group members both have a preference for the same option), otherwise the plurality rule is used. This predicts there to be 20 choice deferrals and 54 option selections, which yields a slightly better fit, χ ²(1) = 8.29, p < .01.
SDS #4 is the same as SDS #3, but, if there is a tie with all three options receiving one vote (and so choice deferral receives no votes), then choice is deferred with a probability of one half. Thus, the predictions are halfway between those of SDS #3 and #5. This SDS predicts there to be 36.5 choice deferrals and 37.5 option selections. The observed frequencies of 31 and 43, respectively, were not significantly different from these predicted frequencies, χ ²(1) = 1.64, p = .20. SDS #5 takes this idea to the extreme, and so is the same as SDS #3 except that if there is a tie with all three options receiving one vote then choice is deferred every time. This predicts there to be 53 choice deferrals and 21 option selections, which does not provide a good fit to the data, χ ²(1) = 32.2, p < .001.
In general, the groups deferred choice much more than would be predicted based on using a simple plurality rule to combine the initial individual preferences. A strong tendency to defer choice was observed in the group responses, with the best-fitting model predicting that the group would defer choice whenever at least one member initially preferred to do so, and sometimes even when nobody initially preferred the choice deferral option, but no two people preferred the same option. The results of this experiment clearly supported Hypothesis 1, which is that groups will defer choice more than their members, and did not support the antithesis, Hypothesis 2.
It is important to note that these statistical analyses are sensitive to the relative frequencies of the different preference distribution types. As a consequence, the results of the inferential statistics may not be completely generalizable to other situations and tasks. This was because the information that each participant received was controlled so that the distribution of initial preferences had certain properties that may not be so common in other situations. Specifically, situations in which each of the three group members preferred a different option (this was the case for 33 of the 74 groups) occurred far more frequently than might be expected if the situation were real. The fact that the groups collectively chose to defer choice quite often in these situations, even when none of the members had an initial preference to defer choice (this occurred in 12 of the 33 instances) is certainly interesting, but this may not happen in other situations.
We therefore describe a new experiment below in which a very different task and sample of participants was used and every participant received the same information about all options; this resulted in a very different pattern of distributions of initial preferences. This new experiment therefore provides a far more conservative test of our main hypotheses.
In this experiment, groups of two to eight people (mostly children) viewed sets of options each described by several attributes. We designed the task to be engaging for people attending an “Open House” event at a Swiss University. We had one of several tents whose theme was Homer’s Odyssey. Our cover story was that, after the battle at Troy, Ulysses and his crew needed to travel back to Ithaca as quickly as possible. The voyage was split into six smaller sea crossings between islands. The groups had to choose a boat to use for each trip. The participants first individually indicated which option they preferred or whether they preferred to defer choice. They subsequently made the same decision as a group. Each group made multiple such decisions and received a performance score based on how good their chosen options turned out to be.
Because the task involved multiple trials, we were able to avoid a shortcoming of many other experiments on choice deferral. Instead of choice deferral resulting in a decision being completely avoided, in this experiment deferring choice in one choice set meant that the decision would be delayed to a future choice set, which adhered to the definition of choice deferral that we stated at the beginning of this paper: choice deferral is “a situation in which an individual chooses not to choose for the time being” (Anderson, 2003, p. 144).
Our re-analysis of the experiments by Nijstad (2008) and Nijstad and Kaps (2008) gave support to Hypothesis 1, that groups defer choice more often than their members would. This new experiment again tested this hypothesis to see how robust the finding was when using a very different task and a very different sample of participants. We also manipulated two variables that were likely to affect the frequency with which choice would be deferred.
The first of the two main independent variables was the size of the choice set. Some researchers have found that people tend to select an option less often when more options are available than when fewer options are available (Iyengar & Lepper, 2000; Shah & Wolford, 2007). However, other researchers have had difficulty replicating this result, and some have even observed the opposite effect of people being more likely to select an option when more are available (e.g., White & Hoffrage, 2009; for a review, see Scheibehenne et al., 2010). Previous research therefore again leads to two contradictory hypotheses:
H3: Larger choice sets will result in more choice deferrals than smaller choice sets.
H4: Larger choice sets will result in fewer choice deferrals than smaller choice sets.
The other main independent variable was the cost of deferring choice. In most experiments that allow choice to be deferred, doing so has no implications for the participants. This is normally not the case when making real decisions. In this experiment, in addition to the fact that deferring choice in one choice set caused further choice sets to be presented (from which an option was eventually selected), in one condition we also implemented a cost of deferring choice. We naturally expected higher costs of deferring choice to decrease the number of choice deferrals:
H5: When there is a cost for deferring choice, choice will be deferred less often than when there is no cost.
We manipulated two other variables: spokesperson type and cue representation. We had no specific predictions as to how these variables would affect choice deferral, and because they in fact had small and non-significant effects, we describe how we manipulated them in the Methods section and include them in the statistical analyses, but do not discuss them further.
School groups came during the first day of the Open House event, on which 248 people (126 male, 122 female; age range = 8–14 years, except for three teachers aged 24 to 52, M = 11.1, Mdn = 11, SD = 1.1) participated in 50 groups (mean size = 4.96, range = 3–6). All members of a given group were in the same class and so knew each other.
The general public attended on the second and third days, which mostly consisted of families with school-aged children. There were 683 people (382 male, 301 female; age range = 5–72 years, M = 15.0, Mdn = 11, SD = 11.9, 86 were ≥ 18 years old) in 124 groups (mean size = 5.51, range = 2–8). Some groups consisted of only one party who knew each other, but most consisted of multiple such parties.
The main reimbursement was the educational experience of learning how research in psychology may be conducted and the enjoyment of playing the game. People also had the possibility to enter a draw to win a digital media player if they visited all of the tents in the section.
Figure 1: Screenshot of the task used in the new experiment.
An experimenter sat at each of four tables in the tent. At the end of each table was a computer monitor and in the middle of the table there was a map on which Troy, Ithaca, intervening islands, and the route to be taken were shown. To depict the group’s progression through the task, after each trip, a participant moved a model boat on the map between the islands.
One of the participants was randomly assigned to be the group’s spokesperson by rolling a die. The spokesperson type was manipulated by half of the groups being randomly assigned to the captain condition, in which the spokesperson was told to take advice from the rest of the group, but also that he/she was ultimately responsible for making the final group decision and announcing it to the experimenter. In the other condition, the spokesperson was told to assume the role of a communicator whose role was simply to inform the experimenter of the group’s collective response.
The boats in each choice set were described by four cue values: wind power, rowing power, supply capacity, and builder’s skill, which were displayed in a pictorial matrix on the left-hand side of the monitor (see Figure 1). Each cue value was determined randomly and independently for each boat, with each value from one to four having an equal probability (except that no two boats could have identical sets of values). Each group was randomly assigned to one of the two cue representation conditions: The cue values were given by either showing the corresponding number of appropriate images (e.g., three sails represented a value of three on wind power) or by showing an image with the corresponding size (e.g., a very small sail represented a value of one on wind power).
The choice set size was manipulated within-groups, with each choice set consisting of three, six, or nine boats. The first three choice sets in the test phase contained one instance of each set size in a random order. Set size varied randomly and independently in the subsequent choice sets.
The total score of each boat was the sum of the four cue values, all equally weighted (range = 4–16). If a boat was selected, a red outline appeared around the selected boat and all of the boats moved across the screen at a speed that was determined partly by the boats’ total scores and partly by random components. The time it took boats to cross the screen was transformed into the number of days that the trip took (M = 14.0 days, SD = 2.5, range = 8–23). Aside from being given a reason why each of the cues was predictive of speed, the participants were told nothing about whether the cues were weighted or how speed was computed.
On each island, the group could choose a boat from the first set of boats that they saw or they could defer choice and see additional sets of boats until they chose one. If choice was deferred then it was not possible to return to that choice set. The deferral cost was manipulated by half of the groups being randomly assigned to the no-cost condition, in which deferring choice cost nothing, and the other half were in the one-day-cost condition, in which deferring choice cost an extra day (because the new set of boats was located in a different village that the crew had to spend a day traveling to).
The experimenters deferred choice in each of the first three demonstration choice sets to ensure that participants understood what the consequences of doing so were. The experimenters did not say why choice might be deferred; they merely introduced the option and explained its consequences. During the fourth demonstration choice set, they explained the purpose of the playing cards. Each participant had a set of playing cards; each card showed a boat with a number from one to nine, corresponding to the numbers shown on the monitor, plus there was a card labeled either “Another set of options” or “Another set of options tomorrow” (depending on the deferral cost). The participants used the cards at the start of each trial to make individual responses by placing the card corresponding to their choice face-down on the table. Once all participants had placed a card on the table, the experimenter asked them to turn the cards over and start discussing what the group response would be. After the four demonstration choice sets (or five if the group response was to defer choice in fourth set), the test phase began.
When the group selected a boat, the number of days that the chosen boat took to make the trip was added to the group’s total travel time. If a group in the one-day cost condition deferred choice then one day was added to their total time. The total time was constantly displayed as a number in the top left of the screen plus a line of the corresponding number of sun images next to that.
The school groups that came on the first day had to move to another tent after 20 minutes and on the second and third days we terminated the experiment after 30 minutes so that more people had the opportunity to participate. New choice sets were presented in the test phase until the group had chosen six boats or the time limit had been reached. The mean number of choice sets responded to was 5.8 (SD = 1.8), and ranged from 1 to 13. Almost half of the groups (83 groups, or 47%) selected all six boats necessary to complete the test phase (but the data from nearly all groups was used in the analyses below).
The main dependent variable was the deferral proportion. For groups, this was computed as the number of group deferrals divided by the number of choice sets seen (ignoring the data from the demonstration choice sets). This was computed in a similar way for each individual, and then the average deferral proportion was taken across all individuals within each group. The group deferral proportion could then be compared to the mean individual deferral proportion within that group and so the group was used as the unit of analysis, and response source, group versus individual, was a within-group independent variable.
The participants completed two other brief tasks that were independent of the current research, the results of which are reported elsewhere (Antonakis & Dalgas, 2009; Hoffrage, Antonakis, White, Krings, & Palazzo, n.d.).
We analyzed the deferral proportion using a mixed-design ANOVA that included the within-group variables of response source (group or individual) and choice set size (three, six, or nine boats) and the between-group variables of deferral cost (no-cost or one-day-cost), cue representation (size or number), and spokesperson type (captain or communicator) and the dependent variable of deferral proportion. Out of the 174 groups, four were not included in this analysis because they did not respond to at least three choice sets, and so did not see one of each choice set size.
Overall, the proportion of times that groups deferred choice, 10.5%, was larger than that for the individuals, 8.7%, F (1, 162) = 6.66, p = .01; this was a small effect, d = 0.2. There was a higher proportion of choice deferrals when there was no cost to deferring, 13.6%, rather than a cost of one day, 5.5%, F (1, 162) = 24.4, p < .01; this was a large effect, d = 0.76. Also, choice was more frequently deferred when the choice set was smaller than larger, F (2, 324) = 26.4, p < .001, which is an effect that we observed in previous research and referred to as “the allure of more choice” (White & Hoffrage, 2009; White et al., n.d.).
The overall effect of response source was qualified by a significant interaction with the effect of deferral cost, F (1, 162) = 8.71, p < .01. This interaction is illustrated in Figure 2 and was caused by groups deferring choice more than individuals only in the no-cost condition, 15.5% and 11.7%, respectively, t (82) = 3.28, p = 0.002, which was a small effect, d = 0.36; there was effectively no difference in the one-day cost condition, 5.4 % and 5.7%, t (86) = –0.31, p = 0.76. No other main effects or interactions were significant (all p values > .05).
The number of people in the group (range = 2–8) and the median age of the group’s members (range = 5.5–63 years) did not significantly relate (neither linearly nor quadratically) to the proportion of times that groups or individuals deferred choice (all |r|’s < 0.13, all p’s > .10).
Figure 2: Choice deferral proportion for groups and individuals in the new experiment. 
Because each group made multiple responses, we performed a more sophisticated SDS analysis to compare the performance of the different decision rules. We applied the same five decision rules described above and listed in Table 2, plus two baseline models, to each group’s sets of responses. Instead of simply predicting the total number of choice deferrals and option selections, we predicted exactly which option would be chosen or if choice would be deferred for each choice set for each group based on the distribution of initial preferences, using each decision rule. The proportion of correct predictions for each group using each decision rule could then be compared. All 174 groups were included in these analyses.
As a baseline, predicting the group responses by randomly choosing one of the available options or deferring choice yielded a mean prediction accuracy of 16.6% (SD = 2.4%). Basing the prediction of each group response on a single random individual’s initial preference yielded a mean accuracy of 65.6% (SD = 12.3%). Combining all the individuals’ preferences using the simple plurality rule, SDS #1, was significantly more accurate than using just one individual’s response, with a prediction accuracy of 81.5% (SD = 16.3%), t (173) = 18.8, p < .001.
In the reanalysis of the Nijstad (2008) and Nijstad and Kaps (2008) data, we found that some of the decision rules that involved a tendency to defer choice even when it was not the plurality response fared better than the simple plurality rule. The same was somewhat true here. Recall that SDS #2 is the same as the plurality rule except that when there is a tie then choice is always predicted to be deferred when choice deferral is one of the tied responses. This decision scheme yielded a mean prediction accuracy of 82.5% (SD = 16.7%), which is significantly higher than the prediction accuracy of SDS #1, t (173) = 3.61, p < .001.
Although the difference in prediction accuracy between SDS #1 and SDS #2 is significant, the magnitude is very small, only 1.0 percentage points. This was due to the two sets of predictions being different only when there was a tie and choice deferral was one of the tied responses. This was not an overly common situation in this experiment, occurring in only 43 out of the 1004 choice sets that were responded to across all 174 groups. Even so, out of these 43 occurrences, choice was deferred 32 times (as SDS #2 would predict), which is significantly more than the 18.4 times that would be expected if the groups chose randomly between the tied responses (as SDS #1 predicts), χ ²(df =1, N = 43) = 17.6, p < .001.
The other three decision rules, SDS #3, #4, and #5, all performed significantly worse than SDS #1, achieving mean prediction accuracies (SDs) of 72.9% (19.7%), 71.1% (20.3%), and 69.3% (21.4%), respectively, t (173) = 6.45, 7.92, 9.1, respectively, all p values < .001.
We used one more SDS in this experiment. SDS #6 predicts that groups will go with the majority decision if there is one (i.e., when one option receives more votes than all other options combined) and predicts choice to be deferred in all other situations. When there are only two or three group members, which was always the case in the experiments by Nijstad (2008) and Nijstad and Kaps (2008), then the predictions of this SDS are identical to those of SDS #5. Most groups in this experiment had at least four members, and so the predictions sometimes differed from those of SDS #5. However, it also performed significantly worse than SDS #1, with a mean prediction accuracy of 70.8% (SD = 22.4%), t (173) = 8.03, p < .001.
When there was no cost to deferring choice, groups deferred more often than their members. This effect was not observed when there was a cost to deferring cost, but this may have been due to a floor effect because deferral rates were generally less than 10% in that condition. Therefore, in the no-cost condition, the results supported Hypothesis 1, which states that groups defer choice more than their members, and we found no support for the antithesis, Hypothesis 2, in any condition.
In addition to comparing the overall choice deferral proportions for individuals and groups, we also analyzed how well the individual responses predicted the group responses for choice deferrals and boat selections. The groups’ responses could be quite accurately predicted by assuming that a plurality decision rule was used to combine the preferences of the individuals. In addition to this, a preference to defer choice appeared to receive more weight than a preference to select one of the options; this was particularly evident when looking at the cases in which the same number of people opted to defer choice as who chose a specific boat, in these cases the group typically deferred choice (on 32 of 43 such occasions).
The results also supported Hypothesis 4, which states that larger choice sets will result in fewer deferrals than smaller choice sets, and the antithesis, Hypothesis 3, was not supported by the data. Finally, Hypothesis 5 was also supported by the data: An increased cost of deferring choice lead to fewer deferrals.
The results of our experiment and of the experiments reported by Nijstad (2008) and Nijstad and Kaps (2008) generally lead to the same conclusion: Groups are indeed more likely to defer choice than would be predicted based on their members’ initial preferences. Very different methodologies and participants were used in these studies, but the findings were robust across these two settings.
The tendency for groups to give more weight to initial preferences to defer choice than to other options was more pronounced in the experiments by Nijstad (2008) and Nijstad and Kaps (2008) than in our new experiment. Specifically, we found that the social decision schemes that fit the data from Nijstad (2008) and Nijstad and Kaps (2008) the best assumes that choice will be deferred whenever at least one person has an initial preference to do so or sometimes even when nobody has an initial preference to do so but everyone initially favors a different option. In our new experiment, the tendency for groups to defer choice more than would be predicted by the simple plurality rule appeared only when there was a tied vote and choice deferral was one of the tied responses. There were not many such instances in this experiment, which caused the difference between the group and individual deferral rates to be relatively small.
Comparing the two sets of results presented here suggests that the increased tendency for groups to defer choice more than individuals may differ in magnitude between different tasks and samples, and investigating these differences further would be an interesting avenue for future research. Furthermore, in the Predictions subsection of the Introduction we hypothesized that groups may be less likely to defer choice than individuals because groups are able to reduce their uncertainty compared to that of individuals due to groups being able to pool information together and because the individuals within the group can learn that other people share their (uncertain) opinion. Indeed, research has shown that groups are more confident in their responses than are individuals (e.g., Puncochar & Fox, 2004). In addition, the phenomenon of groupthink implies that members who are hesitant to make a decision as individuals are swayed by the team spirit. In the experiments reported here, these factors appear have not been as strong as those that caused groups to defer choice more than individuals, but that is not to say that in other paradigms, the relative strength of these factors might be reversed, leading to results that are opposite to those presented here. For instance, the fact that group members first made individual responses before the group discussion began may have muted some of the effects of groupthink. We hope that future research might therefore use other paradigms, materials, and procedures to explore the robustness and to detect boundary conditions of the present findings.
It is not obvious why groups deferred choice more often than their members, so we discuss several possible explanations of this. None of these can account for all of the reported data, but they all have their own merits, and it is likely that not just one but a combination of these explanations is correct.
An explanation that relies on the assumption that groups used an information-based decision strategy rather than a preference-based strategy is that choice deferral may be easier to defend in a group discussion and/or may be more difficult to attack than the selection of a certain option. Other options can be compared to each other on certain dimensions, because, for example, an option may possess a superior value on one attribute compared to a second option, while the second option may be superior to the first on another attribute. Deferring choice does not have specific values on certain attributes, so attribute-wise comparisons are impossible; criticizing choice deferral based on specific attributes is therefore difficult. This explanation could be applied to both experimental paradigms reported here.
The explanation that deferring choice may be easier to defend than is selecting a certain option is similar to a phenomenon observed in jury decision making in which there is a tendency towards acquittal rather than conviction (MacCoun & Kerr, 1988). Even if the acquittal decision has fewer or an equal number of initial jury votes than a conviction decision, the acquittal decision is often eventually chosen, seemingly because it is easier to defend on the grounds of there being reasonable doubt.
An alternative explanation of why groups deferred choice more often than their members is that groups often tend to be more risk-seeking than individuals (as was reported by, among others, Johnson & Davis, 1972; Zajonc, R. Wolosin, M. Wolosin, & Loh, 1970). However, this explanation rests on the assumption that deferring choice is a riskier behavior than is selecting one of the currently available options. Deferring choice can be framed as the riskier behavior because one does not know what will be available in future choice sets, whereas one is fully aware of the current options; deferring choice therefore results in more uncertainty. However, deferring choice can also be framed as the less risky behavior because if there are no good options in the current choice set then choosing even the best of these is risky because it may turn out very bad; in contrast, deferring choice in these situations is likely to yield a better (and so less “risky”) option in a future choice set. The assumption that deferring choice is the riskier behavior is therefore not necessarily valid because which response is riskier depends on the exact situation and the consequences of choosing one of the options and of deferring choice. Further research is therefore needed to know whether differences in risk attitudes are at the root of our findings.
To determine the riskiness of deferring choice instead of selecting one of the available options requires a full understanding of the task structure, which the participants in our new experiment could not have achieved given their limited exposure to it. If this had been possible then participants could have determined the optimal behavior given each choice set that would minimize the expected total voyage time. In contrast, we were able to perform this analysis for our new experiment, and it revealed that it would have been rational to defer choice far more often than either the individuals or groups did (ignoring all indirect costs of deferring choice). If some members were able to infer this based on their limited knowledge of the task structure then they may have been able to convince the group to defer choice more than would be expected based on the members’ initial preferences. Another possible explanation of our result that groups deferred choice more than their members is therefore that a truth-wins (information-based) decision rule was used by at least some of the groups instead of a purely preference-based strategy.
Although it would have been rational to defer choice more than did the individuals or groups in our new experiment, there was no response that could be described as more “rational” in the experiments of Nijstad (2008) and Nijstad and Kaps (2008). In their task, participants had to select one of three job candidates or defer choice because none of them were good enough. Because no criterion was given for what was good enough, it is difficult to determine what the correct response would be in this situation. Therefore, the fact that groups deferred choice more than their members cannot be said to be any more rational than the opposite pattern of behavior in these experiments.
One final pair of explanations for why groups deferred choice more often than individuals is based on the idea that groups have more reasons to defer choice than individuals have. In previous work, we have argued that individuals may defer choice either because none of the options is good enough or because they are not sure which is the best (White & Hoffrage, 2009; White et al., n.d.). Nijstad (2008) and Nijstad and Kaps (2008) found evidence that groups may also defer choice because different members prefer or dislike different options. In these situations, it appears that, even though each member may be confident enough in his/her opinion, the group cannot collectively reach a certain level of confidence in choosing any specific option, and it may defer choice for this reason. That is, the amount of variation between the opinions of different group members may be predictive of the probability that the option chosen by the group will be the best of those available, and so groups could use the heterogeneity of the members’ opinions as a proxy for the expected accuracy of the decision. Groups may also defer choice for a reason that is not applicable to individuals: by deferring choice, no members feel as if they have “lost” the argument when the group chooses an option they did not prefer.
These latter two explanations, the amount of variation in the individual preferences being a proxy for uncertainty and deferring choice so that no members feel as if they lost the argument, are supported by the data from Nijstad (2008) and Nijstad and Kaps (2008). As shown by summing together the frequencies listed for the preference distribution types B and C in Table 1, when the three group members initially preferred different options, but nobody initially preferred deferring choice, the group deferred choice 16 out of 52 times (31%). In contrast, the data from our new experiment do not support these explanations. Even when two or more options were tied for the most votes, but the option to defer choice was not one of the tied options, then the groups almost never deferred choice (they did so only 0.7% of the time). More research is therefore needed to discover in which type of tasks these reasons for groups to defer choice will be more important, and in which they will be less important.
To summarize our discussion of possible explanations, it is unclear whether the increased likelihood for groups to defer choice is because it is more rational to do so, because groups are more risk-seeking than individuals, because the idea of deferring choice is easier to defend than is selecting a specific option in a group situation, or because groups sometimes cannot reach a consensus. It may be that not just one but a combination of these explanations captures the real cause, and more research is needed to decide which is/are the most valid in which situations. We hope that this paper will stimulate such research so that we may start to understand this important phenomenon better.
This research has implications for organizational decision making. In most, if not all organizations, some decisions are made by individuals and others by groups. Each of these modes has advantages and disadvantages (for an overview, see, e.g., Baron, 1995). Organizations differ with respect to how many and which decisions are assigned to individuals versus to groups. In the military or in emergency units such as fire brigades, surgery teams, or police units where time is often crucial, decisions are usually made by one person to ensure time efficiency. In contrast, in organizations like the United Nations Security Council or the World Health Organization, democratic processes and a balance of power are considered to be of utmost importance, so major decisions are made by groups of people that share responsibility. Most organizations contain elements of both extremes, and it is for the design of decision mechanisms in such organizations that our research has implications.
If groups are more prone to defer choice than are individuals, organizations that rely heavily on decisions made by groups might have an in-built tendency to inertia and to resist change. One cannot say whether or not this is a good thing in general: On one hand, groups’ increased tendency to defer choice may, for some cases, result in better outcomes compared to the outcomes resulting from individual decision making. Conversely, there will be cases in which deferring choice and maintaining the status quo has clear disadvantages. The design of organizational decision mechanisms should take groups’ elevated tendency towards choice deferral into account, and existing organizations are well-advised to (re)consider which kind of decisions should be given to individuals instead of groups and what should be done in cases in which an individual or a group defers making a decision.
Antonakis, J. & Dalgas, O. (2009). Predicting elections: Child’s play! Science, 323, 1183.
Baron, J. (1995). A theory of social decisions. Journal for the Theory of Social Behavior, 25, 103–114.
Davis, J. H. (1973). Group decision and social interaction: A theory of social decision schemes. Psychological Review, 80, 97–125.
Dhar, R. (1997). Consumer preference for a no-choice option. Journal of Consumer Research, 24, 215–231.
Greenleaf, E. A. & Lehmann, D. R. (1995). Reasons for substantial delay in consumer decision making. Journal of Consumer Research, 22, 186–199.
Hoffrage, U., Antonakis, J., White, C. M., Krings, F., & Palazzo, G (n.d.). Take him or leave him: Children’s decisions in an ethical dilemma situation. Working paper, University of Lausanne, Faculty of Business and Economics.
Iyengar, S. S. & Lepper, M. R. (2000). When choice is demotivating: Can one desire too much of a good thing? Journal of Personality and Social Psychology, 79, 995–1006.
Janis, I. L. (1972). Victims of groupthink. Boston: Houghton Mifflin.
Johnson, C. D. & Davis, J. H. (1972). An equiprobability model of risk-taking. Organizational Behavior and Human Performance, 8, 159–175.
Lorge, I. & Solomon, H. (1955). Two models of group behavior in the solution of eureka-type problems. Psychometrika, 20, 139–148.
MacCoun, R. J., & Kerr, N. L. (1988). Asymmetric influence in mock jury deliberation: Jurors’ bias for leniency. Journal of Personality and Social Psychology, 54, 21–33.
Nijstad, B. A. (2008). Choosing none of the above: Persistence of negativity after group discussion and group decision refusal. Group Processes and Intergroup Relations, 11, 525–538.
Nijstad, B. A. & Kaps, S. C. (2008). Taking the easy way out: Preference diversity, decision strategies, and decision refusal in groups. Journal of Personality and Social Psychology, 94, 860–870.
Patalano, A. L., & LeClair, Z. (2011). The influence of group decision making on indecisiveness-related decisional confidence. Judgment and Decision Making, 6, 163–175.
Puncochar, J. M. & Fox, P. W. (2004). Confidence in individual and group decision making: When “two heads” are worse than one. Journal of Educational Psychology, 96, 582–591.
Scheibehenne, B., Greifeneder, R. & Todd, P. M. (2010). Can there ever be too many options? A meta-analytic review of choice overload. Journal of Consumer Research, 37, 409–425.
Schwartz, B. (2004). The Paradox of Choice: Why More is Less. Harper Perennial: New York, NY.
Shah, A. M. & Wolford, G. (2007). Buying behavior as a function of parametric variation of number of choices. Psychological Science, 18, 369–370.
Stasser, G. (1999). A primer of social decision scheme theory: Models of group influence, competitive model-testing, and prospective modeling. Organizational Behavior and Human Decision Processes, 80, 3–20.
Stasser, G. & Titus, W. (1985). Pooling of unshared information in group decision making: Biased information sampling during discussion. Journal of Personality and Social Psychology, 48, 1467–1478.
Stephenson, G. M., Clark, N. K., & Wade, G. S. (1986). Meetings make evidence? An experimental study of collaborative and individual recall of a simulated police interrogation. Journal of Personality and Social Psychology, 50, 1113–1122.
White, C. M., & Hoffrage, U. (2009). Testing the tyranny of too much choice against the allure of more choice. Psychology and Marketing, 26, 280–298.
White, C. M., Hoffrage, U., & Reisen, N. (n.d.). Choice deferral can arise from absolute evaluation or relative comparison. Working paper, University of Lausanne, Faculty of Business and Economics.
Zajonc, R. B., Wolosin, R. J., Wolosin, M. A., & Loh, W. D. (1970). Social facilitation and imitation in group risk-taking. Journal of Experimental Social Psychology, 6, 26–46.
This document was translated from LATEX by HEVEA.