Judgment and Decision Making, vol. 5, no. 5, August 2010, pp.
391-410
Fast Acceptance by Common Experience: FACE-recognition in Schelling’s model of neighborhood segregation Nathan Berg*
University of Texas at Dallas
Ulrich Hoffrage
University of Lausanne, Switzerland
Katarzyna Abramczuk
Polish Academy of Sciences and University of Warsaw |
Schelling (1969, 1971a,b, 1978) observed
that macro-level patterns do not necessarily reflect micro-level
intentions, desires or goals. In his classic model on neighborhood
segregation which initiated a large and influential literature,
individuals with no desire to be segregated from those who belong to
other social groups nevertheless wind up clustering with their own
type. Most extensions of Schelling’s model have
replicated this result. There is an important mismatch, however,
between theory and observation, which has received relatively little
attention. Whereas Schelling-inspired models typically predict large
degrees of segregation starting from virtually any initial condition,
the empirical literature documents considerable heterogeneity in
measured levels of segregation. This paper introduces a mechanism that
can produce significantly higher levels of integration and, therefore,
brings predicted distributions of segregation more in line with
real-world observation. As in the classic Schelling model, agents in
a simulated world want to stay or move to a new location depending on
the proportion of neighbors they judge to be acceptable. In contrast
to the classic model, agents’ classifications of their
neighbors as acceptable or not depend lexicographically on recognition
first and group type (e.g., ethnic stereotyping) second. The
FACE-recognition model nests classic Schelling: When agents have no
recognition memory, judgments about the acceptability of a prospective
neighbor rely solely on his or her group type (as in the Schelling
model). A very small amount of recognition memory, however, eventually
leads to different classifications that, in turn, produce dramatic
macro-level effects resulting in significantly higher levels of
integration. A novel implication of the FACE-recognition model
concerns the large potential impact of policy interventions that
generate modest numbers of face-to-face encounters with members of
other social groups.
Keywords: ethnic, discrimination, lexicographic, non-compensatory,
heuristic, urban economics, institutional design.
1 Introduction
Based on his counterintuitive observation concerning neighborhood
segregation, Nobel Laureate Thomas Schelling (1969, 1971a,b, 1978)
established what would become a large and influential literature
connecting various subfields of the social sciences. Schelling’s
observations was this: even in the absence of intrinsic aversion to
those who belong to other groups, and without anyone explicitly aiming
to locate themselves in a segregated community, high levels of
segregation could nevertheless result from a modest desire to avoid
being too much of a relative minority. When one observes the sharp
ethnic segregation that exists in a regrettably large number of US
cities, Schelling argued we ought not conclude that this is
necessarily the result of anti-ethnic sentiment among either majority
or minority group members. Schelling’s classic segregation model
shows, for example, that when people are happy with any location at
which up to half their neighbors belong to a different ethnic group,
one should nevertheless predict dramatic segregation into nearly
homogeneous ethnic blocs that no individual explicitly sought or
wished for. The incongruity of macro consequences that do not reflect
individual objectives is the overarching theme referred to in the
title of Schelling’s (1978) Micromotives and Macrobehavior.
Of particular relevance to judgment and decision making researchers,
we hope, is this link — or lack of link as was Schelling’s
argument — between individual-level decision-making process and macro
spatial dynamics. One might dismiss the relevance of Schelling’s very
simple model to the complexity of real-world neighborhoods and other
social communities, such as academic departments, where methodological
splits into subgroups sometimes lead to conflict and segregation
(e.g., empirical versus theoretical divides which are common in
economics departments, or social psychologists interacting quite
separately from other sub-disciplines within psychology departments).
Yet Schelling’s model is widely used to inform analyses of
policies (at virtually all levels of local, state and federal
government, as well as among private firms and non-profits such as
universities) dealing with segregation of many kinds.
Although Schelling’s neighborhood segregation model gave
rise to a substantial new literature that remains active to this day,
there is an important mismatch between theory and empirical observation
that has received relatively little attention.
Schelling’s model predicts high levels of segregation
starting from virtually anywhere within a very large set of initial
conditions and parameter values. Yet empirical studies documenting
various forms of segregation (e.g., ethnic types among cities, gender
types among work places, or methodological types among academic
institutions) reveal considerable variation in the extent to which
social groups are observed to engage in inter-group mixing. Whereas
the world presents observers with a rich variety of heterogeneous
segregation outcomes, Schelling’s theory does not
easily account for this variation as a systematic function of variables
or parameters within the model, which raises interesting questions.
Can the Schelling model be squared with real world data? Are there
extensions of the Schelling model that come closer to reality by
predicting heterogeneous segregation levels that vary systematically
with observable factors in the environment?
This paper presents such an extension. We augment Schelling’s classic
model by endowing agents with recognition memory. This capacity
enables simulated agents to apply the FACE-recognition heuristic.
FACE refers to an evolved capacity that is key for our model, namely
recording faces into recognition memory. At the same time, the
acronym FACE (for Fast Acceptance by Common Experience)
refers to the insight that shared local experience can facilitate
rapid formation of relationships and, thus, transform assessments of
others’ underlying quality in a process by which a recognized face,
and the quality of its associated memory (i.e., positive or negative),
absolutely over-rules the inference that would have been made by
stereotyping based on group identity.
According to this definition, Fast Acceptance by Common Experience
refers to rapidly formed recognition-based classifications of others’
quality (e.g., an “acceptable” versus “unacceptable” neighbor)
without regard to group identity, when classifying those with whom
face-to-face experience has taken place in the past. When classifying
those whose faces are unrecognized, classification continues strictly
according to group identity (i.e., ethnic stereotyping). When an
unrecognized other person is to be classified, the FACE-recognition
heuristic reduces to stereotyping based solely on group identity,
exactly the same as in the classic Schelling model. However, when
there is even a small amount of shared experience, the quality of that
shared experience from the past determines how other people are
classified. Classifications based on recognition memory
lexicographically over-rule group identity, which is the basis for
classification of unrecognized agents in both FACE and classic
Schelling models. Given the plausibility of the assumption that
context-specific experience from the past can influence the
classification of others, it came as a surprise to us that we could
not find any previous attempts to extend the Schelling model in this
direction.
The model shows that when agents possess face-recognition that lasts as
short as a single period (encoding a maximum of only 8 individual faces
out of a substantially larger population), this alone is enough to
produce significantly higher levels of integration. The key comparison
investigated in this paper concerns this variable degree of recognition
memory (e.g., no recognition memory as in the classic Schelling model
versus any positive number of periods for which the faces of those one
encounters remains coded in memory). By introducing variable
recognition memory as a representation of heterogeneity in real-world
environments (which sometimes have few, sometimes many, opportunities
for random face-to-face encounters with other-type agents), the model
investigates a novel source of systematic variation into the otherwise
classic model of segregation.
The motivation for studying the effect of recognition classification on
segregation is to better understand why some real-world environments
succeed at achieving sustained levels of cross-group interaction (i.e.,
high levels of integration) while others seem to be locked into a
stubbornly unchanging pattern of segregation. The model is intended to
contribute substantively and constructively to policy analysis with a
simple message, namely, that we can, relatively cheaply, design
institutions that produce modest opportunities for face-to-face
encounters with members of other groups. Then, to the extent that
people use an acceptance rule based partially on recognition, random
face-to-face inter-group mixing could potentially generate large and
stable levels of integration that are too pessimistically ruled out by
the vast majority of studies based on Schelling’s
model.
The paper is structured as follows. We outline the classic Schelling
model of neighborhood segregation, review previous research related to
our extension of this paradigm, and present the limitations of the
classic Schelling model (mismatch between its predictions and real
world segregation data) that motivate our extension. We then introduce
the FACE-recognition heuristic and specify the recognition-augmented
Schelling model, an encompassing model that nests the classic Schelling
model as a special case. Subsequently, we present a series of
agent-based simulations demonstrating the effect of
agents’ recognition memory and decision rules (the
micro-level) on their spatial distribution in the environment (the
macro-level).
2 Neighborhood segregation: Schelling’s classic model
Neighborhood segregation continues to be a relevant public policy issue
(Alesina et al., 1999; Baughman, 2004; Brender, 2005; Musterd et al., 1999;
Nechyba, 2003), and recent work in economics, sociology and related
social sciences (Fossett 2006; Pancs & Vriend, 2007; Vinković &
Kirman, 2006; Zhang 2004a, 2004b, in press) indicates that
Schelling’s ingenious model continues to play an
influential role today.1
Schelling’s neighborhood segregation model consisted of
a thought experiment showing that, even when no individual has a
preference for segregation (i.e., an aversion to living near members of
a different ethnic group), high levels of unintended segregation are
very likely to occur. This basic result has been confirmed by many
researchers working with theoretical extensions that add new features
to Schelling’s model. Before turning to these
extensions, however, we describe the classic model.
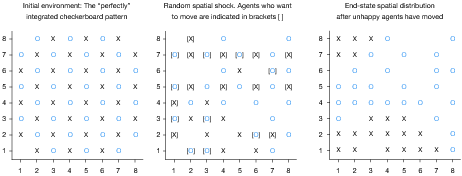
| Figure 1: A single run of the classic Schelling model: Integrated
checkerboard (left), random shock in which 20 agents disappear and
5 reappear (center), and end-state environment whose integration
has unraveled to a high degree of segregation (right). |
Consider a G-x-G square lattice with a total
number of G2 locations that can be
inhabited by up to that many agents. If there are only two groups, a
majority and a minority, and if each agent belongs to only one group,
then the total number of agents, N, is the sum of the number
of majority agents, NMAJ,
and the number of minority agents,
NMIN (with N =
NMAJ +
NMIN and
NMAJ ≥
NMIN). In each period, each agent has to
make a binary decision: to stay at the current location or try to move
somewhere else. To make this decision meaningful, there must be
unoccupied locations available for agents who want to move, which
implies strictly more locations than total number of agents
(G2 >N).
Whether an agent considers his or her current location acceptable
(i.e., wants to stay or move) is assumed to depend on the proportion
of same-type agents in the immediate neighborhood. Schelling defined
an agent’s neighborhood as the locations directly proximal, or
surrounding, an agent’s location. Thus, for an agent on the interior
of the lattice representing city or society, the neighborhood consists
of the eight locations that form a small box around his or her
location.2 Agents
located along edges have smaller neighborhoods.3 An agent considers his current
location acceptable as long as the proportion of same-type agents in
the neighborhood is above the acceptability threshold
τ, which is a preference parameter of sorts indicating
the minimum acceptable fraction of neighbors who belong to the same
group type as the agent. Larger values of this threshold impose more
stringent homogeneity requirements in order to classify locations as
acceptable, implying that τ can be
interpreted as a measure of intolerance.
A sequential process then unfolds by which unhappy agents move from
unacceptable to acceptable locations, with movers picked at random from
the list of all unhappy agents and then moving to the nearest
acceptable location. Whenever an agent moves, it changes the spatial
distribution of types in other agents’ neighborhoods.
This, in turn, causes other agents to transition from happy to unhappy,
or the reverse. This feedback loop — in which individual decisions (to
stay or change locations) and the spatial geography of the environment
are jointly causal — is a primary reason why this simple model has
generated such enduring interest. Changes in the spatial distribution
of types affect individuals’ decisions about whether to
move, and individual decisions about whether to move affect the spatial
distribution of types. The distribution of types reaches a terminal
state, which completes a single run of the Schelling model, when one of
the following three conditions is met: (1) All agents are happy and
thus nobody wants to move; (2) Some agents are unhappy, but no
improving moves are possible because none of the unoccupied locations
are acceptable from the points of view of the unhappy agents; or (3)
The maximum number of iterations is reached, indicating either very
slow convergence or the presence of a cycle that will never converge to
a terminal state, which we refer to as an indeterminate
ending.4
For a population with two group types and equal numbers of each type,
one can intuitively see that maximal integration is achieved by a
perfect checkerboard pattern like the one depicted in the left panel
of Figure 1.5 In that panel, the neighborhood grid is 8x8 (with corner
locations unoccupied), implying a total of 60 possible locations,
occupied by 30 X-type and 30 O-type agents. Each agent not located on
an edge has an equal number of neighbors of each type. Now imagine
this perfectly integrated grid undergoes a random spatial
shock.6 In the simulation, this
shock is implemented by selecting 20 of the 60 agents at random,
chosen uniformly from all occupied locations without regard to type,
and removing them from the board. Then five new agents of random type
appear at randomly chosen locations, drawn uniformly from among the 24
unoccupied locations (4 unoccupied corners plus 20 newly unoccupied
locations after the disappearance of 20 agents). This run of the
Schelling model continues by forming a list of agents who want to
move. A single unhappy agent is selected at random from this list and
then moves to the nearest location that he or she considers
acceptable. If there are two or more acceptable locations with the
same minimum distance, then one is chosen at random, and the list of
unhappy agents is then updated. The number of unhappy agents,
although generally decreasing, is not monotonically decreasing,
because one agent’s move can make one or more other agents unhappy.
This process of picking unhappy agents one at a time continues until a
terminal state is reached as described above.
Figure 1 displays three (nonconsecutive) periods from a typical run of
the classic Schelling model: initial checkerboard, subsequent spatial
shock in which 11 X-types and 9 O-types disappeared and 1 X-type and 4
O-types appeared, and end-state spatial distribution. Following the
initial shock, the first period in a single round begins with decisions
made by each agent about whether he wants to move. The middle panel of
Figure 1 indicates with brackets the agents who are unhappy and want to
move. With both types’ acceptability thresholds set to
½, not all agents were happy in the initial state,
although the post-shock spatial distribution has a much larger number
of those who want to move: 22 (marked with brackets in the middle
panel of Figure 1) of the 45 agents. The right panel of Figure 1 shows
the classic result of segregation, with X-types and O-types clustered
in distinct areas and each having few or no other-type agents as
neighbors. Note that this segregated end-state distribution occurred
despite the willingness of all agents to live in a neighborhood that is
50 percent different from themselves, and despite of the fact that the
initial state was near-perfect integration.
The mathematical social sciences are rich with studies that build on
and modify Schelling’s spatial proximity model.7 Before discussing some of them in more detail, we
give an overview of parameters that have been investigated in previous
studies:
Size and shape of the spatial environment (measured by edge length
G in the case of a square lattice, or by the number of
possible locations G2):
-
Distribution of types (either given in frequencies,
NMAJ and
NMIN, or, equivalently, as total
population size, N = NMAJ
+ NMIN, plus a minority rate,
NMIN/N);
- Density, or fullness, of the environment (sometimes referred to
as occupancy rate) N/G2;
- Acceptability, or intolerance, thresholds (i.e., the minimum
fraction of same-type agents required to classify a location as
acceptable) τMIN and
τMAJ, for minority and
majority agents, respectively;
- Procedure for generating the initial distribution;
- Definition of a neighborhood;
- Other parameters needed to implement agent-based simulation,
e.g., number of runs, and maximum number of moves allowed before a
single run of the model terminates.
One surprising finding is that the Schelling model’s
basic prediction — high levels of segregation starting from virtually
any initial condition — is incredibly robust over a very large set of
parameter configurations and modifications to the model (see, for
example Epstein & Axtell, 1996). This robustness is noteworthy, given
that most agent-based simulations dealing with problems other than
segregation typically report numerous sensitivities between parameters
and the resulting phenomena of interest.
Previous studies also introduced new elements that attempt to bring the
model closer to real cities. Modifications include alternate
definitions of the spatial environment, neighborhoods, rules for moving
(e.g., simultaneous versus sequential), numbers of and overlap among
group types, noise, and vacancy rates. For example, Flache and
Hegselmann (2001) studied different shapes and definitions of
neighborhoods. Fossett (2006) and Gilbert (2002) added information
about the cost of residing at a particular location and reproduced the
prediction of large degrees of segregation. Gilbert also considered
models where neighborhood characteristics depend on recent histories,
allowing agents to switch group membership (e.g., switch ethnic
identity), leading again to high levels of segregation. Omer (2005)
analyzed what happens when group divisions are organized
hierarchically, re-producing the qualitative Schelling prediction of
segregation. Scope of vision (i.e., how agents view the boundaries of
their own neighborhoods) was analyzed in Fossett and Waren (2005) and
Laurie and Jaggi (2003), leading again to segregation. A rather large
literature has investigated different utility functions (Bøg 2005,
2006; Bruch & Mare, 2003; Pancs & Vriend, 2007), almost always
reinforcing Schelling’s prediction of high levels of
segregation. Other notable extensions include Vinković and Kirman
(2006) who draw on techniques borrowed from physics; attempts at
analytic rather than agent-based simulation characterizations of the
Schelling model’s dynamics using the equilibrium
concept of stochastic stability (Bøg 2005, 2006; Young, 1998, 2001;
Zhang, 2004a, 2004b, 2008); and the continuum models of Yizhaq et
al. (2004). The vast majority of these extensions generalizes
or reinforces the original prediction of highly segregated end-state
geographies that are unintended and produced by individuals who have no
intrinsic preference for segregation.
Parallel to these studies, a growing body of literature relates
Schelling’s model to real-world data (Bruch & Mare,
2003; Clark, 1991; Fossett, 2006; Portugali et al., 1994),
revealing an interesting clash between models and reality. In contrast
to overwhelming agreement in the theoretical literature concerning the
prediction of high levels of segregation from virtually any starting
condition, empirical measures of segregation in cross-sectional studies
of cities, countries and other social groupings show considerable
heterogeneity (Huttman et al., 1991). For instance, Ellen
(1998) examined data from the 1970, 1980, and 1990 decennial censuses
and showed that racial integration in the US is not only possible but
can also be stable. She defined integrated neighborhoods as those
whose black residents constituted between 10 and 50% of the total
population and found that in 1990 almost 20% of neighborhoods included
in her study fell into this category. Half of these integrated
neighborhoods were also classified as stable, since their non-Hispanic
white population did not change by more than 10% between 1980 and
1990. Glaeser and Vigdor (2001) analyzed U.S. 2000 Census data
focusing on black/non-black segregation. They reported that
segregation is currently at its lowest point since 1920, primarily due
to formerly homogeneous white neighborhoods attracting non-white
residents. The authors noted considerable geographical variation in
this process, with the Western and Southern US achieving greatest
levels of integration while the Northeast and Midwest remained
segregated. Sethi and Somanathan, (2004) modeled preferences with both
neighborhood affluence and ethnic composition in the utility function,
showing that segregation may increase even as income levels converge,
due to the nonmonotonic relationship between income gaps and geographic
segregation. It should be acknowledged that, although relatively rare
in the segregation literature, a handful of studies present conditions
under which higher rates of integration are indeed possible, although
still not likely or predicted in any strong sense (Sethi & Somanathan,
2004).
This disparity between the Schelling model’s predictions
and wide variation in real world integration is frequently overlooked.
Instead, based on considerable evidence that discriminatory forces in
contemporary societies, including Obama-era US society, continue to
play a regrettable role in many cities with entrenched ethnic
segregation, the literature tends to focus on social problems stemming
from segregation — and with good justification, given the seriousness
of these problems. Examples include long-term joblessness, single
parenthood, school drop-outs (Cutler & Glaeser, 1997; Nechyba, 2003),
problems in tax collection (Brender, 2005), and reduced chances of
positive economic outcomes among the poor together with alienation
among the well-off (Atkinson & Flint, 2004). Given the practical
importance of attenuating segregation’s detrimental
effects on social cohesiveness, it is understandable that the Schelling
model, which predicts the segregation that these policies aim to
assuage, plays a prominent role in this literature. From a theoretical
point of view, however, it is nevertheless unsatisfying that the model
cannot provide convincing explanations for why some places are
relatively integrated while others remain starkly segregated. We now
propose our extension of the classic Schelling model that aims to make
a step in exactly this direction.
3 Extending the classic Schelling model by FACE-recognition
If there were no constraints in terms of time and available information,
we could form our attitudes towards others by collecting all possible
information about them and their past behavior. But time and
information-processing constraints typically allow us to use only a
very limited set of information, categorizing others at least in part
using stereotypes (Dovidio, Glick, & Rudman, 2005). Some suggest that
cognitive mechanisms underlying stereotyping also produce beneficial
results in certain contexts (e.g., Schneider, 2004).
The fundamental distinction between “us” and “them” (i.e., between
in-group and out-group members) is documented in rich and often
disturbing detail (Esses et al., 2005; Sherif et al., 1961; Tajfel et
al., 1971; Tajfel & Turner, 1979; Turner et al., 1987). There is,
however, abundant evidence demonstrating that people are not locked
into their prejudices and stereotypical thinking.8 Berg, Abramczuk and Hoffrage
(in press) provide examples from history and literature illustrating
that people frequently make exceptions, in the form of positive
assessments of some out-group members, without changing or modifying
their negative stereotypes about the out-group as a whole. The large
literature on acceptance (e.g., Brewer & Miller, 1988; Hewstone,
1996, Miller, 2002; Rothbart & John, 1985) provides relevant
background for our extension of the Schelling model. On the one hand,
people can be deeply prejudiced and show blanket disdain of other
groups, ranging from avoidance to full-blown hatred (e.g., of blacks,
whites, Jews, Muslims, poor people, homosexuals, etc.). On the other
hand, the same people can be willing, and even enthusiastic, to build
friendships across these very same group boundaries.
Drawing on previous work documenting the important role of recognition
in a variety of inferential and decision contexts (Berg & Faria, 2008;
Bruce & Young, 1986; Semenza & Sgaramella, 1993; Semenza & Zettin,
1989; Schweinberger et al., 2002), we conducted a series of
computer simulations aimed at demonstrating how the FACE-recognition
heuristic can produce a much wider variety of spatial patterns of
integration and segregation that are systematically linked to
parameters in the model.
To simplify notation, we use friend as a short-form synonym for
desirable neighbor. Thus, in the classic Schelling model, friends of
agent i consist of all co-ethnics (i.e., other agents who
belong to the same group as agent i.) A location is
acceptable if and only if the proportion of friends in the
neighborhood,
Nfriends/Nneighbors,
weakly exceeds that agent’s acceptability threshold τ,
and unacceptable otherwise.
In the FACE-recognition extension of the model, the same threshold rule
for determining whether a location is acceptable provides the crucial
behavioral element, but with one important modification concerning how
agents classify friends and nonfriends, which is depicted in the
flow-chart in Figure 2. The recognition-augmented Schelling model
assumes that agents are endowed with a small amount of memory about
other agents they recently encountered. Each agent’s
memory stores information about these agents who are recognized from
the K most recent neighborhoods and also records whether a
particular agent is most recently recognized from an acceptable or
unacceptable neighborhood. Agents who are recognized from an
acceptable neighborhood in the past are counted as friends, no matter
whether they are same-type or other-type. Agents who are recognized
from an unacceptable neighborhood in the past are counted as
nonfriends, no matter whether they are same-type or other-type.
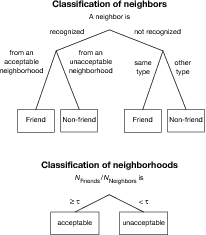
| Figure 2: Recognition heuristic for classifying
neighbors as friends or nonfriends (upper panel), and classifying
locations as acceptable or unacceptable (lower panel). How a potential
or actual neighbor is classified depends critically on recognition; if
recognized, classification as friend or nonfriend depends on
acceptability of the neighborhood from which that agent is most
recently recognized; if not recognized, classification depends on group
identity just as in classic Schelling. To determine whether a
potential or actual neighborhood is acceptable, the proportion of
friends among all neighbors is compared to the acceptability threshold
τ . |
Note that the strict ordering of the FACE-recognition variant of the
model, in which previous experience with an individual agent trumps
this other agent’s group membership, is akin to simple heuristics that
implement one-reason decision making (Gigerenzer, Todd, & the ABC
Research Group, 1999) and consistent with the theoretical finding that
ignoring information can be beneficial (Berg & Hoffrage, 2008).
Further note that the FACE-recognition model can lead to states of
happiness that differ from those in the classic Schelling model.
Consider an agent who is surrounded by a majority of other-type agents
whom he knows from a neighborhood in which he was happy. This agent
would be unhappy in the classic model but happy in the
recognition-augmented extension. Similarly, an agent who is
surrounded by a majority of same-type agents is always happy in the
classic Schelling model, but may very well want to move away in the
recognition-augmented extension if those co-ethnics are remembered
from a neighborhood in which he was previously unhappy.9
It is important to note that this new way for agents to be happy about
a particular location does not trivially lead to more happiness and
therefore more integration — simply because there is also a new way
to be unhappy. A priori, the recognition step in the classification
of locations could just as well lead to more unhappiness and
segregation.
When encountering unrecognized agents, the FACE-recognition model
reduces to the classic Schelling model. Cases of remembering another
agent from two previous neighborhoods in the past K periods
are extremely rare, but in the event that an agent is recognized from
both good and bad neighborhoods, only the quality of the most recent
memory matters for classification. This nested structure of the two
models can be formalized using a memory span parameter, which specifies
how many previous periods are stored into each agent’s
memory. The classic Schelling model is then recovered from the
FACE-recognition model if this memory span parameter is set to zero,
which implies that each agent recognizes no other agents and,
consequently, all friend/nonfriend classifications are based solely on
group identity.
When evaluating the acceptability of neighborhoods with one or more
recognized agents, the changes that take place are few in number and
mostly very local. The results below, however, show that these small,
local changes lead to surprisingly large macro-level changes in the
spatial geography of the environment. The micro and macro levels are
connected by a jointly causal loop (Coleman, 1994) that generates
co-evolution of individual behavior and the external environment. In
other words, the macro pattern in the neighborhood influences the level
of happiness experienced at the micro level. In turn, the happiness
experienced at the micro level influences decisions to move, which
completes the co-evolutionary loop by reformulating the composition of
neighborhoods that constitute the macro level.
4 Pitting the FACE-recognition
model against the classic
Schel- ling model: Simulation results
4.1 Measures of end-state integration
The three periods of a single run depicted in Figure 1 show a stark
contrast between initial and end-state spatial distributions. To make
sure that such contrasts are systematic and not the result of mere
chance occurrences, we repeat these simulations and report empirical
distributions for two different measures of end-state integration
across many runs. Each run includes (as a control condition) the
classic Schelling model with no recognition memory and (as a treatment
condition) the FACE-recognition model with at least one period of
memory. In every run, the two conditions begin with the same
integrated checkerboard and are then subjected to the same random
spatial shock. In other words, exactly the same spatial shock is used
to initiate both control and all treatment conditions for each run,
enabling comparison of macro-level consequences of the FACE-recognition
heuristic starting from exactly the same initial world.
To describe such end-state spatial distributions, Pancs and Vriend
(2007) use six segregation measures, recognizing that they are highly
correlated while emphasizing different aspects of inter-group mixing
in the lattice environment. We turned their segregation measures into
integration measures, that is, our coding is such that high values
indicate high integration rather than high segregation. We focus on
two of these measures: Other-Type Exposure and Contact with at least
One Other.10
Other-Type exposure (OT) is the mean fraction of
other-type agents as neighbors, averaged over agents. To compute
OT on a spatial distribution, one computes for each agent
i the number of other-type agents in the neighborhood,
NOT,i, and the total number of
neighbors, Ni. Agent i’s
fraction of other-type agents in his neighborhood is simply
NOT,i/Ni,
and OT is computed as the average across agents:
Σi(NOT,i/Ni)/N.
Contact with at least One Other (COO) measures the
fraction of agents whose neighborhood includes at least one other-type
agent. To calculate COO, let
COOi = 1 if
NOT,i > 0, and
COOi = 0 otherwise. Thus,
COOi is an indicator variable coded
as 1 if agent i has one or more other-type neighbors and zero
otherwise. Then COO =
ΣiCOOi
/N. The complement, 1-COO, is the fraction of agents
who are absolutely segregated, that is, live entirely isolated from
other-type agents.
For a given parameterization of the model, there is considerable
variability in these integration measures, due to two sources of random
variation: spatial shocks that generate the initial condition for each
run, and random selection of agents from the list of those who want to
move. Once the terminal state is reached in control and treatment
runs, a single observation of the two integration measures is recorded
for the control and each treatment run. Thus, after 100 runs, two sets
of histograms are available, one displaying histograms of end-state
OT for control and treatment conditions, and one displaying
COO for control and treatment conditions.
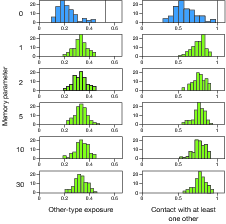
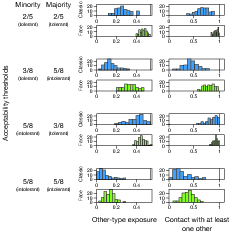
| Figure 3: Histograms of end-state integration as
captured by two dependent variables (Other-type exposure and Contact
with at least one other) in six memory treatments. When the memory
span is set to zero, the FACE-recognition model reduces to the special
case of the classic Schelling model. Memory spans of the previous 1,
2, 5, 10, or 30 rounds are variants of the FACE-recognition model.
Unless otherwise stated, the parameter values here and in the following
figures are: 8x8 grid, 30 of each type in the initial checkerboard, 20
randomly disappearing, 5 re-appearing, and acceptability thresholds for
both types of τ = 1/2. |
4.2 End-state integration as a function of memory
size
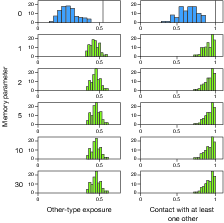
| Figure 4: Histograms of end-state integration when
agents have a lower acceptability threshold τ .
Parameter values are the same as in Figure 3, except for τ
which is set here to 2/5. |
We start our investigations with the question of how different
quantities of recognition memory affect end-state integration. We
implemented six memory treatments, starting with zero memory (which
corresponds to the classic Schelling model), followed by the first
treatment condition (FACE-recognition with a memory span of one
period), ranging upward through a memory span of 30 periods. A memory
span is the number of periods an agent is able to look back to
determine whether or not a current neighbor was already a neighbor in
the past, and if so, whether this memory occurred in an acceptable or
unacceptable neighborhood.
Figure 3 shows histograms of end-state integration for the six memory
conditions. Large differences between control (classic Schelling,
when the memory span is set to 0) and treatment runs
(FACE-recognition, when the memory span parameter ≥ 1) are
visible, indicating a large effect that is both statistically and
substantially significant. Another striking feature of Figure 3 is
that a little memory (e.g., the capacity to remember one or two
periods into the past) has almost the same effect as lots of memory.
Thus, introducing a small amount of recognition memory leads
immediately to a discontinuously large, or “quantum”, change in the
end-state spatial distribution’s level of integration. Additional
amounts of memory have very limited effects on integration. When
interpreting Figure 3, it is useful to be clear about the benchmarks.
The vertical lines in the first row of histograms, at 0.53 and 1.00,
respectively, show the levels of integration in the “perfectly
integrated” checkerboard neighborhood before the random shock (the
same applies to Figures 4, 5, and 7). In the post-shock neighborhood,
these upper bounds are not always attainable because the number of
agents has typically changed. Better benchmark therefore are the
starting levels of integration directly following the initial
shocks — these had ranges of 40 to 55% (with mean of 48%) for
Other-Type exposure, and 82 to 100% (with mean of 94%) for Contact
with at least One Other. For each of the two dependent variables,
other-type exposure and contact with at least one other, the median of
the FACE-recognition extension falls about in the middle between the
median of the classic Schelling and the respective benchmark.
4.3 End-state integration as a function of the
acceptability threshold
We now turn to the question whether small, local changes in the
classification of locations (as acceptable or not) generate sizable
changes in end-state integration relative to the control runs. As
Figure 4 shows, a slight relaxation of all agents’
acceptability thresholds from 0.5 to 0.4 has enormous effects. With
this slightly more tolerant threshold, the classic Schelling
model’s end-state integration shifts very slightly
upward (compared to Figure 3), continuing to reflect the
“unraveling” from perfect
integration to unintended segregation. In contrast, the
FACE-recognition model shows much greater sensitivity to reductions in
intolerance, which shift the integration distributions shown in the
histograms to near maximal levels, with large clusters concentrating
around (and sometimes scattering above!) the initial-state levels of
integration. As in Figure 3, these initial-state levels of
integration, which can be regarded as benchmarks for maximal post-shock
integration, are indicated by vertical bars in the first row of the
histograms. They are never achieved as levels of end-state integration
in the classic Schelling model, but are regularly achieved, and
sometimes even surpassed (for Other-type-exposure), by the
FACE-recognition model.
Next, we introduce differences between majority and minority
agents’ acceptability thresholds. Because we have
already established that any increase in memory size beyond 1 has
little effect, we explore the effect of such differences between
majority and minority agents only for memory sizes of zero (the classic
model) and five (for the FACE-recognition model). Figure 5 presents
four configurations of acceptability thresholds. In the first
configuration (τMIN =
τMAJ=2/5), both minority and
majority agents are more tolerant (than the τ =
½ benchmark case), which produces a large difference
between control and recognition treatments. In the second
configuration (τMIN = 3/8 and
τMAJ = 5/8), minority types
are more tolerant and majority types less tolerant, which produces
another large treatment effect (even larger than the first
configuration in many runs), but with slightly lower levels of
end-state integration in both cases. In the third configuration
(τMIN = 5/8 and
τMAJ = 3/8), minority agents
are less tolerant and majority types are more tolerant. Because, by
definition, most agents are majority types, and because they are more
tolerant in this third configuration, the control runs have much higher
levels of end-state integration and therefore produce smaller treatment
effects (measured as the horizontal difference between distributions,
or end-state integration in recognition runs minus end-state
integration in control runs). In the fourth configuration
(τMIN =
τMAJ = 5/8),
both types are less tolerant, which produces lower levels of end-state
integration in all cases, but a still noticeable treatment effect.
| Figure 5: Histograms of end-state integration measures
as a function of acceptability thresholds (memory span = 5). |
We measured treatment effects in a variety of other configurations of
acceptability thresholds, which reinforced two key findings visible in
Figure 5. As soon as there is enough intolerance to produce unraveling
of integration to segregation in the classic Schelling model, the
effect of memory on end-state integration is large, decreasing steadily
as all agents become less tolerant (i.e., holding both
types’ τ thresholds equal and
increasing them toward 1). The second interesting result is the
asymmetric effect of heterogeneous intolerance or acceptability
thresholds. When minority agents are more tolerant and majority agents
are less tolerant,11 the treatment-control difference is much larger
than if the acceptability parameters are switched between types (so
that minorities are less tolerant and majorities are more tolerant).
One reason why the treatment-control difference is small when only
majorities are more tolerant is that tolerant majorities push the
control-treatment levels of integration higher, thereby reducing the
difference due to floor effects. Another reason is that most available
locations tend to be majority-type heavy, by definition of there being
more majority types. Therefore, when minority agents are less
tolerant, more moves are required to find acceptable neighborhoods for
all agents, and greater spatial concentrations of minorities are
produced than would be the case for the same sized decrease in
tolerance among majority types.
4.4 Dispersion and time to reach convergence as a
function of memory size
Another interesting feature visible in Figures 3, 4, and 5 is that, in
every single treatment-control comparison and for each of our
integration measures, the runs with recognition memory produce
dramatically less dispersed distributions. In many cases, the classic
Schelling model’s end-state integration distributions are more than
twice as dispersed as the treatment distributions. This reduction in
dispersion in the FACE-recognition model is important because it
tightens the link between model parameters and the dependent
variables. In other words, the FACE-recognition model provides a much
higher signal-to-noise ratio, where “signal” is interpreted as a
change in the model’s parameters and “noise” is the dispersion in
end-state integration due to random effects such as the random spatial
shock, random ordering of when unhappy agents get to move, and random
choice of locations when a mover has more than one minimum-distance
acceptable location.
Related to the reduction of dispersion in the variables measuring
end-state integration, the introduction of recognition memory in the
model also leads to a dramatic reduction of the dispersion of the
number of iterations needed to reach convergence. Fewer moves are
needed to reach convergence in the FACE-recognition model, and the
distribution of number of moves to convergence is far less dispersed
than in the classic Schelling model. As can be seen in the first
column in Figure 6, the range of number-of-moves-to-reach-convergence
shrinks from roughly the interval [0, 30] to [10, 20]. That 2/3
reduction in range coincides with a clear reduction in the modal number
of moves — from more than 20 in the classic Schelling model to
somewhere around 15 or 16 once recognition memory is introduced.
| Figure 6: Histograms of number of moves to reach
convergence, by memory and acceptability threshold τ
(memory span = 1). |
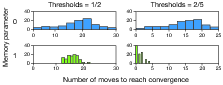
Comparing the two histograms within the first row of Figure 6, one sees
that reducing the acceptability threshold reduces the number of moves
needed to reach convergence in the classic Schelling model by roughly
5. However, this reduction in moves needed to reach convergence is
modest when compared to the dramatic decrease when the memory span
parameter moves from 0 to 1 (or any positive integer, which produces a
nearly identical reduction in moves). Thus, recognition memory
increases end-state integration, reduces dispersion of integration, and
dramatically reduces the number of moves to reach convergence.
Recall that the dynamics come to a terminal state in one of three
ways: (1) happy convergence; (2) unhappy convergence; and (3) the
maximum number of iterations allowed by the program reached without
achieving convergence. An important difference between control and
treatment runs is the relative frequency of happy versus unhappy
convergent outcomes.12 In the classic Schelling model 10 to 90 percent
of runs end in unhappy convergences depending on acceptability
thresholds and neighborhood density, typically where minorities cannot
find any available locations with enough minority neighbors. In the
recognition treatments (i.e., memory span parameter > 0),
unhappy convergence occurred 1 to 3 out of a total of 100 runs across
all parameterizations reported in these tables.
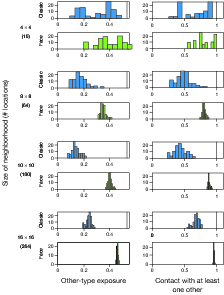
| Figure 7: Histograms of end-state integration showing
that the effect of recognition memory on end-state integration
increases with neighborhood size (memory span = 5). |
4.5 Integration as a function of the number of
locations
Skeptics might worry that face-recognition is more important in small
places because the fraction of all residents that are recognized is
higher. As the number of locations (i.e., city size) increases, the
fraction of all agents that any one particular agent can recognize
approaches zero. One might therefore question whether recognition
effects could withstand the test of scaling up to larger and larger
sized environments. Figure 7, however, shows counterintuitively that
recognition has a more dramatic effect, the larger the grid is. This
figure was constructed as follows. Grid-size took on the values 4, 8,
10 and 16, resulting in numbers of locations of 16, 64, 100 and 256.
The numbers of agents who randomly disappear and reappear in creating
initial spatial shocks are, in all cases, proportional to the benchmark
of Schelling’s 8x8 setup with 20 of 60 (33%)
disappearing, 5 of 60 (8%) reappearing, and finally arriving at a
total number of agents equal to 45 of the original 60 (or 75%) of the
cornerless checkerboard population. Thus, as the grid size ranges over
4, 8, 10 and 16, the parameter indicating the post-shock number of
agents takes on the values 9 [= 0.75(42-4)], 45 [=
0.75(82-4)], 72 [=
0.75(102-4)], and 189 [=
0.75(162-4)].
The resulting histograms show large, persistent, and ever-more precise
(i.e., less dispersed) differences in end-state integration. Less
dispersion implies that horizontal differences between histograms
become less and less the result of noise from randomization steps in
the simulation. Thus, large recognition effects reported earlier
should not be dismissed as mere small-world phenomena and, instead, can
be viewed as broadly applicable to groups of varying sizes — quite
possibly including large metropolitan cities.
4.6 End-state/initial-state preservation of
integration as a function of shock size
The results presented so far share one important feature, which is the
magnitude of the spatial shock (1/3 of the agents randomly moved at the
initial stage). In this section, we examine the sensitivity of our
reported treatment-control differences with respect to shock size.
Schelling emphasized that even very small shock sizes could produce
dramatic unraveling from the integrated checkerboard to stark
segregation. At the other extreme, as the shock size approaches 100
percent, the post-shock spatial distribution becomes increasingly close
to a uniform distribution in which agents are placed in random
locations without regard to group type.
Figure 8 shows the fraction of post-shock integration that is
preserved in end-state integration as a function of shock size. The
x-axis shows shock sizes of 10, 20, 33, 50, 66, 80 and 90 percent,
ranging from near perfect integration to near random initial
conditions. The y-axis shows end-state integration divided by
post-shock integration, which measures the percentage of integration
preserved in the process of moving to a convergent end-state spatial
distribution. The median value of the percentage of integration
preserved is indicated by “F” for the FACE-recognition treatment and
“C” for the classic Schelling, or control, treatment. In addition,
Figure 8 shows 80 percent confidence bands representing the
10th and 90th percentiles for each
set of 100 runs. In each set of 100 runs, the C and F treatments
begin with the same spatial shocks but evolve according to
classic-Schelling or recognition-augmented rules for classifying
locations as acceptable or not. For the 10 percent shock, the
distributions of preserved integration are far apart, with entirely
non-overlapping 80-percent confidence bands in all three integration
measures.
| Figure 8: Median fraction of post-shock integration
preserved in the end-state, indicated by
"F” for FACE recognition treatment and
"C” for Classic Schelling Model, with 80
percent sample-distribution intervals (memory span = 5). Shock size on
the x-axis represents the fraction of the population perturbed away
from their respective beginning positions in the perfectly integrated
checkerboard. |
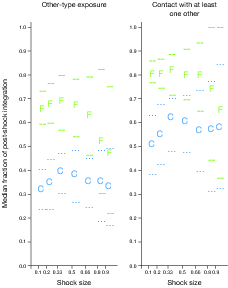
As shock size increases, two countervailing effects are noteworthy.
First, because the post-shock (initial) distribution gets further away
from perfect integration, end-state integration must be further away
from perfect integration as well. All else equal, this would reduce
the level of end-state integration. But because post-shock integration
(directly following the shock and not at the end-state) is the
denominator of the ratio depicted on the y-axis of Figure 8 and is
negatively affected by shock size as well, this would increase the
values plotted on the y-axis, all else equal. As shock size approaches
100 percent and the initial post-shock distribution becomes completely
random, the treatment effect disappears, as intuition would suggest,
indicated by increasing overlap between control and treatment
distributions. It is rather remarkable, however, that large
treatment-control differences persist for very large magnitude shocks,
affecting 50 percent or more of the population with an involuntary
move.
4.7 Effects of FACE recognition on the micro
level
Until this point, we have adopted a macro-perspective and analyzed
spatial distributions in the environment summarized by integration
measures. In this section, we adopt the micro-perspective of an
individual agent to see what the effects of recognition memory are on
acceptance by individuals of their locations. Grid-size is once again
8, with 45 post-shock and acceptability thresholds set to 1/2.
Figure 9 shows the time path of the number of agents who want to move,
averaged period by period over 100 control and treatment runs,
respectively. The 80-percent confidence bands appear only until the
period at which the very earliest run among the 100 runs converged. At
that point, the sample size (of runs at a particular period on the way
toward convergence) changes because fewer and fewer of the 100 runs
produce observations as the period number increases. The median number
of agents who want to move is plotted for every number of periods at
which there was at least one observation. The median reported at each
period is computed among only those runs that reached that number of
periods. Were we to continue counting converged runs at their
end-state values (e.g., continuing to count the number who want to move
as zero where happy convergences have already occurred), then the
median number would approach zero more quickly than depicted in Figure
9.
| Figure 9: Median number of agents who are unhappy and
thus want to move as a function of time (memory span = 5). |
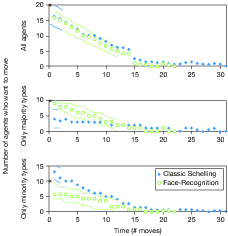
Figure 9 shows an interesting asymmetry between minority and majority
movers. When counted together in the upper time series, there is
little within-period difference in the numbers of movers between
control and treatment, except that the number of periods to reach
convergence is smaller in FACE-recognition treatments. The middle and
lower time paths in Figure 9, however, reveal significant within-period
control-treatment differences with respect to the numbers of minority
and majority agents, respectively, who want to move. Once recognition
memory is introduced, there are significantly more unhappy majority
agents in early rounds (because there are more negative shifts from
friend to nonfriend among same-type neighbors) and significantly fewer
unhappy minority agents (because there are more ways to be a happy
minority agent as the result of nonfriend-to-friend shifts among
other-type agents, thanks to recognition memory). The number of
unhappy majority agents decreases rapidly in treatment runs, however,
resulting in faster convergences and an increased rate of happy
convergences. This period-by-period view along the path toward
end-state convergence reveals, once again, that a small amount of
memory which generates very few changes in terms of individual-level
classifications nevertheless produces large effects on
individuals’ happiness with their locations.
| Figure 10: Median other-type exposure as a function of
time (memory span = 5). |
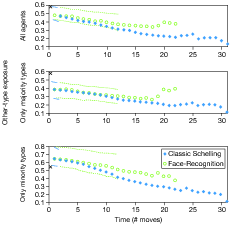
Figure 10 shows similar period-by-period distributions in control and
treatment runs for integration as measured by OT. The
upper-most time series shows how integration changes along the time
path. The second and third panels of Figure 10 break out integration
by majority and minority, computing integration strictly among
majorities and minorities, respectively. One observation from Figure
10 is that treatment-control differences in integration are nonlinear
with respect to time, diverging sharply in the final few periods before
convergence, especially for majority types. These time-path data
indicate that later movers — especially unhappy majority types — make
late-period moves that are responsible for a disproportionately large
share of the increase in integration along that
variable’s time path. Meanwhile, minority
types’ level of integration reduces at a slower rate,
steadily making larger and larger contributions to aggregate
integration. The picture that emerges is one of gradual mixing by
minorities but with rather more chaotic reductions followed by
subsequent increases in majority types’ level of
integration.
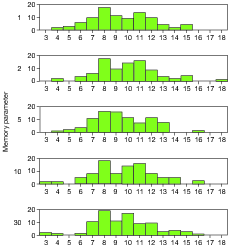
Figure 11 provides one final piece of evidence regarding the effect of
adding the first unit of memory contrasted with null effects of
subsequent additions to memory. Figure 11 shows the number of agents
who, in their end-state locations, would have wanted to move in the
classic Schelling model but are made happy thanks to recognition
memory. Across the five memory span parameters that we implemented,
the number of such agents is about 9 out of 45 (i.e., about 20%). As
the memory span increases from 1 to 30, there is a slight reduction in
the distribution’s dispersion, but no apparent change
in its position, indicating that this number is largely independent of
the amount of memory with which agents are endowed.
| Figure 11: Made happy by memory: Histograms of
end-state number of agents who would have wanted to move in the classic
Schelling model but, by using the FACE-recognition heuristic, consider
their current neighborhood acceptable. |
5 Discussion
In this paper, we introduced the FACE-recognition model
(Fast-Acceptance-by-Common-Experience), which extends the classic
Schelling model of neighborhood segregation by giving agents a small
amount of FACE-recognition memory. In this extension, agents classify
neighborhoods the same way as in the classic Schelling model, by
computing the fraction of all acceptable neighbors and comparing this
with an acceptability threshold. Moreover, like in the Schelling
model, unrecognized neighbors are classified as acceptable if they are
same-type agents, and as unacceptable if they are other-type agents.
Unlike in the Schelling model, however, recognition-augmented agents
are able to recognize agents who were neighbors in previous periods and
classify them as acceptable if they were neighbors in acceptable
neighborhoods and as unacceptable if they were neighbors in
unacceptable neighborhoods. This classification of recognized agents
lexicographically overrules classification based on their group
identity. Even though this extension of the classic Schelling model
leads to only a small number of reclassifications of nearby agents in
which group identity is overruled, it nevertheless results in
large-scale shifts in end-state spatial distributions. These end-state
distributions feature much higher levels of inter-group mixing as
measured by two quantitative measures of integration that are standard
in the segregation literature, faster convergence to stable states, and
higher signal-to-noise ratio in terms of the influence of changes in
model parameters versus noise from randomization steps in the sequence
of moves. The effects persist across various acceptability thresholds,
grid sizes, and shock sizes.
The FACE-recognition heuristic is similar but not identical to the
recognition heuristic studied in Goldstein and Gigerenzer (1999, 2002).
Goldstein and Gigerenzer proposed that recognition is an evolved
capacity that can be used to make accurate rankings among pairs of
objects whenever there is correlation between recognition and a
criterion with respect to which objects are to be ranked. Reasoning
according to the recognition heuristic is a one step process: if one
of the two objects is recognized and the other is not, the one that is
recognized is judged to have larger value. An important feature of the
recognition heuristic is the fact that it is non-compensatory. The
moment one object is recognized and the other not, the decision, or
choice, or classification is determined. No other information enters
the decision process and therefore no further information needs to be
weighted, or has the potential for overruling the recognition-based
decision. We use the same non-compensatory, or lexicographic,
mechanism in the FACE-recognition model, which can be represented with
a non-compensatory decision tree as in Figure 2. The difference is
that for the FACE-recognition heuristic, mere recognition does not
necessarily lead to a positive classification; instead, the attitude
toward others is modified according to whether shared common experience
had a positive or a negative flavor.
The FACE-heuristic also relates to important work on the forefront of
game theory called inductive game theory, which models agents playing
games that they do not fully know or understand (Hanaki, Ishikawa, &
Akiyama, 2009; Kaneko & Kline, 2008). In our model, agents are
endowed with a uniform ethnic preference parameter and identical
recognition-based decision process, and yet different play-path
histories among agents lead them to have different views of their
location and the surrounding environment.
The FACE-recognition heuristic relates significantly to
Aktipis’ (2006) evolutionary game theory model in which
agents repeatedly play Prisoner’s Dilemma while using
different decision rules for choosing with whom to play in each round.
Numerous strategies in such population games have been studied in an
attempt to explain the real-world observation that people, even in
anonymous one-shot games, often play non-Nash strategies to achieve
greater cooperation than is predicted by standard game theory (see, for
example, Bowles & Gintis, 2004; Nakamaru & Kawata, 2002; Sudgen,
1986). Aktipis considers two simple strategies, D-mem and C-mem, that
rely on recognition to choose with whom to play the game. The D-mem
strategy for accepting partners is to always accept an unrecognized
individual as a playing partner and then cooperate. Whenever a partner
defects, D-mem records that individual’s name on the
defector list, thereby excluding this individual as a partner in the
future. Once the agent’s memory limit is reached,
D-mem removes the oldest defector from the list to record new ones.
The second strategy in Aktipis (2006) is C-mem, which remembers only
the names of recent cooperators, and once its memory capacity is full,
it accepts playing partners only from the names of cooperators on that
list. A key similarity between our model and Aktipis’
is that attitudes towards others are determined by simple memories
based only on recognition and outcome of previous encounters.
Moreover, for both models it can be shown that their very modest memory
requirements and very simple decision rules lead to large-magnitude
population-level effects.
Finally, the FACE-recognition heuristic shares some commonalities with
decision processes studied by Yamagishi et al. (1999) and
Yamagishi and Kiyonari (2000) in the context of in-group boasting. In
a series of experiments (without face-to-face interaction, though),
they show that in-group favoritism occurs only when subjects expect
favorable treatment from in-group members. When other reliable
information about partners’ benevolence is available,
group membership is ignored, as it is in the FACE-recognition model.
In both empirical and theoretical forms, the decision processes are
lexicographic heuristics.
A key result of our simulations is that a very small amount of
recognition memory can produce surprisingly durable levels of
integration. Thus, when comparing environments of agents who have
opportunities to recognize even a handful of other-type neighbors with
environments whose agents do not have this opportunity, our model
identifies a new variable capable of explaining observed differences in
levels of segregation. Beyond this more realistic range of predictions
that offer a new explanation for low versus high degrees of
integration, the FACE-recognition model implies that institutions which
promote face-to-face mixing can have large effects on long-run
integration. This stands in marked contrast to the classic Schelling
model’s rather pessimistic and unconditional prediction
that all, or most, groups will unravel to unintended and high levels of
segregation.
Regarding the literature concerning policy tools aimed at fostering
integration, the extended Schelling model studied in this paper
suggests a new theoretical account for explaining why cities and other
social spheres of interaction differ in terms of inter-group mixing.
The model generates the hypothesis that locations whose histories
created above-average levels of inter-group face-to-face interaction in
the past — by historical accident or by intentional institutional
design — should have above-average levels of integration in the
present.
A large fraction of any achieved level of integration can be maintained
in the FACE-recognition model by fostering very modest quantities of
face-to-face recognition across social groups. Small amounts of
recognition robustly maintain integration in the face of significant
spatial shocks. This finding lends theoretical support also to
designed institutions in smaller-scale settings whose aim is to
maintain integration in the face of continual shocks to group
membership. One example is the prosaic-sounding coffee-and-cake
institution discussed in Gigerenzer (2006), which is one part of a
designed institution that attempts to generate a high frequency of
chance face-to-face encounters within large and interdisciplinary
research teams. Parks, bars, restaurants and road systems with an
unavoidable central meeting location that generate unusually high
levels of inter-group face-to-face experience doing normal, mundane
things provide other examples of environments designed to facilitate
the meeting of different group members on a regular basis. Nyden et
al. (1998) note that the existence of such places is a regular
characteristic of integrated neighborhoods. Recent evidence on social
networks using GSS data document that Americans are not as segregated
as some of the gloomiest estimates have suggested, although these
results motivate the study’s authors to call for
institutions (perhaps those that promote opportunities for face
recognition to develop would function well in this regard) and new
attitudes that assuage the documented tendency to separate from those
who differ on race, politics and religion (DiPrete, Gelman, McCormick,
Teitler & Zheng, 2010).
There are several ideas that are natural to consider for modifying or
extending the FACE-recognition model. We mention a few of them here
without further analysis. In the real world, intergroup dynamics are
affected not by a single shock, but by a sequence of occasional shocks.
These occur when institutions change or other large-magnitude shifts
in the environment take place. For example, the moves people make are
sometimes caused by changing family structure, changes in school
quality, or job changes. It would therefore seem worthwhile to
investigate whether the large-magnitude effects of recognition memory
on end-state integration are attenuated or accentuated by repeated
shocks after specifying a reasonable stochastic process to model
repeated but occasional shocks.
Another simplification in the FACE-recognition model that might be
relaxed to better map onto real-world group dynamics is the
friend-making process. In fact, the spatial channels through which the
friend-making process unfolds could be entirely separate from the
location choice decision and subject to its own set of institutional
variables, while preserving the fundamental dependence of
classification of locations on personal lists of friends and
nonfriends. One might replace the binary friend-making process with a
probabilistic spatial structure in which close-by agents are more
likely to become friends. Such stochastic variants would extend the
geographic range of effects of friend and nonfriend lists beyond
immediately surrounding locations, although the large macro effects of
small local shifts in lists of friends and nonfriends are already
impressive.
A third extension of the FACE-recognition model concerns the question of
designing institutions that promote integration and their often
unintended consequences. One thinks of school busing programs in
post-Civil-Rights America, and the prospects of embedding more specific
geographic and institutional structure in the model to analyze the
consequences of introducing new institutions aimed at modulating levels
of inter-group. One might investigate the degree to which institutions
introduced in the real world, after being introduced in the model,
could produce simulated differences in integration that match observed
differences, say, among regions in the US or within cities in the
American South (e.g., the very different urban geographies of Dallas
and Atlanta compared with that of Memphis and Jacksonville). Deeper
differences in spatial mixing can be observed in countries like Israel,
where cosmopolitan cities such as Haifa and Hadar have modest amounts
of Arab-Jewish mixing in contrast to nearly all-Jewish cities, such as
Lod and Ramle, and all-Arab cities, such as Nazareth and Shfa Amer.
Finally, FACE-recognition’s positive effects on
integration are likely also to be observable in other macro-systems,
such as markets. The economic relevance of face-to-face encounters in
cultivating near-instantaneous sympathy and its connections to the
functioning of markets was already discussed by Adam Smith (1759/2008).
Smith can be interpreted as hypothesizing that markets may fail to
function well as they become globalized or administered in a way such
that transactions become detached from ongoing face-to-face
relationships (Harpham, 2004; Berg & Maital, 2007). Interestingly,
online auction platforms such as eBay seem to function well only
because they institutionalized a procedure to build reputation of
agents, allowing participants to share personal categorizations of
their trade partners as trustworthy versus non-trustworthy (Bolton,
Katok, & Ockenfels, 2004).
6 Interpretation and implications for institutional design
Social scientists from numerous disciplines too often treat the
Schelling model as an argument that unintended divisions between groups
occur almost inevitably (i.e., without animosity between groups as a
pre-condition). Ellen (1998), for example, writes against this
pessimistic interpretation of inevitability, describing her finding
that well integrated communities exist and thrive as
“running counter to the popular, and often
self-fulfilling, view that integration is unviable.”
For examples of the Schelling model’s role in the
rhetoric of authors espousing this view of inevitability (which, it is
important to note, does not include Schelling himself), see, for
example, the empirical studies and policy advice contained in those
studies cited in Aydinonat (2007, p. 441).
In light of the inspiring mixes of institutions found in places with
high levels of integration and our model that demonstrates a simple
mechanism (of course, not the only one) by which this can occur, we
believe that this is premature. As a proof-of-concept demonstration of
what is possible, we can look in environments with desirable levels of
integration to discover social institutions that play a beneficial role
in supporting interactions among heterogeneous types that might be
applied elsewhere. Based on the FACE-recognition model, we think that
institutional interventions that promote a moderate amount of random
inter-group mixing can, by the very simple mechanism of recognition,
help facilitate surprisingly large and durable levels of integration.
In fact, the simplicity of the recognition mechanism and what turns out
to be its surprising power to cement durably integrated communities
starting from chance face-to-face meetings gives us optimism that even
modest institutional and policy changes can provide surprisingly
salutary effects in terms of reducing ethnic segregation.
Private enterprise invests a tremendous amount on business travel and
face-to-face meetings in situations where standard contract theory
would surely suggest that firms should save money by sending the
contracts straight-away to in-house lawyers rather than cementing
relationships with face-to-face contact between the members of two
firms, which provides little if any actionable legal protection in the
event that the other party fails to perform on a contractual
obligation. While this intense investment in face-to-face contact
finds very little explanation in the social science literature, the
fact that it is common-practice in business seems to reflect the belief
and the experience of firms that such investment pays — comparable to
the observation that extending the Schelling model with
FACE-recognition makes agents more happy and the neighborhoods they
create more integrated.
We observe the mismatch between the original Schelling
model’s prediction of absolute segregation and the
reality of many different levels of integration and segregation as an
important motivation for new models of segregation that better accord
with heterogeneous segregation empirics. This raises the question of
how the model could be changed to account for social outcomes observed
in the world. The cognitive architecture that uses recognition to
accomplish so many important inferential tasks also solves important
tasks of social coordination across group-type. That is our claim, and
we think the FACE-recognition model clearly demonstrates a mechanism by
which this can occur.
There is a point of view that concerns the more general methodological
issue of models and their relationship with the complexity of the real
world. One might say that Schelling’s concern was so much to model
reality as to illustrate the possibility of surprising divergence
between (micro-) intentions and (macro-) outcomes. Even as a pure
thought experiment, we believe that the FACE-recognition model says
something interesting and relevant to multiple literatures in which
the Schelling model continues to loom large. Whereas most
modifications of the classic Schelling model proposed in this
literature reproduce the apparent robustness of Schelling’s
conclusions (i.e., from virtually all starting conditions and with
almost all parameter settings, dramatically large levels of
segregation result), the introduction of FACE-recognition shows that
chance inter-group mixing can be durable and resilient in the face of
exogenous shocks. If individual agents are endowed with just enough
memory to encode face recognition for one period, then the divergence
between intentions and outcomes is dramatically attenuated. This
result intrigues us especially in terms of institutional design. It
suggests that institutions not explicitly designed to facilitate
cross-group face-to-face contacts can nevertheless have large effects
on observed levels of integrations. For example, the soccer stadium
hosting the ethnically integrated team of Marseille, France, is
regarded as a model of successful inter-ethnic and religious comity.
Similarly, educational institutions that provide a space for
cross-ethnic face-to-face contacts appear to influence the urban
geography of US college towns with dramatically higher-than-average
levels of integration over multiple decades. Such institutions
coordinate patterns of movement through physical space in a way that
provides a modest increase in one’s chances of randomly bumping into
other-type agents, coded in memory as happy, safe, or satisfying
experiences. The mechanism that we have identified provides
theoretical justification for attributing to these institutions some
portion of the salutary effects of ordinary human contact that helps
bring us together rather than drive us apart.
References
Aktipis, C. A. (2006). Recognition memory and the evolution of
cooperation: How simple strategies succeed in an agent-based world.
Adaptive Behavior, 14, 239–247.
Alesina, A., Baqir, R., & Easterly, W. (1999). Public goods and ethnic
divisions. Quarterly Journal of Economics, 114, 1243–1284.
Allport, G. W. (1954). The nature of prejudice. Reading, MA:
Addison Wesley.
Atkinson, R., & Flint, J. (2004). Fortress UK? Gated communities, the
spatial revolt of the elites and time-apace trajectories of
segregation. Housing Studies, 19, 875–892.
Aydinonat, N. E. (2007). Models, conjectures and exploration: An
analysis of Schelling’s checkerboard model of
residential segregation. Journal of Economic
Methodology, 14, 429–454.
Baughman, R. A. (2004). Racial segregation and the effectiveness of expanding public
health insurance for children. Working Paper, University of New Hampshire.
Bayer, P, McMillan, R. & Rueben, K. (2004). What drives racial segregation?: New
evidence using census microdata. Journal of Urban Economics, 56, 514–535.
Berg, N., Abramczuk, K., & Hoffrage, U. (in press). Fast Acceptance
by Common Experience: Augmenting Schelling’s
neighborhood segregation model with FACE-recognition. In R. Hertwig,
U. Hoffrage, & the ABC Research Group. Simple Heuristics in a
Social World. Oxford University Press.
Berg, N., & Faria, J. (2008). Negatively correlated author seniority
and the number of acknowledged people: Name-recognition as a signal of
scientific merit? Journal of Socio-Economics, 37, 1234–1247.
Berg, N., & Hoffrage, U. (2008). Rational ignoring with unbounded cognitive
capacity. Journal of Economic Psychology, 29, 792–809.
Berg, N., & Maital, S. (2007). Tailoring globalization to national
needs and wellbeing: One size never fits all. Global Business
and Economics Review, 9, 319–334.
Bøg, M. (2005). Revisiting Schelling’s
spatial proximity model. Working Paper, University College London.
Bøg, M. (2006). Is segregation robust? Working Paper,
Stockholm School of Economics.
Bolton, G. E., Katok, E., & Ockenfels, A. (2004). How
effective are electronic reputation mechanisms? An experimental
investigation. Management Science, 50, 1587–1602.
Bowles, S., & Gintis, H. (2004). The evolution of strong reciprocity:
Cooperation in heterogeneous populations. Theoretical
Population Biology, 65, 17–28.
Brender, A. (2005). Ethnic segregation and the quality of local
government in the minorities localities: Local tax collection in the
Israeli-Arab municipalities as a case study. Discussion Paper, vol.
05.01, Bank of Israel.
Brewer, M. B., & Miller, N. (1988). Contact and cooperation: When do
they work? In P. Katz & D. Taylor (Eds), Eliminating racism:
Means and controversies (pp. 315–326). New York: Plenum Press.
Bruce, V., & Young, A. (1986). Understanding face recognition.
British Journal of Psychology, 77, 305–27.
Bruch, E. E., & Mare, R. D. (2003). Neighborhood Choice and
Neighborhood Change. Working Paper, California Center for Population
Research On-Line Working Papers Series.
Clark, W. A. V. (1991). Residential preferences and neighborhood racial
segregation: A test of the Schelling segregation model.
Demography, 28, 1–19.
Coleman, J. S. (1994). Foundations of Social Theory. Harvard
University Press.
Colman, A. M. (2006). Thomas C. Schelling’s
psychological decision theory: Introduction to a special issue.
Journal of Economic Psychology, 27, 603–608.
Cutler, D. M., & Glaeser, E. L. (1997). Are ghettos good or bad?
The Quarterly Journal of Economics, 112, 827–72.
DiPrete, T. A., Gelman, A., McCormick, T., Teitler, J., & Zheng, T.
(2010). Segregation in social networks based on
acquaintanceship and trust. Working Paper, Columbia University.
Dixon, J., Durrheim, K., & Tredoux, C. (2005). Beyond the optimal
contact strategy. American Psychologist, 60, 697–711.
Dovidio, J. F., Glick, P., & Rudman, L. S. (Eds.) (2005). On
the Nature of Prejudice: Fifty Years after Allport. Malden, MA:
Blackwell Publishing.
Ellen, I. G. (1998). Stable racial integration in the contemporary
United States: An empirical overview. Journal of Urban
Affairs, 20, 27–42.
Epstein, J. M. & Axtell, R. (1996). Growing Artificial
Societies: Social Science from the Bottom Up, Washington, DC:
Brookings Institution Press.
Esses, V. M., Jackson, L. M., Dovidio, J. F., & Hodson, G. (2005).
Instrumental relations among groups: Group competition, conflict, and
prejudice. In J. F. Dovidio, P. Glick, & L. A. Rudman (Eds.),
On the Nature of Prejudice. Fifty Years After Allport (pp.
227–243). Malden, MA: Blackwell.
Flache, A. & Hegselmann, R. (2001). Do Irregular Grids make a
Difference? Relaxing the Spatial Regularity Assumption in Cellular
Models of Social Dynamics. Journal of Artificial Societies and
Social Simulation, 4,
http://www.soc.surrey.ac.uk/JASSS/4/4/6.html.
Fossett, M. (2006). Preferences, social distance dynamics, and
residential segregation: Theoretical explanations using simulation
analysis. Journal of Mathematical Sociology, 30, 185–274.
Fossett, M., & Waren, W. (2005). Overlooked implications of ethnic
preferences for residential segregation in agent-based models.
Urban Studies, 42, 1893–1917.
Gigerenzer, G. (2006). Follow the leader. Harvard Business
Review, February, 58–59.
Gigerenzer, G., Todd, P. M., & the ABC Research Group
(1999). Simple Heuristics that Make Us Smart. New York:
Oxford University Press.
Gilbert, N. (2002). Varieties of emergence. Paper presented at the
Agent 2002 Conference: Social Agents: Ecology, Exchange, and
Evolution. Chicago.
Glaeser, E, & Vigdor, J. L. (2001). Racial segregation in the 2000
Census: Promising news. Brookings Institution Survey Series.
Washington: Brookings Institution.
Goldstein, D. G., & Gigerenzer, G. (1999). The recognition heuristic:
How ignorance makes us smart. In G. Gigerenzer, P. M. Todd & the ABC
Research Group. Simple Heuristics That Make Us Smart (pp.
37–58). Oxford: Oxford University Press.
Goldstein, D. G., & Gigerenzer, G. (2002). Models of ecological
rationality: The recognition heuristic. Psychological
Review, 109, 75–90.
Hanaki, N., Ishikawa, R., & Akiyama, E. (2009). Learning games.
Journal of Economic Dynamics and Control, 33,
1739–1756.
Harpham, E. J. (2004). Gratitude in the history of ideas. In R. A.
Emmons & M. E. McCullough (Eds.), The Psychology of Gratitude
(pp. 9–37). New York: Oxford University Press.
Hewstone, M. (1996). Contact and categorization: social-psychological
interventions to change intergroup relations. In C. N. Macrae, C.
Stagnor & M. Hewstone (Eds.), Foundations of Stereotypes and
Stereotyping (pp. 323–368). New York: Guilford.
Homans, G. C. (1950). The Human Group. New York: Harcourt,
Brace, & World.
Huttman, E. D, Saltman, J., & Blauw, W. (1991). Urban Housing
Segregation of Minorities in Western Europe and the United States.
Durham and London: Duke University Press.
Kaneko, M., & Kline, J. J. (2008). Inductive game theory: A basic
scenario. Journal of Mathematical Economics, 44, 1332–1363.
Laurie, A. J., & Jaggi, N. K. (2003). Role of
‘vision’ in neighbourhood racial
segregation: A variant of the Schelling segregation model.
Urban Studies, 40, 2687–2704.
Miller, N. (2002). Personalization and the promise of contact theory.
Journal of Social Issues, 58, 387–410.
Musterd, S., Premius, H., & van Kempen, R. (1999). Towards undivided
cities: The potential of economic revitalisation and housing
redifferentiation. Housing Studies, 14, 573–584.
Nakamaru, M., & Kawata, M. (2002). Evolution of rumors that
discriminate lying defectors. Evolutionary Ecology Research,
6, 261–283.
Nechyba, T. J. (2003). School finance, spatial income segregation and
the nature of communities. Journal of Urban Economics, 54,
61–88.
Nyden, P., Lukehart, J., Maly, M. T., & Peterman, W. (1998).
Neighborhood racial and ethnic diversity in U.S. cities.
Cityscape: A Journal of Policy Development and Research, 4,
1–17.
Omer, I. (2005). How ethnicity influences residential distributions: An
agent-based simulation. Environment and Planning B: Planning
& Design, 32, 657–672.
Pancs, R., & Vriend, N. J. (2007). Shelling’s spatial
proximity model of segregation revisited. Journal of Public
Economics, 91, 1–24.
Pettigrew, T. F. (1998). Intergroup contact theory. Annual
Review of Psychology, 49, 65–85.
Pettigrew, T. F., & Tropp, L. R. (2006). A meta-analytic test of
intergroup contact theory. Journal of Personality and Social
Psychology, 90, 751–783.
Portugali, J., Benenson, I., & Omer, I. (1994). Socio-spatial
residential dynamics: Stability and instability within a self-organized
city. Geographical Analysis, 26, 321–340.
Rothbart, M., & John, O. P. (1985). Social categorization and
behavioral episodes: A cognitive analysis of the effects of intergroup
contact. Journal of Social Issues, 41, 81–104.
Schelling, T. C. (1969). Models of segregation. The American
Economic Review, 59, 488–493.
Schelling, T. C. (1971a). Dynamic models of segregation.
Journal of Mathematical Sociology, 1, 143–186.
Schelling, T. C. (1971b). On the ecology of micromotives. The
Public Interest, 25, 61–98.
Schelling, T. C. (1978). Micromotives and Macrobehavior. New
York: Norton.
Schneider, D. (2004). The Psychology of Stereotyping. New
York: Guilford.
Schweinberger, S. R., Pickering, E. C., Burton, A. M., & Kaufmann, J.
M. (2002). Human brain potential correlates of repetition priming in
face and name recognition. Neuropsychologia, 40,
2057–2073.
Semenza, C., & Sgaramella, T. M. (1993). Production of proper names: A
clinical case study of the effects of phonemic cueing. In G. Cohen &
D. M. Burke (Eds.), Memory for Proper Names (pp. 265–280).
Hove, UK: Erlbaum.
Semenza, C., & Zettin, M. (1989). Evidence from aphasia for the role
of proper names as pure referring expressions. Nature, 342,
678–679.
Sethi, R. & Somanathan, R. (2004). Inequality and segregation.
Journal of Political Economy, 112, 1296–1321.
Sherif, M., Harvey, O. J. White, B. J., Hood, W. R., & Sherif, C. W.
(1961). Intergroup conflict and cooperation: The Robbers Cave
Experiment. Norman: University of Oklahoma Book Exchange.
Smith, A. (1759/2008). The Theory of Moral Sentiments.
Library of Economics and Liberty. Retrieved July 6, 2010 from
http://www.econlib.org/library/Smith/smMS1.html.
Sudgen, R. (1986). The Economics of Rights, Cooperation and
Welfare. Oxford: Basil Blackwell.
Tajfel, H., Billig, M. G., Bundy, R. P., & Flament, C. (1971). Social
categorisation and intergroup behaviour. European Journal of
Social Psychology, 1, 149–178.
Tajfel, H., & Turner J. C. (1979). An integrative theory of intergroup
conflict. In W. G. Austin & S. Worchel (Eds.), The Social
Psychology of Intergroup Relations (pp. 33–53). Monterey,
California: Brooks/Cole.
Turner, J. C., Hogg, M., Oakes, P., Reicher, S., & Wetherell, M.
(1987). Rediscovering the social group: A self-categorization theory.
Oxford: Basil Blackwell.
Vinković, D., & Kirman, A. (2006). A physical analogue to the
Schelling model. Proceedings of the National Academy of
Science, 103, 19261–19265.
Yamagishi, T., & Kiyonari, T. (2000). The group as the container of
generalized reciprocity. Social Psychology Quarterly, 63,
116–132.
Yamagishi, T., Jin, N., & Kiyonari, T. (1999). Bounded generalized
reciprocity, ingroup boasting and ingroup favoritism. Advances
in Group Processes, 16, 161–197.
Yizhaq, H., Portnov, B. A., & Meron, E. (2004). A mathematical model
of segregation patterns in residential neighbourhoods.
Environment and Planning A, 36, 147–172.
Young, H. P. (1998). Individual Strategy and Social Structure:
An Evolutionary Theory of Institutions. Princeton University Press,
Princeton, NJ.
Young, H. P. (2001). The dynamics of conformity. In S. N. Durlauf &
H. P. Young (Eds.), Social Dynamics (pp. 133–153).
Washington, D.C./Cambridge, MA: Brookings Institution Press/MIT Press.
Zajonc R. B. (1968). Attitudinal effects of mere exposure.
Journal of Personality and Social Psychology, 9, 1–27.
Zhang, J. (2004a). A dynamic model of residential segregation.
Journal of Mathematical Sociology, 28, 147–170.
Zhang, J. (2004b). Residential segregation in all-integrationist world.
Journal of Economic Behavior & Organization, 54, 533–550.
Zhang, J. (in press). Tipping and residential segregation: A unified
Shelling model. Journal of Regional Science.
This document was translated from LATEX by
HEVEA.