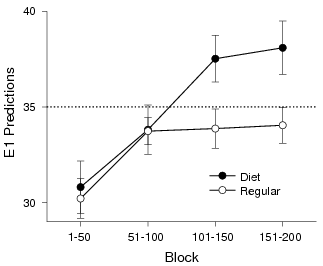
| Figure 1: E1 predictions by condition and block relative to PM. Error bars indicate SEM. |
Judgment and Decision Making, vol. 5, no. 6, October 2010, pp. 450-457.
Glucose promotes controlled processing: Matching, maximizing, and root beerAnthony J. McMahon and Matthew H. Scheel* |
Participants drank either regular root beer or sugar-free diet root beer before working on a probability-learning task in which they tried to predict which of two events would occur on each of 200 trials. One event (E1) randomly occurred on 140 trials, the other (E2) on 60. In each of the last two blocks of 50 trials, the regular group matched prediction and event frequencies. In contrast, the diet group predicted E1 more often in each of these blocks. After the task, participants were asked to write down rules they used for responding. Blind ratings of rule complexity were inversely related to E1 predictions in the final 50 trials. Participants also took longer to advance after incorrect predictions and before predicting E2, reflecting time for revising and consulting rules. These results support the hypothesis that an effortful controlled process of normative rule-generation produces matching in probability-learning experiments, and that this process is a function of glucose availability.
Keywords: matching, maximizing, glucose, probability-learning, controlled processing, automatic processing.
In two-choice probability learning (PL) experiments, one event (E1) has a better chance of occurring than the other (E2), and event likelihoods are independent of responses. A participant’s task is to predict which event will occur on each trial. Although participants could maximize hits by exclusively predicting E1, they tend to approximately match prediction frequencies with outcome probabilities for many trials (Fantino & Esfandiari, 2002). For example, if E1 occurs on 70% of trials and E2 occurs on the other 30% of trials, people usually predict E1 on about 70% of their choices for hundreds of trials (Gardner, 1958). This probability-matching (PM) behavior is suboptimal because it produces hits on only 58% of trials (.3×.3+.7×.7) instead of the maximal 70% hit rate from always predicting E1.
Kahneman (2003) noted that a two-systems view of decision making has become widely accepted among cognitive psychologists. The first, the automatic processing system, relies on associative learning, intuition, and heuristics; while, the second, the controlled processing system, relies on deliberate consideration (Kahneman, 2003; Shiffrin & Schneider, 1977; Sloman, 1996). In PL, we might expect that automatic processing would produce maximization, because predicting the most frequent outcome produces the highest rate of reinforcement (Herrnstein & Loveland, 1975). Controlled processing, in the form of normative rule generation and testing, should produce PM, because rules must agree with outcome frequencies to be plausible (Fantino & Esfandiari, 2002; Wolford et al., 2000).
Early evidence for the hypothesis that PM is a product of rule-generation came from Yellott (1969). In the first phase of Yellott’s study, participants probability-matched when E1 occurred on 80% of trials. In the second phase, outcomes always agreed with predictions. Nevertheless, participants still predicted E1 on about 80% of trials. After the experiment, participants reported that they tried various rules until they believed they had discovered one that determined light presentations, and that they used this final rule as long as it appeared to keep working.
Unturbe and Corominas (2007) recently replicated Yellott’s basic procedure. In their version, experimenters asked participants to write down any rule that guided responding at the end of the experiment. Judges, blind to participant performance, rated these rules for complexity. The result was an inverse relationship between rule complexity and likelihood to predict E1. Participants also took longer to proceed after wrong answers, and longer to respond before predicting E2. These delays reflected time for rule generation and consultation, respectively. Other recent studies have also supported the rule-generation hypothesis to explain PM. For example, Wolford et al., (2004) found that preventing rule-generation by having participants engage in a competing verbal working-memory task promoted maximizing, while Goodie and Crooks (2004) found that reducing opportunities for deliberation by offering little time to respond promoted maximization.
Although rule-generation produces suboptimal responding, it is rational because the PL procedure allows for the possibility that there could be a pattern (Wolford et al., 2004). In this important respect, PL experiments differ from tasks where participants repeatedly predict outcomes that are inherently independent of one another, as when betting on dice rolls or coin flips (e.g., Gal & Baron, 1996). Whereas the later are methods for studying irrational behavior, PL is a method for studying the interplay between processing systems.
The brain metabolizes glucose to fuel cognitive processes (Donohoe & Benton, 1999). A recent study by Masicampo and Baumeister (2008) showed participants were more likely to base decisions on a heursitic (i.e., use automatic processing) after drinking sugar-free lemonade than after drinking lemonade sweetened with sugar. This suggests low blood glucose levels promote reliance on less demanding automatic processes. If so, then decreasing blood glucose levels contribute to the tendency for participants to shift from PM towards maximizing after extended practice (e.g., Edwards, 1961; Goodie & Fantino, 1999; Fantino & Esfandiari, 2002; Shanks et al., 2002; Unturbe & Corominas, 2007).
The current procedure tested whether decreasing blood glucose levels promoted shifting from PM towards maximization. Participants drank either regular root beer or sugar-free diet root beer. If searching for a normative rule during PL depletes glucose, then participants in the Diet group should have depleted available resources more quickly because they had less available glucose to start with. Therefore, our hypothesis was that both groups would initially PM, but the Diet group would shift towards maximization before the Regular group. To magnify the effect of the glucose manipulation, all participants completed a Stroop test before drinking root beer. Masicampo and Baumeister (2008) found the effect of a sugary drink was greatest when both groups started with lower glucose levels, and the Stroop test depletes glucose (Gailliot et al., 2007).
The present study also served as a partial replication of Unturbe and Corominas (2007). The computer recorded reaction times (RTs) before and after choices to test whether participants took more time after wrong answers, and more time before predicting the less likely outcome. If our hypothesis about glucose and rule-generation were correct, then these delays (if present) should have started disappearing in the Diet group before the Regular group. Participants also filled-out a post-test questionnaire asking if they used any rule to guide predictions. As in Unturbe and Corominas, blind judges rated rules for complexity. We predicted average complexity scores to be (a) inversely related to E1 predictions near the end of the PL task and (b) higher in the Regular condition.
A campus-wide email informed all faculty teaching summer session courses at Carroll University of the opportunity for students to participate in the present study. Fifty students (36 women), from various majors across campus, volunteered. The mean age of the volunteers was 21.62 years (SD = 3.94). Two volunteers were turned away for being diabetic, and three data sets were lost following a computer upgrade.
The study took place in two adjacent rooms. Room A contained a desk, a refrigerator, and a countertop. Room B had two desktop computers. One of the computers was loaded with two programs: A Stroop test and a PL task. Each program was written in Python 2.6 using the PsychoPy IDE for Windows (Peirce, 2007; 2009). A participant filled out a consent form and a demographics sheet in Room A before moving to the computer in Room B to take the Stroop test. While the participant took the Stroop test, the experimenter prepared the root beer taste test in Room A. After the Stroop test, the participant returned to Room A to take the taste test. Next, the participant completed a 10 minute survey on eating habits. After the survey, the participant returned to the computer in Room B to work on the PL task. Finally, the participant returned to Room A to answer a few questions about the PL task. The entire procedure took about 30 minutes.
The computer displayed the words “red”, “green”, or “blue” in the center of the screen. Each word appeared 26 times. The color of the word agreed with the meaning of word on half of the trials. On the remaining trials, the color of the word was split evenly between the two alternate colors. The participant’s task on each trial was to press a key that corresponded to the color of the word on the screen as quickly as possible. We did not analyze Stroop test results.
The experimenter (AM) told participants the purpose of the study was to investigate a correlation between taste preference and patterns of reasoning. While the participant was in Room B taking the Stroop test, the experimenter poured half of a 12 ounce bottle of root beer into a disposable red cup, and the other half into a disposable blue cup. The experimenter had opened the bottle before the participant had arrived, so the participant could not hear that only one bottle had been opened. Participants drank from each cup, then filled out a three question taste test asking which drink was sweeter, which drink tasted better, and whether either drink tasted bland. We did not analyze taste test results.
Prior to testing, the senior researcher (MS) covered each bottle’s label with duct tape and affixed a sticker printed with a unique number on each bottle’s neck. Half were bottles of Point Premium Root Beer1, with 45 grams of sugar, while the other half were bottles of sugar-free Point Premium Diet Root Beer2 (Point Brewery, Stevens Point, WI, USA). The experimenter drew bottles at random from the refrigerator and recorded the bottle number for each participant, unaware of which type of root beer was in each bottle. This randomly assigned participants to either a Regular (n = 23) or Diet (n = 22) condition.
An eating habits survey, compiled from questions posted on various nutrition websites, filled the 10-12 minute interval before sugar from the drink became available to the brain as glucose (Masicampo & Baumeister, 2008). The survey also supported the claim that the study was a test for a relationship between taste preferences and decision making. Sample questions included: “Do you add salt to your foods?”; and “What kind of meat do you usually buy?”. Copies of the survey are available by request. We did not analyze survey results.
E1 occurred on 70% of trials and E2 occurred on the remaining 30%. To control for handedness-bias, we randomly assigned 24 participants to have “S” as E1. Fifteen of these participants were in the Diet condition, the other 9 were in the Regular condition. The remaining 21 participants had “L” as E1. Seven of these participants were in the Diet condition, the other 14 were in the Regular condition.
After a participant was seated in front of the computer, the experimenter read the following: “You will predict whether ‘Outcome S’ or ‘Outcome L’ will be displayed on the screen. The objective of the two-choice test is to correctly predict as many outcomes as possible.” The experimenter then moved into Room A.
On each trial, the computer presented the question “Which will be correct: S or L?” in the center of the screen. After the participant made a prediction, the computer displayed the participant’s response, whether the prediction was correct or incorrect, and the participant’s overall score. A prompt at the bottom of the screen told participants to “Press any key to continue”. The computer recorded responses and whether the prediction was correct or not. The computer also recorded two RTs in seconds, to the millisecond. The first was time to predict S or L. The second was time press a key to start the next trial.
After completing the PL task, participants filled out a post-test questionnaire. The first question was “Describe any strategies you used to make predictions”. The second was “How many strategies did you use?”. The third was “How confident were you that you had discovered a pattern?”
Two independent judges, blind to participant performance and condition, assigned a rule complexity score to each questionnaire. Judges gave a 0 or 1 for answers that did not reveal a strategy. Simple rules, such as “I counted how many L’s occurred and then when an S occurred and used that number to guess when another S came”, received a 2 to 4. Complex rules, such as “I chose S, then thought every 3 questions was L, then thought every 5 questions was L, then every time there was an L the answer to the next questions would be L”, received a 5 or 6. We discarded two ambiguous self-reports because of 4 point differences in ratings. In these cases, participants reported using a number of strategies, including exclusively picking E1. The correlation between judges on the remaining 42 reports was .86. We used ratings from the senior researcher (MS) to test our hypotheses.
All individual RT scores were log-transformed prior to analysis to minimize distortion from skew that commonly occurs when measures have lower boundaries without upper boundaries (Ratcliff, 1993). Grubbs’ tests checked overall scores on each dependent variable for outliers, with two-tailed alphas of .05. One participant, who picked E1 on 9 of the 200-trials, was an outlier (G = 4.94; p < .0001) and was removed from all subsequent analyses. This participant was an 18 year-old woman in the Diet condition who had L as E1. Re-tests on each dependent measure found no other outliers. Kolmogorov-Smirnov tests confirmed that overall scores on each dependent variable were normally distributed.
Most analyses were mixed-design analyses of variance (ANOVAs). A three-way mixed design ANOVA analyzed E1 prediction data. Condition (Regular vs Diet) and Stimulus serving as E1 (S vs L) were between-subject factors and Block (1-4, treated as categories) was the within-subject factor. A four-way mixed design ANOVA analyzed RT before predictions. Condition and Stimulus were between-subject factors and Block and Prediction (E1 vs E2) were within-subject factors. Finally, a four-way mixed design ANOVA analyzed RT to continue to the next trial. Condition and Stimulus were between-subject factors and Block and Feedback (correct vs incorrect) were within-subject factors. In cases of nonsignificant interactions, ANOVAs were redone with non-significant interactions excluded. In cases of significant interactions, one-tailed Bonferroni post-tests compared Regular vs Diet groups in each Block. These tests used one-tailed alphas of .05, adjusted for multiple comparisons (.05/4 = .0125), because the hypothesis predicted which group should have a higher mean.
One-sample t-tests compared E1 predictions by each group in Blocks 3 and 4 with the hypothetical mean PM value of 35. A Spearman’s rank-order correlation tested whether judgments of self-reported rule complexity were negatively related to E1 predictions in the last block of trials. A one-tailed t-test compared complexity ratings for the Regular group with complexity ratings for the Diet group.
Table 1 summarizes E1 predictions in each block of 50 trials by Condition (Regular vs. Diet) and Stimulus serving as E1 (S vs. L). An initial analysis found no significant interaction between Stimulus and either Condition or Block. Reanalysis without testing for interactions involving Stimulus revealed a significant interaction between Condition and Block, F(3, 126) = 3.08, MSE = 46.17, p = .03, two-tailed. Although groups predicted E1 at about the same rate during Blocks 1 and 2, the Diet group was more likely to predict E1 in Blocks 3 and 4 (see Table 2).
Table 1: Mean (SD) E1 predictions
Diet Regular
Table 2: Bonferroni comparisons of Condition by Block
* One-tailed p < .05; adjusted (.05/4) Note: CI = confidence interval of the difference.
Figure 1 shows how each group responded relative to PM. One-sample t-tests confirmed that the Diet group exceeded PM in Block 3 (SD = 5.6), t(20) = 2.07, one-tailed p = .03; and Block 4 (SD = 6.39), t(20) = 2.22, one-tailed p = .02. In contrast, one-sample t-tests failed to find significant differences between the Regular group and PM in Block 3 (SD = 4.9), t(22) = 1.11; or Block 4 (SD = 4.53), t(22) = 1.01.
Figure 1: E1 predictions by condition and block relative to PM. Error bars indicate SEM.
To check the interaction between Block and Condition for E1 predictions, we computed each participants’s slope for E1 prediction as a function of Block, and the mean proportion of E1 predictions over all four blocks. (In the analysis just reported, Block was a categorical variable, but here it was continuous.) We then regressed each of these on indices on Condition, Stimulus, and their interaction, with Condition and Stimulus centered on their means. No predictors were significant for the means, but the slopes were predicted by Condition (t(40)=2.72, p = .010), and weakly by Stimulus (t(40)=1.976, p = 0.055). Perhaps of greater interest the intercepts at block 4 were also strongly affected by Condition (t(40)=3.080, p = 0.004). No interactions were significant in any analysis.
Table 3 summarizes log-transformed prediction times in each of the four Blocks, by Condition, Stimulus, and whether the participant made a subsequent Prediction of E1 or E2. Data from one woman in the Diet condition, who had L as E1, was excluded because she did not predict E2 during the final two blocks. An initial analysis found no significant interactions. Reanalysis without testing for interactions revealed a significant main effect for Block, F(3, 126) = 116.48, MSE = 1.49, p < .0001. The main effect of Prediction was also significant, F(1, 42) = 32.33, MSE = 0.33, p < .0001. Figure 2 shows that participants responded more quickly as trials progressed, though they consistently took more time before predicting E2 than E1. There were no significant main effects for Condition or Stimulus type.
Table 3: Mean (SD) log-transformed times by Condition, E1 Stimulus, Block, and Prediction.
Regular Diet Stimulus L Stimulus S Stimulus L Stimulus S Block E1 E2 E1 E2 E1 E2 E1 E2 1-50 −0.07 (0.13) 0.05 (0.16) −0.11 (0.16) 0.001 (0.14) −0.09 (0.20) −0.01 (0.15) −0.04 (0.16) −0.05 (0.16) 51-100 −0.28 (0.12) −0.25 (0.13) −0.29 (0.14) −0.23 (0.12) −0.23 (0.21) −0.23 (0.15) −0.24 (0.19) −0.20 (0.22) 101-150 −0.31 (0.12) −0.28 (0.13) −0.35 (0.23) −0.29 (0.15) −0.29 (0.19) −0.19 (0.23) −0.35 (0.20) −0.29 (0.19) 151-200 −0.41 (0.16) −0.31 (0.16) −0.36 (0.19) −0.30 (0.20) −0.28 (0.17) −0.21 (0.20) −0.38 (0.19) −0.26 (0.16)
Figure 2: Response times when predicting E1 vs E2 by Block. Error bars indicate SEM. 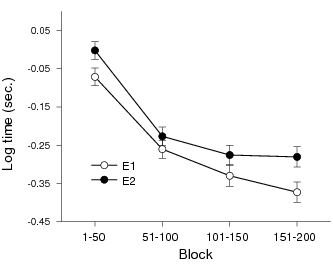
Table 4 summarizes log-transformed times before hitting a key to proceed to the next trial in each of the four blocks, by Condition, Stimulus, and type of Feedback from the previous trial (correct or incorrect). An initial analysis found no significant interactions. Reanalysis without testing for interactions revealed a significant main effect for Block, F(3, 129) = 123.04, MSE = 1.46, p < .0001. The main effect of Feedback was also significant, F(1, 43) = 9.34, MSE = 1.08, p = .004. Figure 3 shows that participants responded more quickly as trials progressed, though they consistently took more time before continuing after incorrect predictions than correct predictions. There were no significant main effects for Condition or Stimulus type.
Table 4: Mean (SD) log-transformed times to continue to the next trial by Condition, E1 Stimulus, Block, and Feedback on previous trial.
Regular Diet Stimulus L Stimulus S Stimulus L Stimulus S Block Correct Incorrect Correct Incorrect Correct Incorrect Correct Incorrect 1-50 0.02 (0.13) 0.08 (0.12) 0.03 (0.15) 0.26 (0.45) 0.03 (0.07) 0.16 (0.13) 0.07 (0.09) 0.12 (0.09) 51-100 −0.18 (0.09) −0.10 (0.13) −0.20 (0.15) 0.05 (0.51) −0.17 (0.07) −0.10 (0.04) −0.17 (0.11) −0.07 (0.07) 101-150 −0.23 (0.11) −0.16 (0.14) −0.22 (0.14) −0.01 (0.57) −0.27 (0.09) −0.20 (0.12) −0.23 (0.11) −0.13 (0.13) 151-200 −0.28 (0.13) −0.19 (0.17) −0.18 (0.18) −0.01 (0.58) −0.29 (0.13) −0.17 (0.18) −0.21 (0.10) −0.11 (0.12)
Figure 3: Response times after correct vs incorrect predictions by Block. Error bars indicate SEM. 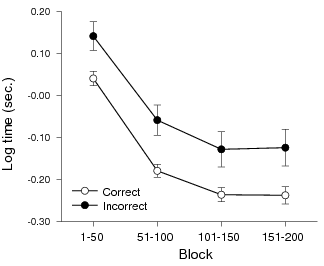
Forty-two of 44 participants answered the self-report questionnaire unambiguously. One ambiguous self-report came from the Regular condition, the other from the Diet condition. Ratings of rule complexity were negatively correlated with likelihood to predict E1 in the final block, rs = –.30, one-tailed p = .03. However, the Diet group reported using rules (M = 1.65, SD = 1.63) that were, on average, judged to be as complex as the rules the Regular group reported using (M = 1.95, SD = 1.70), t(40) = 0.59.
This study replicated Unturbe and Corominas’ (2007) findings that (a) E1 predictions were inversely related to complexity of self-generated normative rules; (b) participants took longer to respond on trials when they predicted E2; and (c) participants took longer to advance to the next trial after incorrect predictions. The relationship between rule complexity and E1 predictions supports the hypothesis that PM is the product of normative rule-generation. This study also contributed the novel finding that ingesting sugar before working on a PL task promoted PM. This result agrees with Masicampo and Baumeister’s (2008) hypothesis that controlled processing becomes less likely as glucose levels diminish.
The present study failed to find significant differences between groups in either RT measure, or on judgments of rule complexity. This may have been due to lack of sensitivity on these measures. This seems likely for the crude rating system that measured complexity. RT data could have failed to show an effect because glucose enhances overall processing speed (Owens & Benton, 1994). Hence, the Regular group’s controlled processing system may have generated normative rules as quickly as the Diet group’s automatic processing system reacted to the question.
Spearman (1904, 1914) proposed a general factor (g) that provides energy to localized areas of the brain responsible for specific mental faculties. According to Spearman, people differ in how efficiently their different specific mental faculties make use of this energy. Therefore, people low in overall g perform poorly in most cognitive tasks because all but the most efficient faculties lack sufficient energy. Likewise, people high in overall g do well in most cognitive tasks, because even inefficient faculties have access to enough energy to produce correct answers.
The basic rationale for Spearman’s theory may be adapted so that glucose metabolism fills the role of the hypothetical g-factor. From this perspective, people who use mental energy less efficiently would deplete resources more quickly and shift towards automatic processing sooner. This would explain several otherwise counterintuitive findings in the PL literature. For example, preschool children tend to outperform elementary school children; while children, and adults with lower intellectual abilities, outperform adults with average or above average intellectual abilities (Derks & Paclisanu, 1967; Jones & Liverant, 1960; Singer, 1967; Weir, 1964).
Benton and Parker (1998) found that missing breakfast impaired memory, though the impairment was eliminated by ingesting a glucose drink. Likewise, Morris and Sarll (2001) found students who ingested a glucose drink did better on a listening span test than controls who drank saccarine, and concluded that “students should eat breakfast, but if this is omitted, then a glucose snack or drink before the first class may reverse any adverse effects” (p. 201). On the surface, results from present study appear to conflict with these earlier results, because participants in the present study performed worse after ingesting glucose. However, poor performance in the present study was presumably a product of a greater tendency to engage in controlled processing. Our general conclusion, that glucose promotes controlled processing, supports ingesting glucose to enhance performance on tasks requiring extensive controlled processing, at least within a half hour following ingestion. The body’s efforts to maintain homeostasis will eventually eliminate the advantage from ingesting glucose, and could even promote a rebound effect (Morris & Sarll, 2001).
Masicampo and Baumeister (2008), and later Gailliot et al. (2009), manipulated blood sugar levels by having participants drink lemonade sweetened with sugar, or lemonade sweetened with sucralose. Several factors contributed to our decision to manipulate blood glucose levels by having participants drink from regular or diet root beer, instead. First, root beer bottles ensured there was no error from mixing drinks, and that all participants drank the same total amount. Second, root beer, like lemonade, does not contain caffeine, which could have interacted with effects of glucose on cognition (Scholey & Kennedy, 2004). Third, whereas most soft drink makers used either a different colored container, or a different colored cap, to differentiate regular from sugar-free, the Point Brewery identified regular and sugar-free varieties of their root beer on the label, only. This similarity in packaging facilitated using a double-blind procedure. Finally, regular and diet root beers have similar tastes.
Of course, regular and diet root beers have similar tastes only because diet root beer contains artificial sweeteners. In the case of Point Premium Diet Root Beer, the artificial sweeteners are acesulfame potassium and sucralose. In our study, as in the earlier studies, an effect of artificial sweetener may have contributed to differences between groups. However, we felt that to not use an equally sweet control drink would have also presented a confound, because the experience of ingesting a sweet taste alone could have influenced performance (Maben & Smith, 1996). A follow-up study could compare effects of water mixed with sugar to either a plain water, or no-water, control.
Another follow-up study could track effects of glucose ingestion on controlled processing over a longer interval. Such a study could include quick and painless blood tests at different points in the procedure to verify changes in blood glucose level. A larger sample size could also test whether the present study’s failure to find relationships between glucose ingestion and rule complexity judgments, or reaction times, were due to insufficient power.
Benton, D., & Parker, P. (1998). Breakfast blood glucose and cognition. American Journal of Clinical Nutrition, 67(Suppl.), 772S–778S.
Derks, P. L., & Paclisanu, M. I. (1967). Simple strategies in binary prediction by children and adults. Journal of Experimental Psychology, 73, 278–285.
Donohoe, R. T., & Benton, D. (1999). Cognitive functioning is susceptible to the level of blood glucose. Psychopharmacology, 145 , 378–385.
Edwards, W. (1961). Probability learning in 1000 trials. Journal of Experimental Psychology, 62, 385–394.
Fantino, E., & Esfandiari, A. (2002). Probability matching: Encouraging optimal responding in humans. Canadian Journal of Experimental Psychology/Revue Canadienne De Psychologie Expérimentale, 56, 58–63.
Gailliot, M. T., Baumeister, R. F., DeWall, C. N., Maner, J. K., Plant, E. A., Tice, D. M., Brewer, L. E., & Schmeichel, B. J. (2007). Self-control relies on glucose as a limited energy source: Willpower is more than a metaphor. Journal of Personality and Social Psychology, 92, 325–336.
Gailliot, M. T., Peruche, B. M., Plant, E. A., & Baumeister, R. F. (2009). Stereotypes and prejudice in the blood: Sucrose drinks reduce prejudice and stereotyping. Journal of Experimental Social Psychology, 45, 288–290.
Gal, I., & Baron, J. (1996). Understanding repeated simple choices. Thinking & Reasoning, 2, 81–98.
Gardner, R. A. (1958). Multiple-choice decision-behavior. The American Journal of Psychology, 71, 710–717.
Goodie, A. S., & Crooks, C. L. (2004). Time-pressure effects on performance in a base-rate task. Journal of General Psychology, 13, 18–28.
Goodie, A. S., & Fantino, E. (1999). What does and does not alleviate base-rate neglect under direct experience. Journal of Behavioral Decision Making, 12, 307–335.
Herrnstein, R. J., & Loveland, D. H. (1975). Maximizing and matching on concurrent ratio schedules. Journal of the Experimental Analysis of Behavior, 24, 107–116.
Jones, M. H., & Liverant, S. (1960). Effects of age differences on choice behavior. Child Development, 31, 673–680.
Kahneman, D. (2003). A perspective on judgment and choice: Mapping bounded rationality. American Psychologist, 58, 697–720.
Maben, A., & Smith, A. (1996). Sugar, aspartame and mental performance: A preliminary investigation. Human Psychopharmacology: Clinical and Experimental, 11, 21–23.
Masicampo, E. J., & Baumeister, R. F. (2008). Toward a physiology of dual-process reasoning and judgment: Lemonade, willpower, and expensive rule-based analysis. Psychological Science, 19, 255–260.
Morris, N., & Sarll, P. (2001). Drinking glucose improves listening span in students who miss breakfast. Educational Research, 43, 201–207.
Owens, D. S., & Benton, D. (1994). The impact of raising blood glucose on reaction times. Neuropsychobiology, 30, 106–113.
Peirce, J. W. (2007). PsychoPy – psychophysics software in Python. Journal of Neuroscience Methods, 162, 8–13.
Peirce, J. W. (2009). Generating stimuli for neuroscience using PsychoPy. Frontiers in Neuroinformatics, 2, 10.
Ratcliff, R. (1993) Methods for dealing with reaction time outliers. Psychological Bulletin, 114, 510–532.
Scholey, A. B., & Kennedy, D. O. (2004) Cognitive and physiological effects of an “energy drink”: an evaluation of the whole drink and of glucose, caffeine and herbal flavouring fractions. Psychopharmacology, 176, 320–330.
Shanks, D. R., Tunney, R. J., & McCarthy, J. D. (2002). A re-examination of probability matching and rational choice. Journal of Behavioral Decision Making, 15, 233–250.
Shiffrin, R. M., & Schneider, W. (1977). Controlled and automatic human information processing: II. perceptual learning, automatic attending and a general theory. Psychological Review, 84 , 127–190.
Singer, E. (1967). Ability and the use of optimal strategy in decisions. The American Journal of Psychology, 80, 243–249.
Sloman, S. A. (1996). The empirical case for two systems of reasoning. Psychological Bulletin, 119, 3–22.
Spearman, C. (1904). ’General intelligence,’ objectively determined and measured. The American Journal of Psychology, 15, 201–293.
Spearman, C. (1914). The theory of two factors. Psychological Review, 21, 101–115.
Unturbe, J., & Corominas, J. (2007). Probability matching involves rule-generating ability: A neuropsychological mechanism dealing with probabilities. Neuropsychology, 21, 621–630.
Weir, M. W. (1964). Developmental changes in problem-solving strategies. Psychological Review, 71, 473–490.
Wolford, G., Miller, M. B., & Gazzaniga, M. (2000). The left hemisphere’s role in hypothesis formation. The Journal of Neuroscience, 20, RC64 (1–4)
Wolford, G., Newman, S. E., Miller, M. B., & Wig, G. S. (2004). Searching for patterns in random sequences. Canadian Journal of Experimental Psychology/Revue Canadienne De Psychologie Expérimentale, 58, 221–228.
Yellott, J. I., Jr. (1969). Probability learning with noncontingent success. Journal of Mathematical Psychology, 6, 541-575.
This document was translated from LATEX by HEVEA.