The skill element in decision making under uncertainty:
Control or competence?
Adam S. Goodie1
and Diana L. Young
University of Georgia
Judgment and Decision Making,
vol. 2, no. 3, June 2007, pp. 189-203,
Abstract
Many natural decisions contain an element of skill. Modern conceptions
of the skill component include control (Goodie, 2003) and competence
(Heath & Tversky, 1991). The control hypothesis states that a
task's skill component (the sensitivity of
the task to skill) affects decision making; the competence hypothesis
states decision making is affected only if the participant possesses
the skill. Three experiments compared risk taking patterns between two
groups. One group faced bets on random events, and another group faced
bets on their answers to general knowledge questions, which is a task
characterized by control. In Experiment 1, control increased risk
taking markedly with all statistical properties held constant. In
Experiment 2, decisions made in domains of varying difficulty, and by
individuals of varying ability, yielded further qualified support for
the role of competence. In Experiment 3, the role of control was
replicated, and participants' perceptions of the
differences in group treatments aligned more with the implications of
the control hypothesis than with the competence hypothesis. Results
offered support for the control hypothesis across a range of
competence.
Keywords: control, competence, decision making, choice, betting, risk,
overconfidence, college students.
1 Introduction
Decision researchers know a great deal about the terms of risk that
people will accept and reject on random events such as the drawing of a
lottery number, rolling a die, or pulling a poker chip from a bookbag.
Less is known about how individuals accept or reject risk when they are
betting on their own golf putts, stock picks, organizational decisions
or answers to trivia questions.
Researchers readily build models of decision making around risky
decisions based on random events. Much decision research is analogous
to psychophysical perception research, relating psychological events
to objective criteria. A bookbag with 70 percent white and 30 percent
red poker chips presents a clear objective criterion to which
subjective perceptions may readily be compared. Sinking a free throw
does not present such a clear criterion with regard to its associated
probabilities. For this reason, researchers have difficulty in
evaluating performance relative to a normative criterion when the task
is assessing the probability of a made free throw, as well as in
establishing valid lawful relationships between relevant probabilities
and decisions.
1.1 Ambiguity and skill
Ellsberg (1961) and many others have found that people are generally
ambiguity averse; in the domain of gains, people prefer a prospect in
which probabilities of possible outcomes are known to a prospect in
which probabilities of the same outcomes are not stated (ambiguous) but
have the same average value. The major exception to this is at very low
probabilities, where ambiguity is preferred. In the domain of losses,
these preferences are reversed.
Examination of the effect of a skill element constitutes a special case
of ambiguity. What is Shaquille
O'Neal's probability of making his next
free throw? At the conclusion of the 2006-07 season, his career free
throw rate was 52.5%, but his free throw rate for the season was only
42.2%. At his next free throw opportunity, he may be suffering from
the flu, or coming off a terrible game, or on a hot streak, or he may
merely believe he's on a hot streak (Gilovich,
Vallone, & Tversky, 1985). Unlike a lottery draw, in which it is
easier to construct a reasonable estimate of the probability of winning
(for example, by reading the ticket), the sample space for a successful
free throw is not clearly defined. In other words, the prediction of
performance is variable over time in a skilled task, hence it is more
difficult to predict on the basis of past performance. In fact, most
definitions of skill state or imply that the person exerting skill can
change the probability of success.
The existing evidence suggests that a skilled task that determines an
uncertain outcome has an effect on probability assessment and decision
making that is distinct from that of ambiguity alone. For example, in
demonstrating the illusion of control,
Langer (1975) showed that people responded differently to vague
likelihoods when certain superficial characteristics of the prospects
were distorted, for example when the familiar symbols of a deck of
cards were replaced by unfamiliar symbols, or when participants were
permitted to practice on a random mechanism similar to a roulette
wheel. Langer argued that the changes in the appearance of a skill
component caused changes in responses. Confidence ratings, bet
acceptance and bet amounts were all affected by apparent control,
although the illusion of control is not robust to multi-shot gambles
(Koehler, Gibbs, & Hogarth, 1994). Participants bet more when given
skill-relevant manipulations such as being able to choose whether to
receive more cards in a simulated blackjack game, but not when given
skill-irrelevant manipulations such as choosing a different dealer
(Chau & Phillips, 1995). Also, participants high in desire for control
bet more than those low in desire for control on events over which they
had falsely perceived control. Those high in desire for control bet
less than others on events over which they did not have illusory
control (Burger & Schnerring, 1982).
1.2 Control and competence
Recent research has advanced two major conceptions of the role of skill
in decision making: competence (Heath & Tversky, 1991) and control
(Goodie, 2003). These conceptions have important commonalities, sharing
an emphasis on the role that the skill component of a task plays in
shaping decision making under uncertainty (apart from the probability
and magnitude of possible outcomes. The control hypothesis claims that
people bet more when skill makes a difference; the competence
hypothesis claims the same effect but only when an individual possesses
the relevant skill. Control is a property of the task: if the task
requires actions that can be learned, then it is characterized by
control, even if a participant has not yet learned the skill.
Competence, on the other hand, is an interactive characteristic of both
the task and the person: competence exists only if the task both can be
learned (the task component) and has been learned (the person
component).
Heath and Tversky (1991) argued that people prefer to bet on questions
about knowledge topics in which they feel competent rather than
incompetent. In their studies, participants chose to bet on either the
correctness of their answer to a general knowledge question or a random
event whose probability matched their previously stated confidence,
with identical payoffs in each bet offer. Across an assortment of
situations, when betting on questions drawn from intermixed domains,
the proportion of times that participants chose to bet on their
knowledge was a steeply increasing function of the probability of
winning (Experiments 1 and 3). Because confidence consistently exceeded
accuracy in these experiments, betting on a random event whose
probability of winning was equal to confidence was more likely to win
than betting on the belief itself, and Heath and Tversky (1991) noted
that the acceptance of knowledge-based bets over random bets resulted
in a 15% loss of expected earnings.
Heath and Tversky then (Experiment 4) tested the competence hypothesis
by drawing questions from discrete domains in which participants
believed themselves to be either competent or incompetent. They
observed that, with subjective probability held constant, participants
displayed a consistent behavioral pattern: bets in a domain of
competence were preferred to bets on random events, which in turn were
preferred to bets in a domain of incompetence. They concluded that
people seek out ambiguity in domains of competence but avoid it in
areas of incompetence.
Fox and Tversky (1995; Fox & Weber, 2002; see also Chow & Sarin, 2001)
presented a companion to the competence hypothesis, the comparative
ignorance hypothesis, positing that relative knowledge affects
decisions most strongly when the contrast between conditions of greater
and lesser competence is brought to the decision
maker's attention.
These findings are notably contrary to the early ambiguity findings
with random events: when evaluating bets on vaguely probable events
with a skill component, participants preferred the ambiguous (skilled)
option at high probabilities but preferred the unambiguous (random)
option at low probabilities. However, the evidence specifically in
support of the control hypothesis remains limited to Heath and
Tversky's Experiment 4 comparing just two domains
under unusual selection techniques, which are discussed at more length
below.
More recent studies (Goodie, 2003) assessed risk attitude by pitting a
bet on knowledge item against no bet at all, rather than a bet on a
random event of equivalent probability. Goodie constructed bets on
knowledge items to be fair, having zero average marginal value if
confidence was well calibrated. In the first two experiments, bet
acceptance sharply increased as confidence increased for knowledge
bets, bearing a striking resemblance to the comparable data obtained by
Heath and Tversky (1991) when using mixed-domain questions. In
Experiment 3, one group considered bets on their knowledge. The other
groups considered bets on events that appeared random to participants
but that Goodie constructed to be identical in every statistical way to
bets on knowledge. Participants accepted more bets on random events at
low probabilities and more bets on their knowledge at high
probabilities, revealing the anticipated crossover effect.
An important difference arises between studies that utilize questions
drawn from a single domain (e.g., U.S. history) and those that use
questions from mixed domains (e.g., Greek mythology, U.S. history, and
sports). As Heath and Tversky (1991) noted in discussing the
differences between single and mixed domains, low confidence items in
mixed-domain populations will systematically include more questions
from low-competence domains. Similarly, Gigerenzer (1991) noted the
importance of utilizing single-domain questions in assessing confidence
in answers. In a mixed-domain set of general knowledge questions, the
methods used by the decision maker to generate confidence assessments
become uninterpretable because the decision maker may be using a
different reference set than the experimenter. Asking participants
questions in a single domain allows for more reliable representations
of confidence across all questions asked.
There is reason to expect that control per se influences decision
making. Skinner (1996), in a major review of the literature, notes that
"[w]hen people perceive that they have a high degree
of control, they exert effort, try hard, initiate action, and persist
in the face of failures and setbacks; they evince interest, optimism,
sustained attention, problem solving, and an action
orientation" (p. 556, cf. Seligman, 1975). Where
control prevails, a prospect with negative expected value, narrowly
conceived, might also be an opportunity to learn new skill that will
result in future prospects with positive value, and might therefore be
worth accepting. This is an interesting complement to the normative
argument made by Frisch and Baron (1988; Baron, 2000) that other
ambiguous prospects, even with positive expected value, might be worth
postponing until further information is available to permit
better-valued decisions. We argue that ambiguous prospects
characterized by control, even with negative expected value, might be
worth pursuing in order to set up better-valued decisions later. The
possibility of accepting bets in order to increase skill does not apply
when competence already exists, only when the possibility of exerting
control to increase competence prevails.
1.3 The present experiments
The goals of this paper are: a) to compare across domains wherein people
have different degrees of competence, in order to observe the degree to
which variation in competence makes a difference in risk attitude; b)
to extend the risk-attitude findings of Goodie (2003) to single-domain
formats, a manipulation that made a considerable difference in the
ambiguity-attitude findings of Heath and Tversky (1991); and c) to
begin to compare the roles of competence and control in decisions under
uncertainty. The present experiments test the competence hypothesis
against the control hypothesis by eliciting betting decisions within
domains of varying difficulty and among participants of varying
ability.
The distinction between competence and control is most evident in a
skill-based task in which a particular participant has little skill.
The control hypothesis suggests people bet more when skill could be
attained, the competence hypothesis only when it has been attained. We
can best differentiate between these two hypotheses when skill could be
attained but has not. The control hypothesis suggests the skill element
does alter decision making under such conditions, whereas the
competence hypothesis suggests it does not.
1.4 General Method
We report three experiments which use the methods developed by Goodie
(2003; Campbell, Goodie, & Foster, 2004). The basic task of fair bets
on knowledge uses three kinds of questions, administered in two phases.
1.4.1 Phase 1. General knowledge and confidence assessment
The first question type was a two-alternative forced choice question.
Prior studies (Goodie, 2003) adapted questions from a collection
(Nelson & Narens, 1980) that sampled from diverse domains. The present
studies randomly selected questions from five well-defined domains.
Three question populations selected two of the 50 U.S. states at random
and asked for a binary comparison on one statistic: population, land
area, or population density, manipulated between-subjects. The other
two question populations randomly selected two of the 50 largest U.S.
cities and elicited a comparison of the cities on either population or
driving distance to Athens, Georgia.2
The second question type asked for an assessment of confidence in each
question, placed in one of the following categories: 50-52%, 53-60%,
61-70%, 71-80%, 81-90%, 91-97%, and 98-100%. In a binary task such
as this one, the range of 50%-100% reflects the full range of
competence, from complete ignorance where accuracy would be 50% and
confidence should not be much higher, to absolute knowledge where
accuracy and confidence are both 100%. Confidence was taken as the
midpoint of the selected confidence category. We used these categories
to assess risk taking across a well-defined array of probabilities from
chance to certainty, combining equal spacing of categories in the
mid-range and greater discrimination near the endpoints. This range
confers the advantages of reflecting all binary choices and being
simple and easily understood, although it also bears the clear
limitations of excluding half the probability spectrum. These studies
adopted confidence elicitation methods without alteration from those
used by Goodie (2003; Campbell et al., 2004).
1.4.2 Phase 2. Betting on answers
A third question type elicited acceptance or rejection of a bet on the
correctness of each answer that was given. Participants played out
these bets for point accumulations that were not backed by monetary
incentives. In all conditions, participants faced a two-alternative
choice between a certain outcome and a bet. The bet was always fair,
having average value equal to the certain option if the
participant's confidence judgment was well-calibrated.
Its average value was less than that of the certain option if the
participant was overconfident and greater than the certain option if
the participant was underconfident. After accepting or rejecting the
bet, the participant received feedback, including the correct answer to
the question, the number of points gained or lost (including if no
points were gained or lost), and the cumulative point total.
1.4.3 The betting formats
We used two betting formats, with Mixed gains and
losses, and Gains Only. The Mixed format was used in order to reflect
the structure of many risks which contain the possibility of either
gain or loss. The Gains Only format was used to eliminate the
complexity of possibly differing value and weighting for gains and
losses. We designed both betting formats to provide average outcomes
that were equal if the bet was accepted or rejected, assuming good
calibration. Betting formats were always varied between subjects, or
were kept constant within an experiment, so that no participant needed
to comprehend, remember, or distinguish between both.
In the Mixed format, the certain option was no change in points, and the
bet provided for a gain of 100 points if the answer was correct or a
loss of 100 * confidence/(1-confidence) points if the
answer was incorrect. For example, if a participant was 75% confident
in an answer, then she considered a bet wherein she won 100 points if
the answer was correct but a loss of 100 * (.75/.25) = 300 points if
the answer was wrong. If she rejected the bet, she did not gain or lose
any points.
In the Gains Only structure, the certain option was a gain of 100
points. The bet offered a gain of 100 /confidence points if
the answer was correct and no gain if the answer was wrong. So, if the
participant bet on an answer in which she had 75% confidence, she won
100/.75 = 133 points if the answer was correct but nothing if the
answer was wrong. She gained 100 points if she rejected the bet. It is
easy to show that the average outcome of accepting a bet in either
format is equal to the certain option (no change in the Mixed format or
a gain of 100 points in Gains Only) if p(correct) =
confidence, less than the certain option if p(correct)
confidence, and greater than the certain option if
p(correct) confidence.
Table 1: Structure of the experiments
|
| N | Question Types | Betting Format | Survey |
|
1 | | | single domains | mixed and gains-only | No |
| 1a | 76 | state population | mixed | No |
| 1b | 67 | city population | mixed | No |
| 1c | 48 | state population | gains-only | No |
| 1d | 35 | city population | gains-only | No |
|
2 | | | single domains | mixed and gains-only | No |
| 2a | 112 | 5 groups* | mixed | No |
| 2b | 152 | 5 groups* | gains-only | No |
|
3 | | 185 | state population | gains-only | Yes |
|
|
1.4.4 "Answers" and "Random" groups
In Experiments 1 and 3, we randomly assigned participants to two groups
that differed in whether they believed they were betting on their
knowledge or on a random event. The Answers group bet on their answers,
using either the Mixed or Gains Only format in different experiments.
The Random group's bets held all statistical properties
constant, differing from the Answers group's only in
appearing to rely on random events rather than
participants' answers. Many dimensions of bets on
knowledge are determined by the participants'
responses, such as the distribution of subjective probabilities of
winning (determined by confidence), the frequency of winning
(determined by accuracy), and any order effects on these dimensions
(for example, if overconfidence declines with experience, cf. Sieck &
Arkes, 2005, or accuracy declines with fatigue, or any number of other
possibilities). By basing the apparently random bets on the
participant's responses, we can rule out these and any
other alternative explanations based on such statistical properties of
the responses of participants in the Answers condition.
Bets that appeared stochastic in fact relied on
participants' answers and confidence assessments in the
knowledge questions. In the betting phase, each answer was converted
into a bet on a seemingly random event with the stated probability of
winning equal to assessed confidence in a corresponding trivia answer;
the correctness of the corresponding answer determined the
bet's outcome. For example, if a participant expressed
75% confidence in her answer to the first question, then the first bet
she encountered in the betting phase instructed: A
number will be chosen at random between 0 and 100, and to win the bet,
the Chosen number must be less than or equal to the Magic Number. The
Magic Number this time is: 75. If the chosen number is LESS THAN or
equal to the Magic Number, you gain 100 points. If the chosen number is
greater than the Magic Number, you lose 300 points. If
the participant accepted the bet, she won the bet if her answer to the
corresponding question was correct and lost the bet if her answer was
incorrect. The Magic Number, the magnitude of the gain if the bet was
won, and the determination of whether the bet was won or lost changed
on each betting trial to reflect the confidence expressed in the
corresponding answer from the first phase and whether it was correct.
1.4.5 Other general facets
In all experiments, we recruited participants from the Research Pool of
the Psychology Department at the University of Georgia and compensated
them with partial credit toward lower-division courses. We prevented
participants from participating in more than one of the present
experiments or in any additional related experiments. Participants ran
in groups of up to three in a room with individual computer stations
separated by five-foot-tall partitions. We omitted
participants' data from analysis if they did not use
more than three confidence categories, or if they showed evidence of
not attending to the task (i.e., exclusive betting acceptance or
rejection, or radical over- or underconfidence). Thirty participants
were excluded for this reason (13 out of 239 in Experiment 1, 10 out of
274 in Experiment 2, and 7 out of 192 in Experiment 3). See Table 1 for
a layout of the structure of our experimental design.
2 Experiment 1
The first experiment assessed the effect of a skill component using
items from single domains, comparing participants betting on answers
with those betting on random events. Four sub-experiments utilized
different question populations and betting formats.
2.1 Method
In Experiment 1a (N=76; 37 in Answers and 39 in Random), participants
answered binary choices comparing states' populations
and faced bets constructed in the Mixed format. In Experiment 1b (N=67;
33 in Answers and 34 in Random), participants compared cities in
population with bets in the Mixed format. In Experiment 1c (N=48; 23 in
Answers and 25 in Random), participants compared
states' populations with bets in the Gains Only
format. In Experiment 1d (N= 35; 17 in Answers and 18 in Random),
participants compared cities' populations with bets in
the Gains Only format.
2.2 Results
2.2.1 Confidence, accuracy and calibration
Average confidence, accuracy and over/underconfidence are given in Table
2.
2.2.2 Bet acceptance
The principal finding of these experiments is that, using questions from
single domains with all statistical properties of bets held constant
between groups, participants consistently accepted more bets when
betting on their answers than they did when betting on random events.
These results are presented in Table 3 and show dramatically greater
rates of bet acceptance in the Answers group in all four
sub-experiments, which were statistically significant in all cases.
Averaged across sub-experiments, those betting on their answers
accepted 75.8% of all bets, and those betting on random events
accepted 55.5% of all bets.
Table 2: Average confidence, accuracy and overconfidence in Experiment
1, and comparisons between Answers and Random groups.
| Experiment | Answers | Random | t | df | p |
|
|
| 1a | .751 | .753 | 0.07 | 74 | .95 |
| 1b | .768 | .764 | 0.21 | 65 | .83 |
| 1c | .780 | .726 | 2.31 | 46 | .026 |
| 1d | .778 | .756 | 0.80 | 33 | .43 |
|
|
| 1a | .745 | .757 | 0.73 | 74 | .47 |
| 1b | .713 | .713 | 0.01 | 65 | .99 |
| 1c | .760 | .751 | 0.50 | 46 | .61 |
| 1d | .665 | .694 | 1.07 | 33 | .29 |
|
|
| 1a | .007 | -.004 | 0.57 | 74 | .57 |
| 1b | .055 | .051 | 0.19 | 65 | .85 |
| 1c | .020 | -.025 | 1.52 | 46 | .14 |
| 1d | .113 | .062 | 1.33 | 33 | .051 |
|
|
Table 3: Overall percentage of bets accepted on answers and random
events in Experiment 1.
| Experiment | Answers | Random | t | df | p |
|
1a | 73.9 | 55.2 | 4.17 | 74 | .000 |
| 1b | 73.8 | 62.1 | 2.41 | 65 | .019 |
| 1c | 80.2 | 55.0 | 4.90 | 46 | .000 |
| 1d | 75.2 | 49.8 | 2.67 | 33 | .012 |
|
Average | 75.8 | 55.5 | | | |
|
|
Betting rates conditionalized on confidence are shown in Figure 1. We
found higher betting rates when participants bet on their own
knowledge, compared with bets that were identical in every statistical
way but appeared to rely on random events, at all confidence levels in
all sub-experiments. Because accuracy did not differ significantly
between groups, neither group experienced a systematically greater
proportion of won bets. In addition, because overconfidence did not
differ significantly between groups, neither group benefited from a
systematically more favorable outcome for betting. The comparison of
the betting curves is thus an appropriate reflection of the different
appearance of betting on knowledge versus betting on random events,
rather than a reflection of differing probabilities or magnitude of
possible outcomes. Had we found a trend of higher accuracy or
overconfidence in either group, the higher bet acceptance among those
betting on knowledge would have suggested a different explanation for
the difference in bet acceptance other than the difference between
groups.
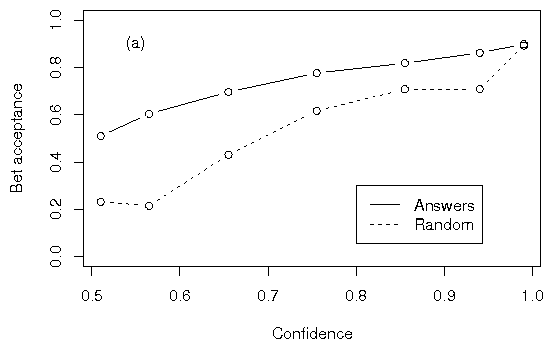
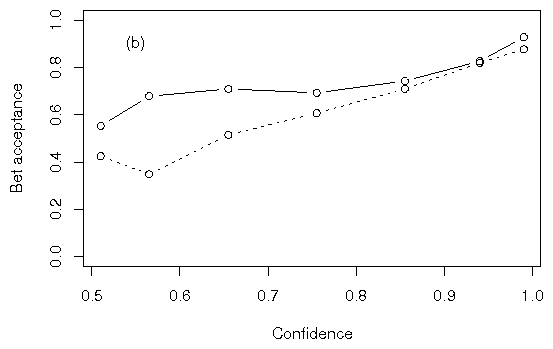
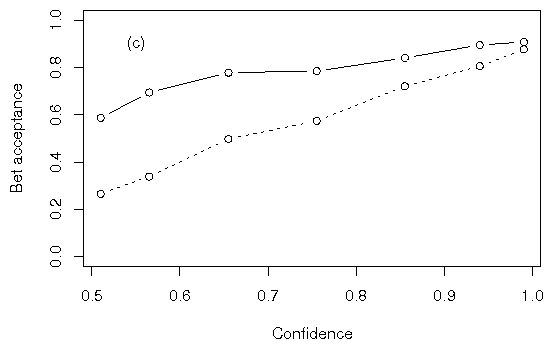
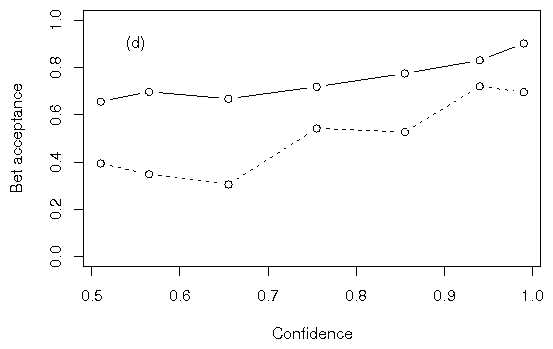 Figure 1: Proportions of bets accepted in
(a) Experiment 1a, (b) Experiment 1b, (c) Experiment 1c, and (d)
Experiment 1d. Mean bet acceptance was aggregated across all subjects
at each level of confidence, ignoring subject identity. At all
confidence levels in all sub-experiments, participants accepted bets
more frequently on answers than on random events.
The findings in bet acceptance mark a departure from what Goodie (2003,
Experiment 3) observed with items from assorted domains, where
participants bet on their knowledge relatively seldom at low levels of
confidence and increasingly often as confidence increased. In the
present experiments, rates of bet acceptance are higher for bets on
answers at all levels of confidence, though there is still an
increasing rate of bet acceptance as confidence increases, as can be
seen in Figure 1. The comparison between the present experiments with
single domains and past experiments with mixed domains resembles the
trend across experiments in Heath and Tversky (1991). When Heath and
Tversky narrowed the focus of questions, they observed a preference to
bet on items in domains in which participants had competence that did
not depend on probability level. That is, if a participant was
competent in the domain of politics but felt uncertain about a
particular political question, she still preferred to bet on that
answer rather than an equally uncertain random event or item from a
domain of incompetence. The current study incorporates the same
narrowing of focus to a single domain, relative to the studies of
Goodie (2003), and the same trend is observed: the increased risk
preference does not depend on probability level.
Table 4: Descriptive statistics of confidence, accuracy, overconfidence
and betting slope within the groups in Experiment 2.
Figure 1: Proportions of bets accepted in
(a) Experiment 1a, (b) Experiment 1b, (c) Experiment 1c, and (d)
Experiment 1d. Mean bet acceptance was aggregated across all subjects
at each level of confidence, ignoring subject identity. At all
confidence levels in all sub-experiments, participants accepted bets
more frequently on answers than on random events.
The findings in bet acceptance mark a departure from what Goodie (2003,
Experiment 3) observed with items from assorted domains, where
participants bet on their knowledge relatively seldom at low levels of
confidence and increasingly often as confidence increased. In the
present experiments, rates of bet acceptance are higher for bets on
answers at all levels of confidence, though there is still an
increasing rate of bet acceptance as confidence increases, as can be
seen in Figure 1. The comparison between the present experiments with
single domains and past experiments with mixed domains resembles the
trend across experiments in Heath and Tversky (1991). When Heath and
Tversky narrowed the focus of questions, they observed a preference to
bet on items in domains in which participants had competence that did
not depend on probability level. That is, if a participant was
competent in the domain of politics but felt uncertain about a
particular political question, she still preferred to bet on that
answer rather than an equally uncertain random event or item from a
domain of incompetence. The current study incorporates the same
narrowing of focus to a single domain, relative to the studies of
Goodie (2003), and the same trend is observed: the increased risk
preference does not depend on probability level.
Table 4: Descriptive statistics of confidence, accuracy, overconfidence
and betting slope within the groups in Experiment 2.
| | Accuracy | Confidence | Overconfidence |
|
Experiment 2a | | | |
|
City driving distance | .856 | .887 | .030 |
| State area | .799 | .843 | .044 |
| State population | .746 | .711 | -.035 |
| State population density | .707 | .742 | .035 |
| City population | .706 | .758 | .053 |
|
Experiment 2b | | | |
|
City driving distance | .840 | .868 | .028 |
| State area | .778 | .817 | .039 |
| State population density | .764 | .730 | -.033 |
| State population | .730 | .751 | .021 |
| City population | .691 | .741 | .049 |
|
|
2.3 Discussion
These results indicate that control affects risk attitude when extended
to the important case of a single domain, broadly across question
populations. This supports the conclusion of Goodie (2003) that control
affects risk attitude, but these findings suggest that the nature of
that effect may be different within single domains than in mixed
domains. Whereas in mixed domains participants showed betting
proportions that were lower at low judged probabilities and higher at
high judged probabilities (when compared to participants who bet on
random events), participants who bet on their answers in this
experiment accepted risk more often at all levels of confidence than
those who bet on random events.
Goodie (2003) discussed the possibility of modeling the effect of
control in terms of the probability weighting function proposed by
Gonzalez and Wu (1999). This weighting function includes two parameters
that are notable for their psychological plausibility: elevation, which
reflects the overall attractiveness of risk; and curvature, which
reflects the discriminability of different levels of probability.
Goodie (2003), interpreting the betting proportions that increased with
judged probability, speculated that the data could be accounted for by
positing a more linear weighting function under conditions of control.
The present data suggest that, when answering questions from
well-defined domains with random sampling and transparent rules (i.e.,
under representative sampling), control may increase the attractiveness
of risk and the elevation of the probability weighting function.
However, these data do not permit firm conclusions on the mathematical
form of the weighting function.
3 Experiment 2
In Experiment 1, the primary aim was to manipulate control to determine
its effect on risky decisions in single domains. In Experiment 2, in
order to test the competence hypothesis, we sought to observe
differences in competence through both correlation and experimental
manipulation and measure the effect of these competence differences on
performance measures. One way to obtain diverse degrees of competence
is to rely on naturally occurring variability in competence among
participants, observing performance differences that depend
correlationally on demonstrated knowledge in the content area. Another
way is to observe differences that arise between groups when groups are
given questions that differ in difficulty. We accomplished this by
using five question populations: comparisons between pairs of U.S.
states on population, land area and population density; and between
pairs from among the fifty largest U.S. metropolitan areas on
population and driving distance from Athens, Georgia. We assumed that
some of these question populations would be more difficult than others
and could be identified by showing a sizable degree of variability in
average accuracy between groups. We also assumed that some participants
would be more competent in each content area than others, which could
be identified by differences in accuracy. Would people display
different patterns of betting on a task characterized by control when
they have different degrees of competence?3 If so, the competence hypothesis would be
supported.
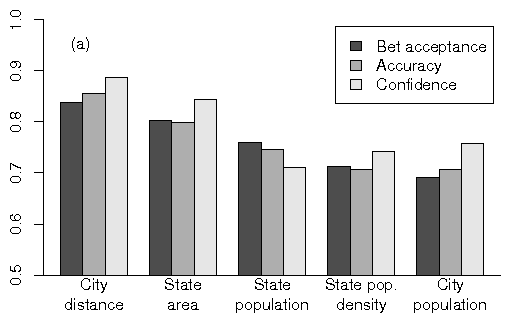
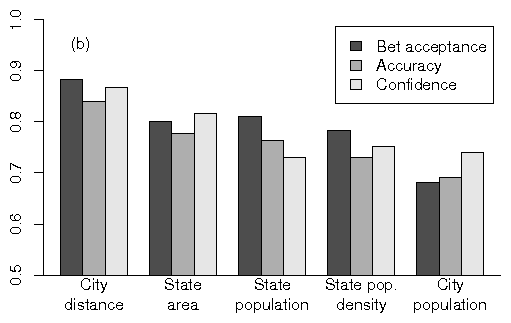 Figure 2: Overall bet acceptance, accuracy and confidence in the five
groups in (a) Experiment 2a and (b) Experiment 2b. Bet acceptance
correlated strongly with accuracy, but this could be partly
attributable to correlations between accuracy and confidence.
Figure 2: Overall bet acceptance, accuracy and confidence in the five
groups in (a) Experiment 2a and (b) Experiment 2b. Bet acceptance
correlated strongly with accuracy, but this could be partly
attributable to correlations between accuracy and confidence.
3.1 Method
Experiment 2a used the Mixed betting format; Experiment 2b used the
Gains Only betting structure. We randomly divided participants (N=112
for Experiment 2a, 152 for Experiment 2b) into five groups, with each
group differing in the domain of questions asked. Three groups answered
questions seeking comparisons between pairs of randomly selected U.S.
states on the dimensions of population (n=25 for Experiment 2a, 32 for
Experiment 2b), land area (n=25 for Experiment 2a, 32 for Experiment
2b) and population density (n=25 for Experiment 2a, 32 for Experiment
2b). The other two groups made binary comparisons between U.S. cities
on the dimension of metropolitan area population (n=18 for Experiment
2a, 28 for Experiment 2b) and driving distance from Athens, Georgia
(n=19 for Experiment 2a, 28 for Experiment 2b).
3.2 Results
3.2.1 Confidence, accuracy and calibration
Confidence, accuracy and overconfidence values for the two
sub-experiments are given in Table 4. Unlike in Experiment 1,
differences in accuracy and confidence were not only expected but
essential as a manipulation check for the effect of differential
competence on betting.
Average accuracy at the group level ranged from .706 to .856 in
Experiment 2a, and from .691 to .840 in Experiment 2b (Table
4). In a binary choice task, where the proportions are constrained to
[0.5,1.0], this overall accuracy range of .165 is considerable. The
differences among the groups defined by question domains were also
statistically significant. In Experiment 2a, for accuracy, F
(4,171)=22.2, p.001; for confidence, F (4,171)=22.6,
p.001. In Experiment 2b, for accuracy, F(4,145)=18.9,
p.001; for confidence, F(4,145)=15.0, p.001. The
robustness of the differences in accuracy among the groups is reflected
in a robust correlation of .864 between accuracy and confidence, using
group averages in both sub-experiments as the unit of analysis.
3.2.2 Bet acceptance
Overall bet acceptance in the two sub-experiments is presented in Figure
2 as a function of groups, shown in descending order of accuracy among
groups. Bet acceptance is closely correlated with accuracy at the group
level - in Experiment 2a, r=.98; in Experiment 2b, r=.96
(each correlation based on five pairs). Such a correlation is
the essential claim of the competence hypothesis; therefore, these very
strong correlations constitute prima facie evidence for the competence
hypothesis. However, one must remember that in such settings of betting
on knowledge, betting frequency correlates positively with confidence,
which is reflected in increasing betting curves such as those in Figure
1. Accuracy also correlates with confidence, as can also be seen in
Figure 2 - in Experiment 2a, r=.88; in Experiment 2b, r=.84 at the
group level. In short, when participants have competence, they also
have high confidence, which may account for the increased bet
acceptance. Consequently, as Heath and Tversky (1991) did in their
Experiment 4, domains must be compared at equivalent levels of
confidence.
We achieved this by comparing curves relating bet acceptance curves to
confidence. Betting proportions across confidence categories for the
five groups in both sub-experiments are shown in the two panels of
Figure 3; each point on the graph represents the proportion of bets
accepted at a given confidence level. The graph reflects increasing
risk seeking as a function of subjective probability in all groups.
Larger symbols reflect domains of greater accuracy. The competence
hypothesis predicts larger symbols to appear above smaller symbols, and
this prediction receives little support. It is clear that any
differences between groups are small and do not reflect a consistent
ordering as a function of competence.
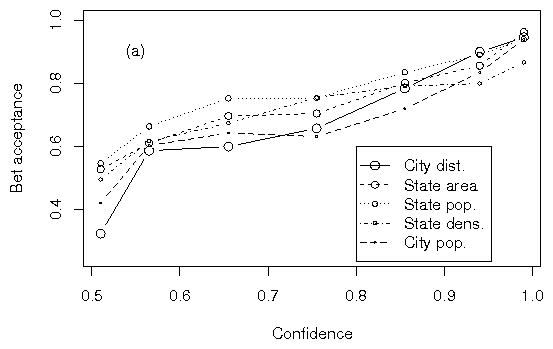
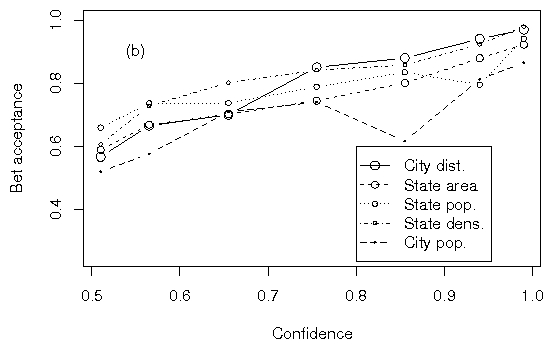 Figure 3: Bet acceptance among the five groups in (a) Experiment 2a and
(b) Experiment 2b. Groups with higher accuracy are depicted with larger
symbols.
Figure 3: Bet acceptance among the five groups in (a) Experiment 2a and
(b) Experiment 2b. Groups with higher accuracy are depicted with larger
symbols.
3.2.3 Individual variation
We also tested correlationally within groups for the effect of
individual variation in competence on bet acceptance curves. For this
analysis we constructed a linear model of each
participant's betting function, using confidence level
as the predictor variable and bet acceptance rate as the criterion. A
linear model was used because the betting function has consistently
been approximately linear at the group level in both Goodie (2003) and
the present studies. This produced a slope and y-intercept for each
participant. (Here, the y-axis reflects bet acceptance.) Then, in each
sub-experiment, we computed a partial correlation between each
individual's accuracy and the slope and intercept of
their betting functions, controlling for the average accuracy observed
in the participant's question domain group. We
performed this partial correlation in order to observe only individual
differences effects and not group treatment effects. In Experiment 2a,
neither slope (r(170)=.089 ; p=.247) nor intercept (r(170)=-.038 ;
p=.621) correlated significantly with accuracy. Given that slope was
not significantly related to competence, the intercept was a reasonable
measure of the overall attractiveness of risk. The absence of a
significant correlation indicates that competence did not increase risk
seeking. However, in Experiment 2b, as predicted by the competence
hypothesis, accuracy did correlate positively and significantly with
intercept (r(147)=.183, p.025), although the magnitude of
the correlation is relatively small. (Slope and accuracy did not
significantly correlate; r(147)=-.124, p=.133.)
3.3 Discussion
The results of these two sub-experiments provide further qualified
support for the competence hypothesis. The correspondence between
group-level accuracy and betting proportions is strikingly close,
which, in addition to supporting the competence hypothesis, also
bolsters the robustness of using binary choice tasks with a half-range
probability spectrum. However, the correlations between accuracy and
confidence, and between confidence and betting proportion, needed to be
taken into account, and this diminished the strength of evidence in
favor of the competence hypothesis. At the individual level, the
partial correlation between accuracy and betting curve elevation was
small but significant in Experiment 2b and non-significant in
Experiment 2a.
4 Experiment 3
In Experiment 3, in addition to risk acceptance data, we sampled
subjective measures of both competence and control. In this experiment,
we replicated the methods of the earlier experiments but sought further
to examine how participants' perceptions of their
competence and control correlated with performance measures.
4.1 Method
Participants (N=185) all encountered state population comparisons, in
the Gains Only betting format. They were divided into Answers (n=92)
and Random (n=93) groups, which differed as they did in Experiment 1.
In a third phase, all participants answered the following survey
questions:
1. How competent do you feel you are at this task?
2. How do you think your abilities at this task compare to others?
3. How much control do you feel you had over this task?
4. If you were to do this task again one week from now, how much could
you do between now and then to improve your performance?
Participants responded to these questions on a seven-point Likert scale
labeled from 1 (not at all) to 7 (very much). The first two questions
reflected responses to the term
"competence" and to a definition
of competence, respectively. The last two reflected responses to the
term "control" and a definition of
control utilized by Goodie (2003). The definition of competence
conveyed in Question 2 reflects just one of multiple possible
definitions. This definition is social in nature, comparing
one's competence with that of others. For both Heath
and Tversky (1991) and Fox and Tversky (1995), this is appropriate. We
framed the survey question in a social-comparative way because
non-comparative questions appeared to offer little more than synonyms
of competence. The definition of control conveyed in Question 4
represented an attempt to reduce confusion about possible alternative
definitions of the term control, such as internal control.
4.2 Results and Discussion
4.2.1 Calibration, overall bet acceptance and bet acceptance
curves
Average confidence across both groups was .759, average accuracy was
.751, and average overconfidence was .007. The difference between the
two groups was less than .007, and statistically non-significant, for
all three measures.
Once again, those betting on their own knowledge bet considerably more
frequently than those betting on events that were identical in every
statistical way but appeared random. The Answers group accepted 71.9%
of all bets, whereas the Random group accepted only 45.6% of all bets.
This difference was statistically significant (t(183)=7.77,
p.001); thus, Study 3 replicated the large effect of
control. Betting proportions across confidence categories for all three
groups are shown in Figure 4 and reflect greater risk acceptance in all
confidence categories when control prevails.
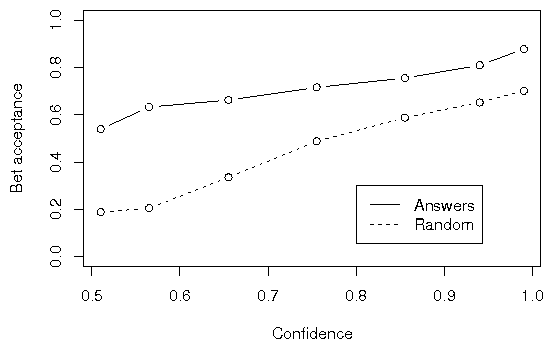 Figure 4: Bet acceptance in the two groups in Experiment 3. As in
Experiment 1, all calibration measures are equivalent, but the Answers
group accepted significant more bets.
Figure 4: Bet acceptance in the two groups in Experiment 3. As in
Experiment 1, all calibration measures are equivalent, but the Answers
group accepted significant more bets.
4.2.2 Survey results
Figure 5 depicts the survey results. On the seven-point scale that we
used, there was a large difference between the groups in the perception
of control as defined here (Question 4, t(183)=11.68,
p.001). There was also a marginally significant effect on
responding to the term "control"
(Question 3, t(183)=1.78, p=.077). There was a small but statistically
significant difference between the groups (t(182)=2.30;
p=.023) in response to the term
"competence" (Question 1) but in
the opposite direction to that predicted by the competence hypothesis,
with the Random group perceiving more
competence than the Answers group. There was no difference between
groups in perceptions of the social-comparative definition of
competence (Question 2). It would appear from these survey data that,
in the minds of our participants, the concept of control as defined
here is prominent in explaining the effect of the control manipulation
on risk taking. The term "control"
itself, however, proved less compelling a description of the difference
for our participants. Neither the term
"competence" nor its
social-comparative definition was able to account for how the groups
perceived their conditions. This preliminary survey demonstrates that
probability alterability appears to be pertinent to the perceived
decision making processes of participants, but the terms
"control" and
"competence" may not be what they
are thinking about.
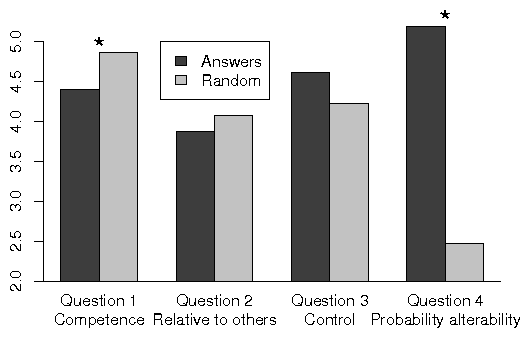 Figure 5: Survey results in Experiment 3. All responses were made on a
scale from 1 to 7. * p .05.
Figure 5: Survey results in Experiment 3. All responses were made on a
scale from 1 to 7. * p .05.
5 General Discussion
In three experiments, we assessed bet acceptance under ambiguity, where
determination of the uncertain outcome was based on ability rather than
a random event. This is a special case in the decision making
literature, which has been treated both in terms of competence (Heath
& Tversky, 1991) and control (Goodie, 2003). Control has been defined
as a characteristic of the task wherein there are steps that could
improve the probability of a favorable outcome. Competence is an
interactive property of both the task and the individual, wherein
improvement is possible and the participant has achieved it. According
to the control hypothesis, it is the possibility of improvement that
makes a difference.
In Experiment 1, using representative sampling in single domains, and
with all statistical properties of bets held constant between groups,
participants consistently accepted more bets when betting on their
answers than when betting on random events. At all confidence levels in
all experiments, those betting on their answers bet more frequently
than those betting on a random event. These results provided strong
support for the role of control in decision making.
In Experiment 2, overall bet acceptance was closely correlated
with accuracy when assessed across the groups that were exposed
to questions in differing domains. Such a correlation is the
essential claim of the competence hypothesis. However, the trend
of bet acceptance increasing with accuracy was not observed at
the group level when acceptance was conditionalized on
confidence. At the individual level, we found a significant
correlation between accuracy and intercept within groups in
Experiment 2b but not Experiment 2a.
In Experiment 3, as in Experiment 1, those betting on their own
knowledge bet considerably more frequently than those betting on events
that were identical in every statistical way but appeared random.
Survey results indicated a large difference between the groups in the
perception of control as defined here and a marginally significant
effect on responding to the concept
"control." We found no difference
between groups in perceptions of the concept
"competence" or its
social-comparative definition.
5.1 Competence or control?
The current results provide strong support for the effect of control
across a spectrum of degrees of competence, although there was also
some degree of evidence in support of an effect of competence.
Experiments 1 and 3 showed strong effects of control on risk
acceptance. Importantly, those experiments used the question domains of
city population and state population, which proved to be among the
domains with the lowest accuracy in Experiment 2. The average accuracy
using these two question domains was less than .75, lower than other
domains. Yet, participants consistently chose to bet on them much more
frequently than on equivalent random events. This provides evidence for
the effect of control even when competence is relatively low. This
supports the theoretical underpinning of control (Skinner, 1996) that
people demonstrate more persistence and initiative when control
prevails, perhaps to enhance future outcomes in domains where the
likelihood of success can be increased.
In Experiment 3, the perceptions of participants suggested that the
manipulation that had a profound effect on bet acceptance also affected
probability alterability and, to an extent that was only marginally
statistically significant, the term
"control." This may be
attributable at least in part to low accuracy; perhaps participants
betting on their own answers would have rated competence higher in a
similar setting but with easier questions. The conclusion remains,
however, that control increases risk taking, even when competence is
relatively low. These results are analogous to Cohen, Dearnaley, and
Hansel's (1956) finding that inexperienced and
experienced bus drivers assess future risky driving maneuvers
similarly; both groups of drivers accept risk at a relatively similar
rate.
We also found evidence to favor the competence hypothesis - that is,
people accept risk more often when they perceive themselves to be
competent than when they do not. In Experiment 2, bet acceptance at the
group level correlated extremely closely with accuracy. However, when
we controlled for the correlation between confidence and bet acceptance
by examining bet acceptance curves, we found no group-level correlation
between the intercept (overall elevation) of the betting curves and
average accuracy within groups and only limited correlation at the
individual level.
The present experiments utilized questions drawn from single domains,
which allowed for a more accurate assessment of true confidence within
that given set of questions than when utilizing questions drawn from
mixed domains (as in Goodie, 2003). In that study, bet acceptance was
low (Experiments 1 and 2) and lower than bet acceptance on matched
random events (Experiment 3) at low levels of confidence. However, when
low competence domains are removed in tests using single domains, bet
acceptance at the lowest levels of confidence increases. The comparison
between the present experiments and those of Goodie (2003) thus
provides support for the competence hypothesis.
5.2 Why did the present studies find less strong evidence for
the competence hypothesis?
The evidence to support the competence hypothesis was less strong in the
present studies than in those of Heath and Tversky (1991). Perhaps the
most striking finding of Heath and Tversky's studies
came in their Experiment 4, where participants who perceived themselves
as competent in one domain but incompetent in another consistently
preferred to bet on a random event over an event of matched probability
in the domain of incompetence. We didn't observe such
an effect in these studies - any time participants could bet on their
answers, they were considerably more prone to do so than bet on a
random event, even when their answers were not terribly competent.
Why did this difference emerge? The answer may relate to a special
feature of Heath and Tversky's sample. They sought
participants who felt themselves of above-average competence in either
football or political prediction, and also of below-average competence
in the other domain. Of 110 participants they screened, 25 (23 percent)
fit this criterion and constituted the sample. (Two of the 25 selected
participants declined to participate.) If participants were well
calibrated in evaluating their own abilities, and if these ratings were
independent of each other, then half of all screened participants would
fall on opposite sides of the median on the two measures. But less than
a quarter satisfied the criterion. Most of the screened participants
self-evaluated on the same side of the median for both tasks and were
thus excluded. The data reflected only the rather small minority who
placed themselves on opposite sides of the median for the two tasks.
This could reveal participants who feel unusually weak competence in
the weak area; it could reflect an individual difference that led these
subjects, in contrast with the majority, to self-evaluate divergently
in different domains. The larger effect observed by Heath and Tversky
could also be attributable to their use of within-subjects designs,
which may highlight comparisons among the three kinds of bets they
employed.
5.3 Probability weighting and control
Goodie (2003) suggested that, within the framework of prospect theory
(Kahneman & Tversky, 1979), the effect of control on decision making
might most fruitfully be attributed to an effect on the probability
weighting function considered from the perspective of the model offered
by Gonzalez and Wu (1999). This model in turn relied on advances of
Tversky and Wakker (1995) and Fox and Tversky (1995), demonstrating the
psychological plausibility and empirical validity of considering a
weighting function based on uncertain outcomes. These demonstrations
culminated in a two-stage model (Fox & Tversky, 1998) wherein
subjective probabilities elicited in a first stage can be weighted in a
second stage in a comparable manner to objective (known) probabilities.
The present studies adhered to this procedural framework.
In the studies of Goodie (2003), bet acceptance was an interactive
function of confidence and control, such that participants accepted
less often with control at low probabilities and more often with
control at high probabilities. Goodie attributed this to an effect on
the discriminability of probabilities. In the current experiments, no
such interaction was evident: participants accepted more often with
control than without across the entire spectrum of subjective
probability. Thus, in the terms of Gonzalez and Wu's
(1999) model, the effect of control may be better attributed to
attractiveness. In short, people accept more risk under conditions of
control than under conditions of no control. The idea of making
weighting functions sensitive to properties of the setting other than
perceived probability is not new. Kilka and Weber (2001) suggested that
the probability weighting function should be "source
dependent," which in their study reflected the
degree of competence participants perceived in the domain of the
uncertain judgment. The present experiments suggest that control may be
a relevant and systematic dimension guiding the source dependence of
the weighting function.
5.4 The importance of control
Natural decisions often contain an element of ability across domains.
Examples of this include business-related decisions such as those in
organizational management (Forlani, 2002; Hiller & Hambrick, 2005),
marketing (White, Varadarajan, & Dacin, 2003), and investment
(Fellner, Guth, & Maciejovsky, 2004); personal decisions such as mate
selection (Hinsz, Matz, & Patience, 2001) and child rearing (Pridham,
Denney, Pascoe, Chiu, & Creasey, 1995); health-related decisions such
as dieting, exercise, diagnosis and treatment; law-related decisions
such as regulation and jury decision making (Weinstock & Flaton,
2004), and even union leaders assessing random events, fictional
elections and real elections (Maffioletti & Santoni, 2005). In all
these cases, skill matters: some individuals can make systematically
better decisions than others with more favorable consequences, and each
individual can take steps to make better decisions. The effect of
controllable situations on decision-making is an important aspect of
decisions to study.
In one domain where control is present, March and Shapira (1987)
famously cautioned decision theorists that organizational managers view
the risks they take as being fundamentally different from gambling. To
the extent this is true, it diminishes the applicability to management
settings of the wealth of empirical decision research using real or
hypothetical lottery pulls, rolls of dice, or poker chips drawn from
bookbags. March and Shapira conclude, a bit cynically, that the
distinction is a matter of "managerial
conceit." In their view, managers suppose that the
risks they take are different from (and better than) gambling because
they are trained by societal norms to think so and also because among
managers whose decisions have coincidentally succeeded, just as among a
convention of lottery winners, the relative rate of winning is greater
than the odds that are built into the game.
The present results build on March and Shapira's
conclusion that the norms of society and the conceits of managers play
a role in managerial decision making. In managerial settings and many
other settings where control prevails - that is, where
one's actions are thought to make a difference in the
probability of success - the control itself makes a difference in
decision making.
More generally, the control hypothesis has both positive and negative
implications for applied decision making. The positive implication is
that people may be expected to adopt a relatively broad horizon,
sacrificing short-term expected value for the opportunity to learn and
develop skill that will enhance future prospects. The negative
implication is that, in cases where relatively short-term consequences
are major - for example, when it is important not just to learn for
the future but to manage the current organizational challenge, treat
the current patient successfully, or win the current war - people may
be excessively willing to accept risk even when they know they are
incompetent.
5.5 Limitations and future directions
These results may have been different if participants in the Random
groups were told that they were being given a bet concerning another
participant's answer and confidence assessment.
However, one might suspect that posing bets to participants in this
manner may instead measure a different, unintended construct, such as
skepticism in others' knowledge or social comparison
(Moore & Kim, 2003).
Also the current studies only offered bets whose probabilities of
winning were above 50%. This carries at least two limitations. First,
of course, half the probability spectrum is excluded. Second, the
excluded half is the lower half, and thus the many low-probability
events that are the subject of much research cannot be directly
addressed. However, although the range excludes half of the numerical
range between 0 and 1, it reflects the full range of competence from
random choice to full knowledge within a binary choice paradigm, and a
wide swath of this possible range was encompassed within the present
studies.
It is possible that participants would be motivated to perform
differently for money than they did for points in these studies. The
findings of Goodie and Fantino (1995) suggest that there may be little
effect. In the end, we subscribe to the prescription to do it both ways
(Hertwig & Ortmann, 1999), and have found essentially similar results
using monetary incentives (Young, Goodie, & Hall, 2007).
5.6 Conclusions
The present results provide evidence that control affects decision
making apart from competence. There is also new evidence that
competence affects decision making. The unique contribution of control
to decision making has important theoretical and applied implications,
suggesting that decisions may be influenced by the opportunity to
improve at tasks that can be learned, even at short-term expected loss,
in order to create more advantageous prospects in the future.
References
Baron, J. (2000). Thinking and deciding, (Third
Ed.) Cambridge University Press.
Burger, J. M., & Schnerring, D. A. (1982). The effects of desire for
control and extrinsic rewards on the illusion of control and gambling.
Motivation & Emotion, 6, 329-335.
Campbell, W. K., Goodie, A. S., & Foster, J. D. (2004). Narcissism,
confidence and risk attitude. Journal of Behavioral
Decision Making, 17, 297-311.
Chau, A. W., & Phillips, J. G. (1995). Effects of perceived control upon
wagering and attributions in computer blackjack. Journal of
General Psychology, 122, 253-269.
Chow, C. C., & Sarin, R. K. (2001). Comparative ignorance and the
Ellsberg Paradox. Journal of Risk and Uncertainty, 22,
129-139.
Cohen, J., Dearnaley, E. J., & Hansel, C. E. M. (1956). Risk and hazard:
Influence of training on the performance of bus drivers.
Operational Research, 7, 67-82.
Ellsberg, D. (1961). Risk, ambiguity, and the Savage axioms.
Quarterly Journal of Economics, 75, 643-669.
Fellner, G., Guth, W., & Maciejovsky, B. (2004). Illusion of expertise
in portfolio decisions: An experimental approach. Journal of
Economic Behavior and Organization, 55, 355-376.
Forlani, D. (2002). Risk and rationality: The influence of decision
domain and perceived outcome control on managers' high-risk decisions.
Journal of Behavioral Decision Making, 15, 125-140.
Fox, C. R., & Tversky, A. (1995). Ambiguity aversion and comparative
ignorance. Quarterly Journal of Economics, 110, 585-603.
Fox, C. R., & Tversky, A. (1998). A belief-based account of decision
under uncertainty. Management Science, 44, 879-895.
Fox, C. R., & Weber, M. (2002). Ambiguity aversion, comparative
ignorance, and decision context. Organizational Behavior and
Human Decision Processes, 88, 476-498.
Frisch, D., & Baron, J. (1988). Ambiguity and rationality.
Journal of Behavioral Decision Making, 1, 149-157.
Gigerenzer, G. (1991). How to make cognitive illusions disappear: Beyond
"heuristics and biases." In W.
Stroebe & M. Hewstone (Eds.), European review of social
psychology, (Vol. 2, pp.83-115). Chichester, England: Wiley.
Gilovich, T., Vallone, R., & Tversky, A. (1985). The hot hand in
basketball: On the misperception of random sequences. Cognitive
Psychology, 17, 295-314.
Gonzalez, R., & Wu, G. (1999). On the shape of the probability
weighting function. Cognitive Psychology, 38, 129-166.
Goodie, A. S. (2003). Paradoxical betting on items of high confidence
with low value: The effects of control on betting. Journal of
Experimental Psychology: Learning, Memory, and Cognition, 29, 598-610.
Goodie, A. S., & Fantino, E. (1995). An experientially derived
base-rate error in humans. Psychological Science, 6, 101-106.
Heath, C., & Tversky, A. (1991). Preference and belief - ambiguity and
competence in choice under uncertainty. Journal of Risk and
Uncertainty, 4, 5-28.
Hertwig, R., & Ortmann, A. (2001). Experimental practices in economics:
A methodological challenge for psychologists? Behavioral and
Brain Sciences, 24, 383-403.
Hiller, N. J., & Hambrick, D. C. (2005). Conceptualizing executive
hubris: The role of (hyper-) core self-evaluations in strategic
decision-making. Strategic Management Journal, 26, 297-319.
Hinsz, V. B., Matz, D. C., & Patience, R. A. (2001). Does
women's hair signal reproductive potential?
Journal of Experimental Social Psychology, 37, 166-172.
Kahneman, D., & Tversky, A. (1979). Prospect theory: An analysis of
decision under risk. Econometrica, 47, 263-291.
Kilka, M., & Weber, M. (2001). What determines the shape of the
probability weighting function under uncertainty? Management
Science, 47, 1712-1726.
Koehler, J. J., Gibbs, B. J., & Hogarth, R. M. (1994). Shattering the
illusion of control: Multi-shot versus single-shot gambles.
Journal of Behavioral Decision Making, 7, 183-191.
Langer, E. J. (1975). The illusion of control. Journal of
Personality and Social Psychology, 32, 311-328.
Maffioletti, A., & Santoni, M. (2005). Do trade union leaders violate
subjective expected utility?: Some insights from experimental data.
Theory and Decision, 59, 207-253.
March, J. G., & Shapira, Z. (1987). Managerial perspectives on risk and
risk-taking. Management Science, 33, 1404-1418.
Moore, D. A., & Kim, T. G. (2003). Myopic social prediction and the solo
comparison effect. Journal of Personality and Social
Psychology, 85, 1121-1135.
Nelson, T. O., & Narens, L. (1980). Norms of 300 general-information
questions: Accuracy of recall, latency of recall, and
feeling-of-knowing ratings. Journal of Verbal Learning and
Verbal Behavior, 19, 338-368.
Pridham, K., Denney, N., Pascoe, J., Chiu, Y. M., & Creasey, D. (1995).
Mothers solutions to child-rearing problems - conditions and
processes. Journal of Marriage and the Family, 57, 785-799.
Seligman, M. E. P. (1975). Helplessness: On depression, development, and
death. San Francisco: Freeman.
Sieck, W. R., & Arkes, H. R. (2005). The recalcitrance of
overconfidence and its contribution to decision aid neglect.
Journal of Behavioral Decision Making, 18, 29-53.
Skinner, E. A. (1996). A guide to constructs of control. Journal
of Personality and Social Psychology, 17, 549-570.
Tversky, A., & Wakker, P. P. (1995). Risk attitudes and decision
weights. Economectrica, 63, 1255-1280.
Weinstock, M. P., & Flaton, R. A. (2004). Evidence coverage and argument
skills: Cognitive factors in a juror's verdict choice.
Journal of Behavioral Decision Making, 17, 191-212.
White, J. C., Varadarajan, P. R., & Dacin, P. A. (2003). Market situation
interpretation and response: The role of cognitive style,
organizational culture, and information use. Journal of
Marketing, 67, 63-79.
Young, D. L., Goodie, A. S., & Hall, D. B. (2007). Modeling effects of
perceived control on the probability weighting function. Unpublished
manuscript, University of Georgia.
Footnotes:
1This research was supported by National Institutes of Health research
grant MH067827. Address correspondence to: Adam S. Goodie, Department
of Psychology, University of Georgia, Athens, GA 30602-3013; Phone
706-542-6624; Fax 706-542-3275; Email goodie@uga.edu
2State population was
taken as the 1999 Census Bureau estimate, and population density was
the ratio of population to land area. Questions involving city
comparisons used the 50 largest metropolitan areas in the continental
U.S., to eliminate the confusion involved in considering driving
distance to San Juan, Puerto. City population was taken as the
population of the entire metropolitan area as identified by the Census
Bureau (this was made clear in the instructions), and driving distance
was the distance to the central city.
3In their empirical
studies, Heath and Tversky (1991) established two levels of competence,
but they did not claim that competence is an inherently binary
construct. We take it to be a variable that can have several levels,
and that may be continuous.
File translated from
TEX
by
TTH,
version 3.67.
On 14 Jun 2007, 16:19.