Judgment and Decision Making, vol. 2, no. 1, February 2007, pp. 1-8.

Actor/observer asymmetry in risky decision making

Diego Fernandez-Duque1     & Timothy Wifall
Department of Psychology
Villanova University

Abstract

Are people willing to gamble more for themselves than what they deem reasonable for others? We addressed this question in a simplified computer gambling task in which subjects chose from a set of 10 cards. Subjects selected one card at a time after being instructed that 9 cards were good (win a dollar per card) and one was really bad (lose all the money and end the game). Subjects could stop playing at any time to collect their winnings. Some subjects played the game, others observed a confederate. Both groups took risks beyond what was rational (i.e., 5 cards) but \textit{actors} were riskier than \textit{observers}. The actor/observer asymmetry occurred even after controlling for monetary outcome (i.e., having observers win prizes) and after controlling for how the question was framed (i.e., asking observers what they themselves \textit{would} do as opposed to what the confederate \textit{should} do). We discuss these results in relation to theories of decision making that emphasize separate contributions of rational and experiential systems.

Keywords: metacognition, gambling, affect.


1  Introduction

You are at the casino watching a game of Black Jack, when a player who has a hand of sixteen asks for another card. You quip to yourself "What an idiot! He should have held at 16." But who's to say you wouldn't have done the same? After all, decision making for the self is likely to depend on cues and processes that are not available when judging the choices of others. The reward of having drawn a good card, the prospect of winning, the potential regret of overreaching, all are blunted to a detached observer. Then again, you may reach the same decision whether you are an actor or observer, as much of the information needed, including success probability, prize size, and potential loss are all available for a "rational" choice.
As this example illustrates, decision making is influenced both by rational and experiential factors (Denes-Raj & Epstein, 1994). The rational processes are effortful and logical, using a cost/benefit analysis to determine the best choice (Epstein, Pacini, Denes-Raj, & Heier, 1996; Kahneman & Frederick, 2002; Slovic, Finucane, Peters, & MacGregor, 2002; Stanovich & West, 2000). In contrast, the experiential processes are intuitive and emotionally-based, using heuristics and the history of reward and punishment to determine the next behavior (Epstein et al., 1996). Presumably, experiential processes weigh more heavily in actors' decisions than in observers' judgments (Beisswanger, Stone, Hupp, & Allgaier, 2003; Borresen, 1987; Hsee, & Weber, 1997; Loewenstein, Weber, Hsee, & Welch, 2001; Wray & Stone, 2005). One reason for this is that actors may have privileged access to their own affective reactions (Bem, 1972; Gopnik, 1993; Jones & Nisbett, 1972; Knobe & Malle, 2002). Furthermore, actors' affective system is tapped by rewards and punishments (Rolls, 2004). In contrast, observers usually are not affected by these and, when they are, the influence of rewards and punishments is diminished by their being decoupled from the action.
In simple terms, it can be argued that rewarded actions will show a tendency to be repeated. Thus, the occurrence of reward should motivate actors to repeat the rewarded action with disregard for the potential costs and beyond what observers would deem reasonable.2 In the current study, we explored this specific instance of the actor/observer asymmetry and its relation to the rational/experiential dichotomy. For this, we used a modified version of a task first developed for studying risk taking in children (Slovic, 1966). In this paradigm, ten cards were displayed on the computer screen and subjects were told that nine cards were good and would pay a dollar each, while one card was disastrous and would make them lose all the money they had collected thus ending the game. Subjects turned one card at a time and decided when to stop to collect their prize. The task could be solved by deciding in advance how many cards to turn, or sequentially by deciding whether to turn the next card. Either way, the expected value in this task is highest for turning five cards (Slovic, 1966). Thus, a rational decision maker should stop after turning 5 cards. In two experiments, we explored possible departures from rational decision making, and whether such departures were moderated by active task participation.

2  Experiment 1

Experiment 1 was our initial exploration on a possible actor/observer asymmetry and therefore the design aimed to maximize the differences between actor and observer conditions. Actors played the game and were rewarded at every turn. They were told to play "as well as possible" but were allowed to risk as much as they wanted. In contrast, observers did not play the game and were not rewarded. Their instructions emphasized ideal performance by asking whether the actor should turn another card. Experiment 1 also explored possible contributions of individual differences to the actor/observer asymmetry.

2.1  Method

2.1.1  Subjects

Ninety-seven undergraduates participated in this study for course credit (49 females, 48 males; mean age: 19.3 years; range: 18 to 24 years). Demographic information was not gathered, but based on the composition of the student population at this private institution, the majority of the sample was White, Catholic, and upper-middle class.
fig1.png
Figure 1: The stimulus screen as displayed following the selection of the first card. The nine cards remaining appear face down in the middle of the screen. To the left, the selected card appeared face up. To the right the amount of money won up to that point was displayed. In the lower right part of the screen, a box reminded subjects that they could click to stop playing and collect the prize. In the bottom part of the screen, a yellow banner reminded subjects of the number of cards remaining, below which were the main instructions for the task.
fig2.png
Figure 2: The selection of a card was immediately followed by a "charm" tone and feedback screen informing the subject that she won another dollar, as well as a display of the card selected.

2.1.2  The Card Task

Equipment: Stimuli were displayed on a 17-inch computer monitor and managed using E-prime, a commercial experiment application.
Stimulus and Procedure. Subjects played the game only once. The game stimulus screen is illustrated in Figure 1. Using the mouse, the subject could either play by selecting a face down card or stop the game by clicking the check-out box. If a card was selected, a "charm" tone and a feedback screen immediately followed for two seconds. Unknown to subjects, any choice led to "win" feedback for the first 8 cards. In other words, the disaster card was displayed only when/if the subject turned the ninth card thus allowing assessment of the full range of risk taking behavior. The feedback screen displayed the identity of the selected card and informed the subject that she had won another dollar (see Figure 2). The identity of the cards was fixed to ensure that all subjects received the same feedback.3 Following the feedback screen, an updated version of the stimulus screen appeared. The updated information included a reduction in the number of cards available for selection, an increase in the amount of money won, and the addition of the most recently selected card to the pile of cards already chosen. These updates occurred each time a card was selected until the subject stopped or turned the ninth card. If/when the ninth card was selected, the feedback screen displayed the joker against a red background with a message informing the subject that she had lost, accompanied by a loud tone.
At the beginning of the task, subjects were read the following instructions from the computer screen:
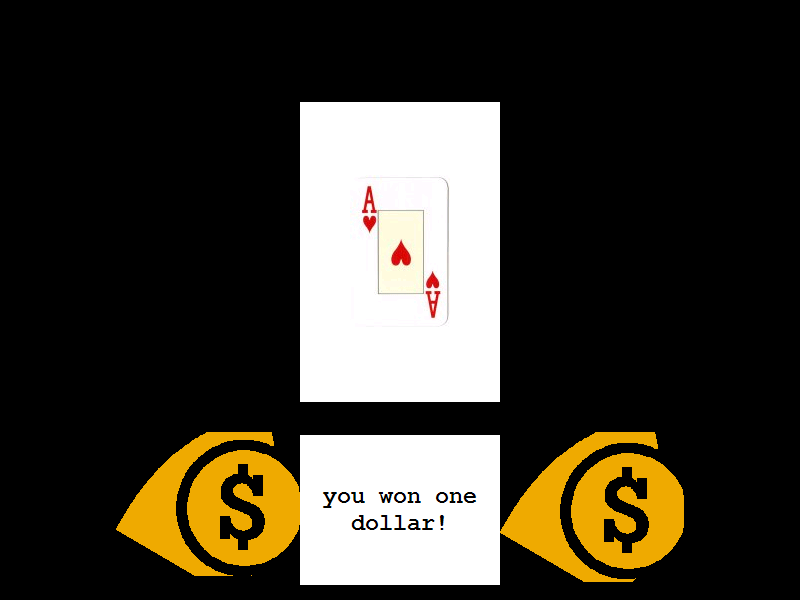
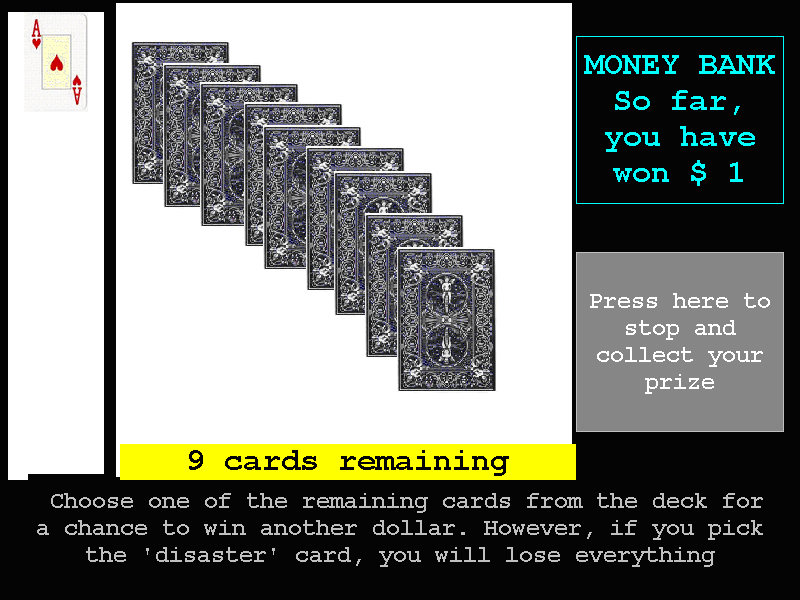
In the deck there are 10 cards. Nine cards are good and one is bad. You will win one dollar for each "good" card you turn but if you turn the bad card you will lose everything and the game will end. You will get to keep whatever money you win, so try to play as well as possible. Choose one card at a time by clicking on it.
Subjects were also told that the bad or "disaster" card was denoted as the Joker and was randomly placed within the set of ten cards. We also highlighted to subjects that they would get to play only once, and could stop at any time to collect their prize. While the subject performed the task, the experimenter stood behind her recording the number of cards turned over. The task ended when the subject either stopped or hit the "disaster" card (9 card). At that time, winners collected their prize, and all subjects completed a debriefing questionnaire (see below).
Subjects were randomly assigned to either playing the game or observing another player (a confederate). Subjects in the observer condition heard the same instructions in the company of a student from our lab who served as a confederate. Observers were then told that they would be in another room watching the confederate play. We explained that only the confederate would play and potentially win a prize. From the observing room, observers were able to see the computer screen, the confederate, and the experimenter; they could also hear the "winning" tones. We stressed to observers that their answers had no bearing on the choices made by the confederate and that the confederate could not hear what was said in the observing room.
Each time the stimulus screen appeared, the confederate allowed approximately 10 sec to pass before making the next choice to ensure the observer had adequate time to answer the question "should he/she [confederate] turn over the next card?" The experimenter recorded the observer's response in a sheet of paper. The question was asked each trial until the observer answered that the confederate should stop or that she should turn over the 9 card. To guarantee that observers could go up to nine cards if they chose to, the confederate always turned over eight cards, independently of the observer's choice. When the game ended, the confederate was given 8 dollars, and the observer was asked to complete the debriefing questionnaire.
Debriefing questionnaire: To assess whether subjects trusted the instructions, we asked subjects whether they had believed the game to be real (as opposed to being "rigged") and that money would be awarded.
To assess their understanding of choices as applied to the task, we asked the following two questions in fixed order:
To assess the influence of affect, subjects were asked whether they based the decision to stop on how they felt. To assess the influence of reason, subjects were asked whether they based the decision to stop on an assessment of risk probability. In other words, the report of how much the decision to stop was based on probabilities was used as a proxy for the extent to which subjects were inclined to think rationally. These questions were asked to both actors and observers. Finally, to assess a possible moderating role of empathy, observers were asked whether they put themselves in "the other person's shoes" when deciding whether to stop. Each debriefing question was answered in a 5-point scale (1=strongly disagree; 5=strongly agree).
Measures of Individual Differences: Before participating in the Card task, subjects completed a Regret Proneness scale and a Change Aversion scale. After the Card task, most subjects completed a Numeracy questionnaire, a Faith in Intuition scale and a Need for Cognition scale. The questionnaires were administered in the same order. Six subjects in the Actor group did not complete any of these questionnaires, and another six subjects (3 observers, 3 actors) failed to complete the Faith in Intuition questionnaire. A brief description of each of these measures appears in the Appendix.
Table 1: Mean answers (sd) to debriefing questionnaire by group, Experiment 1.
Group:
Question Actor Observer
Game was not rigged 4.89 (0.32) 4.80 (0.40)
Best strategy is to turn up 5 cards 3.80 (1.10) 3.66 (1.15)
Best strategy is to turn up 8 cards 3.42 (1.26) 3.36 (1.42)
Decision to stop was based on probability 3.15 (1.39)   3.84(1.07)*
Decision to stop was based on feeling 3.63(1.22) 3.93(1.07)
Empathize with player n/a 4.31 (1.06)
Only data for subjects with score higher than 3 are reported (n=85), as subjects with scores of 3 or lower were excluded from all the analyses.
* p .05

2.2  Results

Eight actors and 4 observers who during debriefing reported not having believed the game to be real (i.e., they had thought it was rigged or believed that money would not be awarded) were excluded from the analyses.4 Data from the remaining 40 actors (20 females) and 45 observers (22 females) were analyzed. A preliminary analysis revealed no gender main effect nor an interaction with group, so gender was not included in the analyses.
Actors and observers both took larger risks (i.e., turned over more cards) than was rational, as revealed by one-sample t-tests against the rational choice (i.e., 5 cards), t(39) = 7.1, p = .001 (CI: 1.34 - 2.41) and t(44) = 4.7, p = .01 (CI: .58 - 1.46). More importantly, actors took larger risks than observers (Mact = 6.88, SD = 1.67; Mobs = 6.02, SD = 1.47), as revealed by an independent-samples t-test t(83) = 2.5, p = .01 (CI: .18 - 1.53 ). Actors were also more willing than observers to take the extreme risk of turning over the 9 card, an option chosen by 9 of 40 actors and none of the 45 observers, c2 (1, N = 85) = 11.3, p = .001, phi = .36. Given the bimodal distribution of actors' choices, we ran non-parametric statistics to confirm that actors were riskier than observers, Mann-Whitney U = 2.3, p = .02.
Table 1 shows data from the debriefing questionnaire. There were no differences between actors and observers in their assessment of how good a strategy it was to stop at 5th card, t(83) = .8, p = .4. Nor did they differ on how good it was to stop at the 8 card, t(83) = .2, p = .8. These findings rule out differences in task interpretation as a possible cause of the actor/observer asymmetry. Relative to observers, actors reported relying less on probabilities for deciding when to stop, t(83) = -2.6, p = .01, (CI: -1.2 - -.2). This was particularly true of actors who took the extreme risk of turning nine cards (no observer turned 9 cards). Those nine riskiest players reported relying less on probabilities than more cautious players, as revealed by an independent samples t-test, t(38) = -3.3 p = .002, (CI: -2.6 - -.6). In sum, actors seem to have made lesser use of the rational system than observers and as a consequence they engaged in riskier behavior. Although the reported use of emotions in deciding when to stop did not differ between groups, subjects who relied more on emotion did take larger risks, as revealed by a Spearman's rho correlation, rs(85) = .24, p = .03. Finally, 84% of the observers either "agreed" or "strongly agreed" having put themselves in the "player's shoes" when deciding whether it was time to stop, revealing a high degree of empathy on the part of the observers.
To explore the moderating effects of individual differences on risk-taking behavior and the actor/observer asymmetry, we conducted regression analyses. In each analysis, we entered Group as a dichotomous variable (actor, observer) and the standardized scores of one of the individual difference measures as a continuous variable. For the Faith in Intuition scale we had data from 31 actors and 42 observers. The regression analysis revealed that Faith in Intuition was positively related to risk-taking behavior, t(70) = 2.3, p = .02. The more people trusted their intuitive judgment, the more risk they were willing to take, r = .26, a result that replicates previous findings (Levin, Gaeth, Schreiber, & Lauriola, 2002; Epstein et al., 1996). The interaction between Faith in Intuition and Group failed to reach significance, t(69) = 1.5, p = .13.5 None of the other individual difference measures had a significant main effect on risk taking nor a moderating effect on the actor/observer asymmetry.

2.3  Discussion

Experiment 1 revealed an actor/observer asymmetry in risky decision making. Both actors and observers took irrational risks, but risk taking was more pronounced for actors than for observers. Consistent with the idea that the observer condition favored the use of analytical skills, observers reported relying on probabilities more than actors. This suggests a preferred role for reason when judging the decisions of others.
Several factors may explain this pattern of results. Obviously, the two conditions differed on whether the subject actively participates in the task, a fact that the label "actor/observer asymmetry" refers to. Having taken an action (i.e., having chosen a certain card) and having obtained a reward from such an action, players may have been motivated to disregard potential costs and continue playing. Alternatively, the action itself may have been irrelevant and the effect driven by the positive monetary outcome. In other words, actors may have risked more than observers because actors (but not observers) won money at every turn. Finally, actors and observers may have conceptualized the task differently, with actors deciding to stop based on their desires and observers choosing based on the normative answer. In other words, although subjects were told to play "as well as possible" actors may have decided to risk beyond what they deemed reasonable. For observers, the instructions left no room for ambiguity, the ideal performance being stressed each time they were asked whether the actor "should turn another card".
In sum, the actor/observer asymmetry found in Experiment 1 may have stemmed from group differences in (a) task participation, (b) monetary outcome, and/or (c) how the question was framed. We tested these alternatives in the next study.

3  Experiment 2

Experiment 2 aimed to rule out differences in monetary outcome as the cause for the actor/observer asymmetry. Observers' prizes were tied to the confederates' performance, thus equating monetary outcome across groups. Unlike the previous experiment, in Experiment 2 there were two groups of observers: some observers were asked what the confederate should do while other observers were asked what they themselves would do if they were in that situation. Testing both observer groups in the same experiment allowed us to assess whether performance was influenced by how the question was framed.

3.1  Method

Table 2: Mean answers (sd) to debriefing questionnaire by group, Experiment 2.
Group:
Question Actor Observer-Should Observer-Would
Game was not rigged 4.84 (0.37) 4.79 (0.43) 4.88 (0.33)
Best strategy is to turn up 5 cards 3.42 (1.02) 3.64 (1.01) 3.88 (0.86)
Best strategy is to turn up 8 cards 3.84 (1.07) 3.43 (1.34) 3.41 (1.46)
Decision to stop was based on probability   2.79 (1.32)* 3.57 (1.40) 3.71 (1.21)
Decision to stop was based on feeling 4.11(0.94) 3.57 (1.34) 4.00 (1.12)
Empathize with player n/a 3.50 (1.16)   4.29 (0.77)*
Only data for subjects with score higher than 3 are reported, as subjects with scores of 3 or lower were excluded from all the analyses.
* p .05

3.1.1  Subjects

Seventy-one undergraduates participated in this study for course credit (40 females, 31 males) (mean age: 19.4 years; range: 18 to 22 years).

3.1.2  Procedure

.
Observers were told that they would win the same prize as the confederate. A subset of observers were asked "what would you do?" instead of being asked "what should s/he do?" No measures of individual differences were collected in this experiment. All other aspects of the stimuli and procedure were identical to Experiment 1, including the instructions to observers that their judgment would not influence the confederate choices.

3.2  Results and Discussion

Twenty-one subjects who during debriefing reported not having believed the game to be real (i.e., they had thought it was rigged or believed that money would not be awarded) were excluded from the analyses.6 These included 3 subjects in the actor condition, 7 in the observer-should condition, and 11 in the observer-would condition. Data from the remaining 19 actors (8 females) and 14 subjects in the observer-should condition (9 females) and 17 subjects in the observer-would condition (12 females) were analyzed.
How the question was framed to observers ("should she turn another card?", "would you turn another card?") had no significant effect (Mobs-should = 6.29, SD = .61; Mobs-would = 6.35, SD = 1.27), t (29) = .2, p = .8. Thus, for testing the actor/observer asymmetry we combined the observer groups into a single group. As in Experiment 1, actors took larger risks than observers (Mact = 7.00, SD = 1.25; Mobs = 6.32, SD = 1.01) as revealed by an independent-samples t-test, t(48) = 2.1, p = .04 (CI: .03 - 1.33).7 There was a trend for actors to take the extreme risk of turning over the 9 card more frequently than observers, as 2 of 19 actors and none of the 31 observers took this option, c (1, N = 50) = 3.4, p = .065.
Table 2 shows data from the debriefing questionnaire. As expected, asking observers what they would do (as opposed to what the confederate should do) led to a stronger endorsement of "being in the other person's shoes", as revealed by an independent-samples t-test between the two observer groups, t(29) = 2.3 p = .03. There were no other significant differences between the two observer groups in the debriefing questions (p .35). Thus, the two groups combined were compared to the actor group. As in experiment 1, observers reported using probabilities to a larger extent than actors, t(48) = 2.3 p = .03. None of the other debriefing questions revealed a significant difference between actors and observers (p .2).
Experiment 2 replicated the findings of Experiment 1 while controlling for monetary outcome and for how the question was framed.8 This provides evidence for a true actor/observer difference that was dependent on the active participation in the task.

4  General Discussion

This study revealed an actor/observer asymmetry in risky decision making. Both actors and observers took irrational risks, but risk taking was more pronounced for actors (Experiments 1 & 2). Relative to actors, observers seemed to favor the use of analytical skills, reporting a greater reliance on probabilities. These actor/observer asymmetries occurred even when monetary outcome was controlled for (Experiment 2). Thus, it was not simply that people were riskier after receiving a monetary incentive. Rather, rewards had a specific effect on the actor.
Our preferred interpretation of these results is that the actor/observer asymmetry is mediated by differential access to experiential and rational systems. Having made a decision and having that choice rewarded, actors exhibit a tendency to repeat the same behavior. It remains a question for future research why active participation is so important. One possibility is that actors in this task are more prone to a confirmation bias than observers and thus gain a false sense of skill about avoiding the disaster card (Jenkins & Ward, 1965). It is also possible that positive outcomes caused by self-generated choices (actor condition) have a larger hedonic value than positive outcomes generated by others' actions (observer condition), even if the monetary value is the same for both conditions. Finally, it is possible that actors decided to risk beyond what they deemed reasonable. People often make choices that go against their goals, and a growing literature suggests that choices often are based on affective evaluations (Baron, 1994; Kahneman & Frederick, 2002; Slovic, Finucane, Peters, & MacGregor, 2004).
In the mind of an actor, there may be no difference between preferred and ideal: picking a card when she has a good feeling about it is playing as well as possible. To the extent that decisions and judgments are influenced by emotions and wishful thinking, it may be impossible and unwise to control for it. The actor/observer asymmetry reported here may be a special case of a more general phenomenon. In other words, actors may be prone to conflate what they think will happen with what they hope will happen, due to an increased reliance on the experiential system. We think (hope) our study provides the first step toward testing these ideas.

References

Baron, J. (1994). Nonconsequentialist decisions. Behavioral and Brain Sciences, 17, 1-42.
Beisswanger, A. H., Stone, E. R., Hupp, J. M., & Allgaier, L. (2003). Risk-taking in relationships: differences in deciding for oneself versus for a friend. Basic and Applied Social Psychology, 25, 121-135.
Bem, D. J. (1972). Self-perception theory. In L. Berkowitz (Ed.), Advances in experimental social psychology, Vol. 6, pp. 1-62. New York: Academic Press.
Borresen, C. R. (1987) Decision making as a function of self and others. Perceptual & Motor Skills, 64, 1301-1302.
Denes-Raj, V., & Epstein, S. (1994). Conflict between intuitive and rational processing: When people behave against their better judgment. Journal of Personality and Social Psychology, 66, 819-829.
Epstein, S., Pacini, R., Denes-Raj, V., & Heier, H. (1996). Individual differences in intuitive-experiential and analytical-rational thinking styles. Journal of Personality and Social Psychology, 71, 390-405.
Gopnik, A. (1993). How do we know our minds: The illusion of first-person knowledge of intentionality. Behavioral and Brain Sciences, 16, 1-14.
Hsee, C. K., & Weber, E. U. (1997). A fundamental prediction error: self - other discrepancies in risk preference. Journal of Experimental Psychology: General, 126, 45-53.
Jenkins, H. M., & Ward, W. C. (1965). Judgment of contingency between responses and outcomes. Psychological Monographs: General and Applied, 79 (Whole No. 594), 17.
Jones, E. E., & Nisbett, R. E. (1972). The actor and the observer: Divergent perceptions of the cause of behavior. In E. E. Jones, D. E. Kanouse, H. H. Kelley, R. E. Nisbett, S. Valins, & B. Weiner (Eds.), Attribution: Perceiving the causes of behavior, pp. 79-94. Morristown, NJ: General Learning Press.
Kahneman, D., & Frederick, S. (2002). Representativeness revisited: Attribute substitution in intuitive judgment. In T. Gilovich, D. Griffin, & D. Kahneman (Eds.), Heuristics and biases: The psychology of intuitive judgment, pp. 49-81. New York. Cambridge University Press.
Knobe, J., & Malle, B. F. (2002). Self and other in the explanation of behavior: 30 years later. Psychologica Belgica, 42, 113-130.
Levin, I. P., Gaeth, G. J., Schreiber, J., & Lauriola, M. (2002). A new look at framing effects: distribution of effect sizes, individual differences, and independence of types of effects. Organizational Behavior and Human Decision Processes, 88, 411-429.
Lipkus, I. M., Samsa, G., & Rimer, B. K. (2001). General performance on a numeracy scale among highly educated samples. Medical Decision Making, 21, 37-44.
Loewenstein, G. F., Weber, E. U., Hsee, C. K., & Welch, E. S. (2001). Risk as feelings. Psychological Bulletin, 127, 267-286.
Rolls, E.T. (2004) The functions of the orbitofrontal cortex. Brain and Cognition, 55, 11-29.
Slovic, P. (1966). Risk-taking in children: Age and sex differences. Child Development. 37, 169-176.
Slovic, P,, Finucane, M. L., Peters, E., & MacGregor, D. G. (2004). Risk as analysis and risk as feelings: Some thoughts about affect, reason, risk, and rationality. Risk Analysis, 24, 311-322.
Slovic, P., Finucane, M.L., Peters, E., & MacGregor, D.G. (2002) The affect heuristic. In T. Gilovich & D. Griffin & D. Kahneman (Eds)., Heuristics and biases: The psychology of intuitive judgment pp. 397-420. New York. Cambridge University Press.
Stanovich, K. E., & West, R. F. (2000). Advancing the rationality debate. Behavioral and Brain Sciences, 23, 701-726
Stone, E. R., Yates, A. J., & Caruthers A. S. (2002). Risk taking in decision making for others versus the self. Journal of Applied Social Psychology, 32, 1797-1824.
Washburn, D. A. (2005). Regret proneness, change aversion, and risk aversion. Poster presented at the Annual Meeting of the Society for Judgment and Decision Making, Toronto, Canada.
Wray, L. D., & Stone, E. R. (2005) The role of self-esteem and anxiety in decision making for self versus others in relationships. Journal of Behavioral Decision Making, 18, 125-144.
Zeelenberg, M. (1999). Anticipated regret, expected feedback and behavioral decision making. Journal of Behavioral Decision Making, 12, 93-106.

Appendix. Individual difference measures and their correlations

Regret Proneness Scale. This is a 20-item questionnaire with items such as "I feel sorry for the opportunities that I have missed" and "it does not bother me to make a bad decision". Answers are in a 4-point scale (0 = never, 1 = seldom, 2 = occasionally, 3 = always) (Washburn, 2005). The Cronbach's alpha for the scale was 0.83.
Change Aversion Scale. This 12-item questionnaire asks about attitudes people have regarding change. A typical item states "if something is not working, I try something new". Answers are in a 4-point scale (1 = definitely yes, 2 = usually yes, 3 = usually no, 4 = definitely no) (Washburn, 2005). The Cronbach's alpha for the scale was 0.83. This scale has been shown to be positively related to regret proneness, motivating its inclusion in this study.
Numeracy scale: This scale includes eleven items testing comprehension of probabilistic information. A typical item asks "The chance of getting a viral infection is .0005. Out of 10,000 people, about how many of them are expected to get infected?" Subjects have to fill in the blank. (Lipkus, Samsa, & Rimer, 2001). The Cronbach's alpha for the scale was 0.48.
Faith in Intuition: This 12-item questionnaire assesses people's confidence about their feelings as bases for decision making (Epstein et al., 1996). Typical items include "I trust my feelings about people" and "I believe in trusting my hunches". Subjects answer in a 5-point scale. The Cronbach's alpha for the scale was 0.74.
Need for Cognition: This shortened version of the original Need for Cognition scale has been validated in previous studies (Epstein et al., 1996). It contains 19-items in a 5-point scale. A typical item states "I prefer my life to be filled with puzzles that I must solve." The Cronbach's alpha for the scale was 0.86.

Footnotes:

1We thank the students in our lab who helped us collecting data for this study: Hrsoula Davis, Adrienne Fallon, Adriana Lombardi, Sarah Irvin, MaryBeth Greene, Jessica Landers, Kevin Williams, and Justin Benincasa. Address: Diego Fernandez-Duque, Psychology Department, Villanova University, 800 Lancaster Ave., Villanova, PA 19085, USA. Email: diego.fernandezduque@villanova.edu
2There may be other experiential factors that could reduce the asymmetry by leading actors away from risk. For example, the anticipated regret of hitting the disaster card may discourage actors from taking larger risks (Zeelenberg, 1999).
3The sequence of displayed cards was: Ace of hearts, eight of spades, Queen of diamonds, Jack of clubs, Ace of spades, ten of diamonds, Queen of clubs, and ten of hearts.
4Only subjects who strongly or moderately agreed to both questions were retained.
5The non-significant trend toward an interaction raises the possibility that faith in intuition may act as a moderator of the actor/observer asymmetry. Although testing this hypothesis would require a study with a larger sample and more statistical power, it is worth mentioning that faith in intuition was positively related to risk taking in actors, r(31) = .43, p = .02, but not in observers, r(42) = .11, p = .5.
6We excluded from the analysis any subject who did not strongly or moderately agreed with both questions. Although this strict criterion resulted in the exclusion of 30% of subjects, all the results reported remained unchanged with the inclusion of these subjects. In fact, the data were almost identical.
7The same result was obtained with a non-parametric statistics, Mann-Whitney U = 1.94, p = .05
8Data from an unpublished experiment from our lab suggest that when responding in the absence of monetary reward, the actor/observer asymmetry may indeed depend on how the question is framed.


File translated from TEX by TTH, version 3.74.
On 8 Feb 2007, 13:06.