Judgment and Decision
Making, vol. 1, no. 2, November 2006, pp. 134-145.
Are medical treatments for individuals and groups
like single-play and multiple-play gambles?
Michael L. DeKay1
John C. Hershey
Mark D. Spranca
Peter A. Ubel
David A. Asch
Abstract
People are often more likely to accept risky monetary gambles with
positive expected values when the gambles will be played more than
once. We investigated whether this distinction between single-play and
multiple-play gambles extends to medical treatments for individual
patients and groups of patients. Resident physicians and medical
students (n = 69) and undergraduates (n = 99) ranked
9 different flu shots and a no-flu-shot option in 1 of 4 combinations
of perspective (individual patient vs. group of 1000 patients) and
uncertainty frame (probability vs. frequency). The rank of the
no-flu-shot option (a measure of preference for treatment vs. no
treatment) was not significantly related to perspective or participant
population. The main effect of uncertainty frame and the interaction
between perspective and uncertainty frame approached significance (0.1
> p > 0.05), with the no-flu-shot
option faring particularly poorly (treatment faring particularly well)
when decisions about many patients were based on frequency information.
Undergraduate participants believed that the no-flu-shot option would
be less attractive (treatment would be more attractive) in decisions
about many patients, but these intuitions were inconsistent with the
actual ranks. These results and those of other studies suggest that
medical treatments for individuals and groups are not analogous to
single-play and multiple-play monetary gambles, perhaps because many
people are unwilling to aggregate treatment outcomes over patients in
the same way that they would compute net gains or losses over monetary
gambles.
Keywords: aggregation, fungibility, individuals versus groups, medical
treatment decisions, multiple-play, repeated-play.
1 Introduction
1.1 Single-play and multiple-play gambles
A convincing body of research demonstrates that people often make
different choices when making multiple-play decisions
than when making single-play decisions. Samuelson (1963)
initiated this literature with a revealing anecdote about a lunch
colleague who would reject a single gamble with an even chance of
winning $200 or losing $100, but who would accept a series of
100 such gambles. Subsequently, several studies have indicated
that people are more likely to accept mixed gambles (i.e.,
gambles involving a possible gain and a possible loss) with
positive expected values (EVs) when the gambles will be played
more than once (Benartzi & Thaler, 1999; DeKay & Kim, 2005;
Keren, 1991; Klos, Weber, & Weber, 2005; Langer & Weber, 2001;
Li, 2003; Redelmeier & Tversky, 1992; Wedell & Böckenholt,
1994), although the opposite result has been also been observed
(Benartzi & Thaler, 1999; Langer & Weber, 2001). Multiple plays
of Samuelson-type gambles are particularly attractive when
participants are shown the distribution of possible outcomes
resulting from repeated plays (Benartzi & Thaler, 1999; DeKay &
Kim, 2005; Langer & Weber, 2001; Redelmeier & Tversky, 1992).
Although the rationality of making different choices for single-play and
multiple-play gambles has been debated (Lopes, 1981, 1996; Nielsen,
1985; Ross, 1999; Samuelson, 1963; Schoemaker & Hershey, 1996; Tversky
& Bar-Hillel, 1983), this article is concerned primarily with the
empirical distinction. Related research shows that multiple plays may
also increase the attractiveness of higher-EV unmixed gambles
(Montgomery & Adelbratt, 1982; but see Chen & Corter, 2006, for
conflicting evidence); reduce the incidence of certainty and
possibility effects (Barron & Erev, 2003, Experiment 5; Keren, 1991;
Keren & Wagenaar, 1987); reduce choosing/pricing preference reversals
(Wedell & Böckenholt, 1990); reduce the "illusion of control"
(Budescu & Bruderman, 1995; Koehler, Gibbs, & Hogarth, 1994); and
facilitate the multiplicative combination of probabilities and outcomes
(Joag, Mowen, & Gentry, 1990). Taken together, these results indicate
that choices and preferences are often more consistent with expected
value theory and/or expected utility theory when multiple plays are
considered.
2 Medical treatments for individuals and groups
One limitation of the research cited above is that the studies have
focused almost exclusively on monetary gambles or other financial
decisions (e.g., Joag et al., 1990, studied industrial purchasing
decisions). A few researchers have attempted to assess whether the
results generalize to decisions about medical treatments. For example,
Redelmeier and Tversky (1992) reported that physicians and students
were more likely to recommend a risky positive-EV treatment to an
individual patient with chronic knee pain when they considered repeated
treatments rather than a single treatment. This finding is consistent
with those for monetary gambles.
More frequently, studies have involved the treatment of multiple
patients rather than multiple treatments of the same patient.
Redelmeier and Tversky (1990) reported that physicians and students who
considered an individual patient (the individual perspective)
often made different decisions from those who considered a group of
comparable patients (the group perspective). In their
adverse-outcomes scenario, for example, students who
considered an individual woman with a blood condition were more likely
to recommend a risky positive-EV treatment than were participants who
considered many women. This result and others reported by Redelmeier
and Tversky (1990) appear to contradict the literature on single-play
and multiple-play gambles. If treating a group of similar patients is
analogous to playing a gamble multiple times, one might predict that a
risky positive-EV treatment would be viewed more favorably in the group
perspective than in the individual perspective.
However, other researchers have not found significant differences
between medical treatments for individuals and groups. DeKay et
al. (2000) were unable to replicate Redelmeier and Tversky's
(1990) results for the adverse-outcomes scenario, despite ample
statistical power. Indeed, participants were slightly more
likely to recommend treatment in the group perspective when the
wording of the response options was improved. DeKay and Kim
(2005) also reported no significant difference between the
individual and group perspectives for a closely related scenario.
Hux, Levinton, and Naylor (1994) found no evidence that
physicians' willingness to prescribe a medication to an
individual patient differed from their willingness to recommend
the medication in a practice guideline. Finally, Spranca, Minsk,
and Baron (1991) and Ritov and Baron (1990) reported
nonsignificant effects of perspective for students' evaluations
of a risky medical procedure and a risky flu vaccination,
respectively.2
Understanding these results is important because medical practice
guidelines frequently reflect the group perspective adopted in
randomized clinical trials, decision analyses, and cost-effectiveness
analyses. If people think differently about medical treatments for
individuals and groups, these differences may help to explain why
physicians often deviate from practice guidelines when treating
individual patients (Asch & Hershey, 1995; Kosecoff et al., 1987;
Lomas et al., 1989; Sackett, 1989; Sorum et al., 2003; Timmermans,
Sprij, & de Bel, 1996; Woo, Woo, Cook, Weisberg, & Goldman, 1985). If
not, then explanations for the discrepancy between practice guidelines
and actual practice must be sought elsewhere.
3 Study: Ranking several treatment options and a
no-treatment option
3.1 Overview
The study described here was designed to provide additional insight into
the distinction between medical decisions for individuals and groups.
Although the study did not involve monetary gambles, our use of risky
positive-EV treatments allows a straightforward comparison to the
literature on single and multiple plays of mixed monetary gambles.
This investigation extends previous research on medical decisions for
individuals and groups in three ways. First, we utilized a new task
that involved ranking several treatment options (different flu shots)
and a no-treatment option, with the rank of the no-treatment option
serving as the primary dependent measure. This task may have been more
subtle than the dichotomous-choice and single-treatment rating tasks
used in previous studies (DeKay & Kim, 2005; DeKay et al., 2000; Hux
et al., 1994; Redelmeier & Tversky, 1990). It was somewhat similar to
the separate ratings of the treatment and no-treatment options in
studies of omission bias (Ritov & Baron, 1990; Spranca et al., 1991),
although there were more treatment options in this study.
Second, we included the framing of uncertainty as an additional
variable. Perspective (individual vs. group) and uncertainty frame
(probability vs. frequency) have occasionally been confounded in past
research (e.g., Redelmeier & Tversky, 1990; Spranca et al., 1991),
presumably because it is natural to describe uncertainty in terms of
probabilities when considering an individual and in terms of
frequencies when considering a group. This confound is potentially
important because reasoning is often improved when frequencies rather
than probabilities are used, although the reasons and required
conditions for this performance difference are still debated (Cosmides
& Tooby, 1996; Gigerenzer, 1991, 1996a, 1996b; Gigerenzer & Hoffrage,
1995; Kahneman & Tversky, 1996; Mellers, Hertwig, & Kahneman, 2001;
Tversky & Kahneman, 1983). DeKay et al. (2000) crossed perspective and
uncertainty frame and found that uncertainty frame was not a
significant predictor of treatment recommendations. Our design was
similar, but we used absolute frequencies (e.g., 600 out of 1000
people) rather than relative frequencies (e.g., 60% of people) in this
study, because relative frequencies may be treated more like
probabilities (Gigerenzer & Hoffrage, 1995).
Third, we asked both medical experts (resident physicians and medical
students) and undergraduates to complete the same task, because
previous studies have varied in their use of physician and lay
participants. Redelmeier and Tversky (1990) surveyed both physicians
and students (for different questions), Hux et al. (1994) surveyed
physicians, DeKay et al. (2000) surveyed the general public, and the
remaining studies of medical decisions for individuals and groups used
student participants.
3.2 Method
Perspective (individual vs. group), uncertainty frame (probability vs. frequency), and participant population (resident physicians and medical
students vs. undergraduates) were crossed in a 2 × 2
× 2 between-participants factorial design. Participants from
each population were randomly assigned to the four versions of survey
materials.
3.2.2 Participants
Fifty-eight resident physicians in internal medicine and 13 advanced
medical students from the Hospital of the University of Pennsylvania
received cookies in return for their participation. The mean age was 28
(range = 22-48) and 49% were female. Two residents were dropped
because they did not rank all of the treatment options.
Ninety-nine undergraduates were recruited by placing signs in the
University of Pennsylvania Department of Psychology. They received
$6.00 per hour for participation in various experiments. Demographic
data were not collected.
3.2.3 Materials and procedures
Participants read a cover story describing "a new strain of flu that is
likely to sweep the region in the next few months." In the frequency
frame, participants were told: "If no vaccine is administered, 600 out
of every 1000 people in this region are expected to catch the flu. 400
out of every 1000 people are expected not to catch the flu.
Unfortunately, there is no way to predict ahead of time who will catch
the flu and who will not." The story also indicated that nine new
vaccines had been developed to combat this strain of flu and that these
vaccines had been tested on "a large sample of patients who are very
similar to your patients." In addition to reducing the number of
patients who would catch the flu, the vaccines were also said to lead
to occasional "adverse reactions" that were "TWICE AS BAD as
catching the flu."
We provided participants with a shuffled deck of 10 cards describing the
vaccines and the "No Flu Shot" option and asked them to rank the
options from best (1) to worst (10). In the frequency frame, the cards
included bar graphs depicting the "Distribution of Patient Outcomes"
(i.e., the "Number of Patients" expected to experience the three
possible outcomes: "Reaction," "Flu," and "No Flu"), along with
an "Average Quality of Life" score (defined as "the mean of the
distribution of patient outcomes when the worst possible outcome is
given a score of 0 and the best possible outcome is given a score of
100") and an "Outcome Variability" score (the standard deviation of
that distribution). In the probability frame, the text and graphs used
"Percent Chance," "Distribution of Possible Outcomes," "Expected
Quality of Life," and "Outcome Uncertainty" instead. Figure 1
provides two examples of the stimuli. Table 1 describes all nine
vaccines and the no-flu-shot option. Note that all of the vaccines had
higher average-quality-of-life scores than the no-flu-shot option, so
that they might appear realistic.
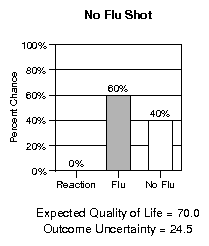
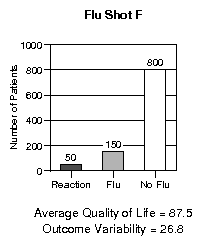 Figure 1: Examples of stimuli that appeared on cards. The
no-flu-shot option is shown in the probability frame and flu
shot F (the best of the flu shots) is shown in the frequency
frame.
In the individual and group perspectives, participants were asked to
think about which of the 10 options they would recommend to their
"individual patient" or to their "1000 patients," respectively.
Undergraduates also indicated whether the no-flu-shot option would
appear better or worse if viewed from the other perspective. For
example, participants who had ranked the options in the individual
perspective were asked, "Do you think the No Flu Shot option would
appear better or worse if you were treating 1000 similar patients?"
Figure 1: Examples of stimuli that appeared on cards. The
no-flu-shot option is shown in the probability frame and flu
shot F (the best of the flu shots) is shown in the frequency
frame.
In the individual and group perspectives, participants were asked to
think about which of the 10 options they would recommend to their
"individual patient" or to their "1000 patients," respectively.
Undergraduates also indicated whether the no-flu-shot option would
appear better or worse if viewed from the other perspective. For
example, participants who had ranked the options in the individual
perspective were asked, "Do you think the No Flu Shot option would
appear better or worse if you were treating 1000 similar patients?"
3.3 Hypotheses
Based on previous research, we expected that perspective would not
significantly affect treatment preferences. We also expected that the
effect of uncertainty frame would be nonsignificant, based on DeKay et
al.'s (2000) result. We did not have specific expectations for the
effect of participant population, for interactions between the three
predictors, or for undergraduates' intuitions regarding the adoption of
the alternative perspective. The study was exploratory with respect to
those issues.
3.4 Results
3.4.1 Rank of the no-flu-shot option
The mean rank of the no-flu-shot option was 8.29 (where 1 = best option
and 10 = worst option; see Table 1); only flu shot D was ranked worse
(M = 9.02). In fact, 56.5% of participants ranked the
no-flu-shot option as worst (see Table 2), perhaps because all of the
flu shots had higher EVs. The rank of the no-flu-shot option and the
percentage of participants ranking it as worst may be considered
measures of participants' relative preference for treatment versus no
treatment in the different conditions of the study. The higher the rank
and the greater the percentage, the more treatment was preferred.
Table 1: Attributes (frequency versions)
and mean ranks of treatment options, including the no-flu-shot
option.
| | Expected number of patients | | | |
| | with each outcome | | | |
| (r)2-4
| Adverse
| | | Average
| Outcome
| |
| Option
| reaction
| Flu
| No flu
| quality of life
| uncertainty
| Mean rank
|
|
No flu shot
| 0
| 600
| 400
| 70.0
| 24.5
| 8.29 (0.19)
|
|
Flu shot F
| 50
| 150
| 800
| 87.5
| 26.8
| 1.25 (0.07)
|
| Flu shot A
| 50
| 250
| 700
| 82.5
| 28.6
| 3.38 (0.11)
|
| Flu shot B
| 50
| 350
| 600
| 77.5
| 29.5
| 5.90 (0.14)
|
|
Flu shot G
| 100
| 100
| 800
| 85.0
| 32.0
| 2.72 (0.11)
|
| Flu shot E
| 100
| 200
| 700
| 80.0
| 33.2
| 5.02 (0.08)
|
| Flu shot I
| 100
| 300
| 600
| 75.0
| 33.5
| 7.61 (0.09)
|
|
Flu shot C
| 150
| 50
| 800
| 82.5
| 36.3
| 4.90 (0.17)
|
| Flu shot H
| 150
| 150
| 700
| 77.5
| 37.0
| 6.90 (0.12)
|
| Flu shot D
| 150
| 250
| 600
| 72.5
| 37.0
| 9.02 (0.09)
|
|
|
We conducted a 2 (perspective) × 2 (uncertainty frame)
× 2 (participant population) ANOVA for predicting the rank of
the no-flu-shot option, using standard regression techniques for
contrast-coded predictors and their interactions (Judd & McClelland,
1989). Results indicated a nearly significant effect of uncertainty
frame, F(1, 160) = 3.20, p = 0.076, such that the
no-flu-shot option was ranked worse (treatment was ranked better) when
frequencies were used (M = 8.60) than when probabilities were
used (M = 7.98; see Table 2).
There was also a nearly significant interaction between perspective and
uncertainty frame, F(1, 160) = 2.89, p = 0.092, with
the no-flu-shot option receiving particularly low evaluations
(treatment receiving particularly high evaluations) when the group
perspective was coupled with frequency information (see Table 2). The
difference between the mean ranks of the no-flu-shot option in the
individual and group conditions was positive in the probability frame
(individual - group = 8.40 - 7.54 = 0.86) but negative in the
frequency frame (8.39 - 8.79 = -0.40). However, the effect of
perspective was not significant in either frame, both Fs
£ 2.22, both ps ³ 0.141. Looking at the
interaction the other way, the difference between no-flu-shot ranks in
the frequency and probability frames was positive in the group
perspective (frequency - probability = 8.79 - 7.54 = 1.25) but close
to zero in the individual perspective (8.39 - 8.40 = -0.01). The
simple effect of uncertainty frame was significant in the group
perspective, F(1, 80) = 6.00, p = 0.016, but not in
the individual perspective, F 1, suggesting that
the distinction between probabilities and frequencies was more relevant
when many patients were considered.
Table 2: Mean ranks of the no-flu-shot
option and percentages of participants ranking the no-flu-shot option
as worst.
| | Perspective | | |
|
| | Individual | Group | Total |
| (lr)3-4(lr)5-6(lr)7-8
Participants
| Frame
| M
| %
| M
| %
| M
| %
|
|
Physicians
| Probability
| 8.33
(0.66)
| 66.7
(11.1)
| 7.29
(0.78)
| 41.2
(11.9)
| 7.83
(0.51)
| 54.3
(8.4)
|
| Frequency
| 8.56
(0.58)
| 68.8
(11.6)
| 9.00
(0.40)
| 66.7
(11.1)
| 8.79
(0.35)
| 67.6
(8.0)
|
| Total
| 8.44
(0.44)
| 67.6
(8.0)
| 8.17
(0.45)
| 54.3
(8.4)
| 8.30
(0.31)
| 60.9
(5.9)
|
| Undergraduates
| Probability
| 8.44
(0.45)
| 56.0
(9.9)
| 7.71
(0.53)
| 45.8
(10.2)
| 8.08
(0.35)
| 51.0
(7.1)
|
| Frequency
| 8.28
(0.45)
| 48.0
(10.0)
| 8.64
(0.41)
| 64.0
(9.6)
| 8.46
(0.30)
| 56.0
(7.0)
|
| Total
| 8.36
(0.32)
| 52.0
(7.1)
| 8.18
(0.34)
| 55.1
(7.1)
| 8.27
(0.23)
| 53.5
(5.0)
|
| All participants
| Probability
| 8.40
(0.38)
| 60.5
(7.5)
| 7.54
(0.44)
| 43.9
(7.8)
| 7.98
(0.29)
| 52.4
(5.4)
|
| Frequency
| 8.39
(0.35)
| 56.1
(7.8)
| 8.79
(0.29)
| 65.1
(7.3)
| 8.60
(0.23)
| 60.7
(5.3)
|
| Total
| 8.39
(0.26)
| 58.3
(5.4)
| 8.18
(0.27)
| 54.8
(5.4)
| 8.29
(0.19)
| 56.5
(3.8)
|
|
|
No other main effects or interactions approached significance, all
Fs 1. In particular, the effect size for the main
effect of perspective, f = 0.0026 (Cohen,
Cohen, West, & Aiken, 2003, p. 94), was much smaller than that for
Redelmeier and Tvesky's (1990) adverse-outcomes scenario,
f = 0.045, and similar to that in DeKay et
al.'s (2000) exact replication of the adverse-outcomes scenario,
f = 0.0035. In this study, the power for
detecting an effect as large as that reported by Redelmeier and
Tversksy (1990) was 0.78. The power for detecting a "medium" effect
was greater than 0.99 if medium is defined as
f = 0.15 (Cohen et al., p. 95). Our
observed effect was noticeably smaller than Cohen et al.'s "small"
effect of f = 0.02.
When only the individual/probability and group/frequency conditions were
considered, as in Redelmeier and Tversky (1990), the difference was not
significant, F 1, f =
0.0097. Consistent with the above interaction, the direction of this
nonsignificant difference was opposite that reported by Redelmeier and
Tversky (1990), with the no-flu-shot option faring slightly worse
(treatment faring slightly better) in the group/frequency condition
than in the individual/probability condition (see Table 2).
In sum, these analyses indicate that the distinction between the
individual and group perspectives was not particularly important for
this task, although perspective may have moderated the effect of
uncertainty frame. However, it is possible that the nonsignificant
results were caused by a floor effect involving the rank of the
no-flu-shot option. To address this concern, we dropped participants
who ranked that option as worst. The remaining 73 participants ranked
the no-flu-shot option very similarly in the individual and group
perspectives (M = 6.14 and M = 5.97, respectively).
There were no significant effects in the three-way ANOVA, all
Fs £ 2.19, all ps ³ 0.144, indicating
that the original results were not due to a floor effect.3
3.4.2 Within-participant regressions
Although the mean rank of the no-flu-shot option did not vary
significantly as a function of perspective, it is possible that
participants in the different conditions weighted other information
(e.g., the chance of an adverse reaction) differently when ranking the
options, and that the no-flu-shot option was rated as systematically
better or worse than might be expected on the basis of that
information. To assess this possibility, we conducted a series of
within-participant regressions. Two models (2 and 4) included a dummy
code for the no-flu-shot option, whereas the other two (1 and 3) did
not.
In model 1, we regressed the ranks of the 10 options onto the percentage
of patients expected to experience adverse reactions and the percentage
expected to experience neither adverse reactions nor the flu (in the
individual perspective, we used the percent chance of these outcomes).
The mean unstandardized regression coefficients appear in Table 3. As
expected, participants gave higher (worse) ranks to options with more
adverse reactions, and lower (better) ranks to options with more no-flu
outcomes, both ts ³ 25.07, both
ps 0.0001. In model 3, we used average quality of
life (or expected quality of life) and outcome variability (or outcome
uncertainty) as predictors. As expected, participants gave lower
(better) ranks to options with higher average quality of life and
higher (worse) ranks to options with higher outcome variability, both
ts ³ 8.40, both ps
0.0001. The results of both models are consistent with loss
aversion (i.e., steeper utility functions below a reference point than
above it) and with risk aversion (i.e., concave utility functions). For
example, the relative magnitude of the two coefficients in model 1
(0.349/0.223 = 1.57) is consistent with loss aversion, assuming that
our cover story established "catching the flu" as the reference
point. Participants' self-reported information use provided additional
support for this reference point and for loss aversion or risk aversion
(analyses omitted for brevity).
Table 3: Mean unstandardized regression
coefficients from within-participant regressions for predicting ranks
of treatment options, including the no-flu-shot option.
| Model 1
| Model 2
| Model 3
| Model 4
|
|
Intercept
| 17.305
(0.392)
| 17.713
(0.634)
| 34.861
(1.320)
| 34.983
(2.343)
|
| Percentage with adverse
reaction (worst outcome)
| 0.349
(0.014)
| 0.343
(0.017)
| | |
| Percentage with no flu
(best outcome)
| -0.223
(0.005)
| -0.228
(0.008)
| | |
| Average quality of life
| | | -0.432
(0.012)
| -0.433
(0.019)
|
| Outcome variability
| | | 0.149
(0.018)
| 0.147
(0.028)
|
| No-flu-shot option
(dummy)
| | -0.312
(0.296)
| | -0.028
(0.340)
|
|
Mean adjusted R
| 0.847
| 0.903
| 0.836
| 0.898
|
|
|
In models 2 and 4, we added a dummy code for the no-flu-shot option to
models 1 and 3, respectively. The coefficient for the dummy code was
not significantly different from zero in either case, t(167) =
-1.06, p = 0.293 in model 2 and t(167) = -0.08,
p = 0.933 in model 4. The fact that the no-flu-shot option was
not given special standing suggests that status-quo bias (Samuelson &
Zeckhauser, 1988) and omission bias (Baron, 1992; Ritov & Baron, 1990,
1992; Spranca et al., 1991) were relatively unimportant in the ranking
task.
To assess whether information use varied across conditions, we used the
10 coefficients for the predictor variables in models 1-4 of Table 3
as the dependent variables in a series of 2 (perspective)
× 2 (uncertainty frame) ANOVAs. None of the 30 main effects
and interactions was significant at the p 0.05
level, suggesting that reasoning was similar across conditions. Results
were very similar when we dropped those participants who ranked the
no-flu-shot alternative as worst, and when we considered only the
individual/probability and group/frequency conditions, as in Redelmeier
and Tversky (1990). In fact, the mean coefficients for percentage with
adverse reaction, percentage with no flu, average quality of life, and
outcome variability were significantly different from zero in all four
combinations of perspective and uncertainty frame,
ts ³ 2.45, ps £
0.018 in 31 of 32 tests, and t(42) = 1.83, p = 0.074
in the 32nd (8 coefficients × 4 conditions = 32 tests). In
contrast, the mean coefficient for the no-flu-shot dummy code never
approached significance, all ts £
1.15, all ps ³ 0.258 in eight tests (2 coefficients
× 4 conditions = 8 tests). Thus, these analyses yielded no
evidence whatsoever that the relative preference for treatment versus
no treatment was related to perspective or uncertainty frame.
3.4.3 Undergraduates' intuitions about different numbers
of patients
When asked whether the no-flu-shot option would
appear better or worse if viewed from the other perspective
(e.g., if they were treating 1000 patients instead of just one),
73% of undergraduates who responded indicated that it would. We
used ordinal logistic regression to predict whether the
no-flu-shot option would appear worse than, the same as, or
better than it had in the original perspective, using perspective
change, uncertainty frame, and their interaction as predictors.
Responses were significantly related to perspective change,
OR = 1.82, Wald c =
8.78, p = 0.003, but not to uncertainty frame,
OR = 1.09, Wald c =
0.18, p = 0.674 (see Table 4). Participants who
originally considered one patient said that the no-flu-shot
option would appear worse (treatment would appear better) if they
considered 1000 patients, S = -144.5 for the Wilcoxon
signed rank test, p = 0.002. Participants who originally
considered 1000 patients said that the no-flu-shot option would
appear better (treatment would appear worse) if they considered
one patient, but this trend was not significant, S = 70,
p = 0.174.
Table 4: Numbers of undergraduates
reporting that the no-flu-shot option would appear worse, the same, or
better if viewed from the other perspective.
|
| | Evaluation of the no-flu-shot option
in the new perspective |
|
| | Worse than in
| Same as in
| Better than in |
| Change in perspective
| original
| original
| original |
| Frame
| (original Þ new)
| perspective
| perspective
| perspective |
|
Probability
| Individual Þ group
| 11
| 8
| 5
|
| Group Þ individual
| 8
| 5
| 8
|
| Frequency
| Individual Þ group
| 14
| 7
| 3
|
| Group Þ individual
| 5
| 5
| 13
|
| Total
| Individual Þ group
| 25
| 15
| 8
|
| Group Þ individual
| 13
| 10
| 21
|
|
|
The main effect of perspective change was qualified by a nearly
significant interaction with uncertainty frame, OR = 1.39,
Wald c = 2.73, p = 0.098,
such that the above effects of perspective change were stronger in the
frequency frame than in the probability frame (see Table 4). For
frequencies, the simple effect of perspective change was significant,
OR = 2.56, Wald c = 9.83,
p = 0.002, with the no-flu-shot option appearing worse
(treatment appearing better) when perspective shifted from the
individual to the group. For probabilities, the simple effect of
perspective change was in the same direction, but was not significant,
OR = 1.31, Wald c = 0.93,
p = 0.335. Viewing the interaction the other way, the effect
of uncertainty frame was not significant for either shift of
perspective, both ps ³ 0.183.
Undergraduates' intuitions that treatment would be more attractive in
the group perspective were consistent with the greater appeal of risky
monetary gambles in multiple-play situations, but these intuitions were
not borne out by the actual ranks of the no-flu-shot option (see Table
2). Interestingly, however, the interaction reported above was in the
same direction as that in the analysis of actual ranks. Although the
simple effects were somewhat different in the two analyses, the
no-flu-shot option fared particularly poorly (treatment fared
particularly well) when frequency information was combined with the
group perspective (or a shift to the group perspective).
4 Discussion
In this study, preferences for treatment options were very similar in
the individual and group perspectives. This result and those of other
studies (DeKay & Kim, 2005; DeKay et al., 2000; Hux et al., 1994;
Ritov & Baron, 1990; Spranca et al., 1991) conflict with Redelmeier
and Tversky's (1990) finding that treatment is more likely to be
preferred for individuals than for groups. Our data help to eliminate
differences in uncertainty frames and participant populations as
explanations for this discrepancy in the literature. More important,
all of these studies (including Redelemeier & Tversky, 1990) suggest
that the relatively robust distinction between single-play and
repeated-play monetary gambles does not extend to medical treatments
for individuals and groups.
One promising explanation for this result is that people are willing to
aggregate monetary outcomes over multiple plays (e.g., to think of five
gains of $200 and five losses of $100 as a net gain of $500), but
unwilling to aggregate outcomes of medical treatments over multiple
patients (e.g., to think of five patients each gaining 10 years of life
and five other patients each losing 2 years of life as a net gain of 40
years). For multiple-play gambles in which one person may win money on
some plays and lose money on others, it is reasonable (even normative)
to consider the distribution of aggregate outcomes (Benartzi & Thaler,
1999; Kahneman & Lovallo, 1993; Read, Loewenstein, & Rabin, 1999;
Redelmeier & Tversky, 1992). Risky positive-EV gambles are often more
appealing when possible outcomes are aggregated over multiple plays
prior to evaluation, perhaps because repetition reduces the probability
of losing money (sometimes to near zero). However, when medical
treatments for multiple patients are considered, aggregation may be
inappropriate because the gains and losses experienced by different
patients do not necessarily offset each other in any real sense (Asch,
1990; Asch & Hershey, 1995). This line of reasoning is normatively
controversial, and conflicts with standard practice for cost-benefit
and cost-effectiveness analyses in healthcare and other domains.
Nonetheless, if people are reluctant to aggregate possible outcomes
over patients prior to evaluating treatments, then the analogy between
monetary gambles and medical treatments breaks down, and treatments are
likely to be evaluated similarly in the individual and group
perspectives. In other words, people considering decisions for multiple
patients may make those decisions as if they were considering only one
patient.
Evidence for this explanation comes from two sources. First, Redelmeier
and Tversky's (1992) result for multiple treatments of one
patient paralleled results for repeated-play monetary gambles rather
than those for the treatment of multiple patients, suggesting that
participants were willing to aggregate medical outcomes experienced by
an individual. Second, DeKay and Kim (2005; DeKay, Kim, & Tuma, 2003)
reported that the perceived fungibility of outcomes over
multiple plays (i.e., the appropriateness of aggregating outcomes over
plays) was lower for risky medical treatments involving multiple
patients - including treatments based on Redelmeier and Tversky's (1990)
adverse-outcomes scenario - than for multiple plays of risky monetary
gambles involving a single person or firm. Barriers to aggregation also
affected the perceived fungibility of outcomes in nonmedical situations,
as when monetary outcomes would be experienced by different people,
when frequent-flier miles would be credited to (one person's) different
accounts, and when meal tickets could be used only on specific dates.
Moreover, the increased attractiveness of repeated plays relative to a
single play (the standard result for monetary gambles with outcomes
experienced by the same person) was lower in situations with less
fungible outcomes, even though probabilities and relative gains and
losses were equated across situations. Apparently, the
aggregate-then-evaluate sequence that is assumed to underlie choice
differences between single and multiple plays of gambles with fungible
outcomes (Benartzi & Thaler, 1999; DeKay & Kim, 2005; Keren, 1991;
Klos et al., 2005; Langer & Weber, 2001; Lopes, 1981, 1996; Nielsen,
1985; Redelmeier & Tversky, 1992; Ross, 1999; Samuelson, 1963;
Schoemaker & Hershey, 1996; Tversky & Bar-Hillel, 1983; Wedell &
Böckenholt, 1994) is blocked when outcomes are perceived as
nonfungible. With nonfungible outcomes, people appear to make the
decision for a single gamble (or for an individual patient) and apply
that decision directly to the series of gambles (or to the group of
patients). Thus, if most participants in this study were unwilling to
aggregate gains and losses over patients, one would expect little or no
difference between the individual and group perspectives.
At least two alternative models are also consistent with our results
that participants were loss averse or risk averse and that they made
similar treatment decisions in the individual and group perspectives.
In the first alternative model, participants in the group perspective
evaluate the decision for an individual patient as usual (e.g., in a
loss-averse or risk-averse manner) and then scale this evaluation
linearly to the group of patients. This linear aggregation over
patients leads to the same decision as simply applying the one-patient
decision to the group of patients without aggregation.
In the second alternative model, participants in the group perspective
evaluate each of the three possible outcomes (adverse reactions, flu,
and no flu) as usual (e.g., in a loss-averse or risk-averse manner) and
then scale these evaluations linearly to the number of patients likely
to experience those outcomes. This aggregation of evaluations is
conducted separately for the three types of outcomes. Finally, the
three aggregate evaluations are combined linearly into an overall
evaluation (i.e., with no additional loss aversion or risk aversion).
Because the numbers of patients expected to experience each outcome are
proportional to the probabilities for an individual patient, the final
evaluation is predicted to be the same in the group perspective as in
the individual perspective.
Although the two alternative models do allow aggregation, they are
similar to our nonfungible-outcomes account in that they avoid
aggregating dissimilar outcomes over patients. The primary evaluation
of gains and losses occurs prior to aggregation, in contrast to the
standard aggregate-then-evaluate model for the difference between
single-play and multiple-play monetary gambles. Both of the alternative
models assume that the aggregation of evaluations over patients is
linear. This assumption is normatively defensible because the utility
of a treatment effect on one person should not (to a first
approximation) depend on the number of other patients experiencing the
same effect. However, descriptive studies suggest that people often
have concave utility functions for lives saved (e.g., Baron 1997;
Fetherstonhaugh, Slovic, Johnson, & Friedrich, 1997), and the same
might be true for the health outcomes in this study. Moreover, Greene
and Baron's (2001) finding that people also exhibit declining marginal
utility for utility casts doubt on participants' linear aggregation of
prior evaluations in both alternative models. These aggregation
difficulties do not arise in our preferred account, because the
decision for an individual patient is simply applied to the group of
patients.
In addition to our primary result (the nonsignificant effect of
perspective), we observed a nearly significant interaction between
perspective and uncertainty frame, with a significant simple effect of
uncertainty frame in the group perspective only. Apparently, expressing
uncertainty in terms of frequencies rather than probabilities led
participants in the group condition to view treatment more favorably.
One possible explanation is that the use of frequencies facilitated
participants' recognition that for each flu-shot option, more patients
would be spared the flu than would experience adverse reactions (i.e.,
there would be a net increase in aggregate health, relative to the
no-flu-shot option).4 This realization may have seemed
more relevant to participants considering a decision for many patients
than to those considering a decision for only one patient, assuming
that at least some participants were willing to aggregate outcomes over
patients (i.e., that some participants did not follow one of
the models proposed above).
Although the distinction between the individual and group perspectives
was not significant for actual rankings, undergraduate participants
expressed the belief that treatment would be evaluated more favorably
for many patients than for one patient. It is not clear whether these
intuitions were simply off the mark (i.e., "folk theory" did not
match reality), or whether they represented underlying tendencies that
were too weak to compete with other considerations in the ranking task.
One possibility is that the two tasks (comparing many options in one
perspective vs. comparing one option in two perspectives) focused
participants' attention on different aspects of the situation, just as
different evaluation modes lead to preference reversals in other
contexts (e.g., Hsee, Loewenstein, Blount, & Bazerman, 1999; Tversky,
Sattath, & Slovic, 1988). In contrast to this difference for the main
effect of perspective, the nearly significant interactions between
perspective and uncertainty frame were somewhat similar in the two
tasks: treatment fared particularly well when frequency information was
coupled with decisions about many patients. Perhaps there was something
to the undergraduates' intuitions after all.
In summary, accumulating evidence indicates that the distinction between
single and multiple plays of risky monetary gambles does not extend to
risky medical treatments for individuals and groups, perhaps because
many people are reluctant to aggregate the results of medical
treatments over patients in the same way that they would compute net
gains or losses over monetary gambles. The intriguing intuitions of our
undergraduate participants and the nearly significant interactions
between perspective and uncertainty frame qualify this conclusion only
slightly. As a practical matter, researchers interested in
understanding discrepancies between clinical guidelines and the
treatment of individual patients may wish to consider alternative
explanations.
References
Asch, D. A. (1990). Choices for individual patients vs. groups [Letter].
New England Journal of Medicine, 323, 922-923.
Asch, D. A., & Hershey, J. C. (1995). Why some health policies don't
make sense at the bedside. Annals of Internal Medicine,
122, 846-850.
Baron, J. (1992). The effect of normative beliefs on anticipated
emotions. Journal of Personality and Social Psychology,
63, 320-330.
Baron, J. (1997). Confusion of relative and absolute risk in valuation.
Journal of Risk and Uncertainty, 14, 301-309.
Barron, G., & Erev, I. (2003). Small feedback-based decisions and their
limited correspondence to description-based decisions. Journal
of Behavioral Decision Making, 16, 215-233.
Benartzi, S., & Thaler, R. H. (1999). Risk
aversion or myopia? Choices in repeated gambles
and retirement investments. Management Science,
45, 364-381.
Budescu, D. V., & Bruderman, M. (1995). The relationship between the
illusion of control and the desirability bias. Journal of
Behavioral Decision Making, 8, 109-125.
Chen, Y. -J., & Corter, J. E. (2006). When mixed options are preferred
in multiple-trial decisions. Journal of Behavioral Decision
Making, 19, 17-42.
Cohen, J., Cohen, P., West, S. G., & Aiken, L. S. (2003).
Applied multiple regression/correlation analysis for the
behavioral sciences (3rd ed.). Matwah, NJ: Lawrence Erlbaum
Associates.
Cosmides, L., & Tooby, J. (1996). Are humans good intuitive
statisticians after all? Rethinking some conclusions from the
literature on judgment under uncertainty. Cognition,
58, 1-73.
DeKay, M. L., & Kim, T. G. (2005). When things don't add up: The role
of perceived fungibility in repeated-play decisions.
Psychological Science, 16, 667-672.
DeKay, M. L., Kim, T. G., & Tuma, N. C. (2003, November).
Perceived fungibility and repeated-play decisions. Poster
presented at the annual meeting of the Society for Judgment and
Decision Making, Vancouver, BC, Canada.
DeKay, M. L., Nickerson, C. A. E., Ubel, P. A., Hershey, J. C., Spranca,
M. D., & Asch, D. A. (2000). Further explorations of medical decisions
for individuals and groups. Medical Decision Making,
20, 39-44.
Fetherstonhaugh, D., Slovic, P., Johnson, S. M., & Friedrich, J.
(1997). Insensitivity to the value of human life: A study of
psychophysical numbing. Journal of Risk and Uncertainty,
14, 283-300.
Gigerenzer, G. (1991). How to make cognitive illusions disappear: Beyond
"heuristics and biases." European Review of Social
Psychology, 2, 83-115.
Gigerenzer, G. (1996a). On narrow norms and vague heuristics: A reply to
Kahneman and Tversky (1996). Psychological Review,
103, 592-596.
Gigerenzer, G. (1996b). The psychology of good judgment: Frequency
formats and simple algorithms. Medical Decision Making,
16, 273-280.
Gigerenzer, G., & Hoffrage, U. (1995). How to improve Bayesian
reasoning without instruction: Frequency formats. Psychological
Review, 102, 684-704.
Greene, J., & Baron, J. (2001). Intuitions about declining marginal
utility. Journal of Behavioral Decision Making, 14,
243-255.
Hsee, C. K., Loewenstein, G. F., Blount, S., & Bazerman, M. H. (1999).
Preference reversals between joint and separate evaluations of options:
A review and theoretical account. Psychological Review,
125, 576-590.
Hux, J. E., Levinton, C. M., & Naylor, C. D. (1994). Prescribing
propensity: Influence of life-expectancy gains and drug costs.
Journal of General Internal Medicine, 9, 195-201.
Joag, S. G., Mowen, J. C., & Gentry, J. W. (1990). Risk perception in a
simulated industrial purchasing task: The effects of single versus
multi-play decisions. Journal of Behavioral Decision Making,
3, 91-108.
Judd, C. M., & McClelland, G. H. (1989). Data analysis: A
model-comparison approach. New York: Harcourt Brace Jovanovich.
Kahneman, D., & Lovallo, D. (1993). Timid choices and bold forecasts: A
cognitive perspective on risk taking. Management Science,
39, 17-31.
Kahneman, D., & Tversky, A. (1996). On the reality of cognitive
illusions. Psychological Review, 103, 582-591.
Keren, G. (1991). Additional tests of utility theory in unique and
repeated gambles. Journal of Behavioral Decision Making,
4, 297-304.
Keren, G., & Wagenaar, W. A. (1987). Violation of expected utility
theory in unique and repeated gambles. Journal of Experimental
Psychology: Learning, Memory, and Cognition, 13, 387-391.
Koehler, J. J., Gibbs, B. J., & Hogarth, R. M. (1994). Shattering the
illusion of control: Multi-shot versus single-shot gambles.
Journal of Behavioral Decision Making, 7, 183-191.
Kosecoff, J., Kanouse, D. E., Rogers, W. H., McCloskey, L., Winslow, C.
M., & Brook, R. H. (1987). Effects of the National Institutes of
Health Consensus Development Program on physician practice.
Journal of the American Medical Association, 258,
2708-2713.
Klos, A., Weber, E. U., & Weber, M. (2005). Investment decisions and
time horizon: Risk perception and risk behavior in repeated gambles.
Management Science, 51, 1777-1790.
Langer, T., & Weber, M. (2001). Prospect theory, mental accounting, and
differences in aggregated and segregated evaluation of lottery
portfolios. Management Science, 47, 716-733.
Li, S. (2003). The role of expected value illustrated in decision-making
under risk: Single-play vs multiple-play. Journal of Risk
Research, 6, 113-124.
Lomas, J., Anderson, G. M., Domnick-Pierre, K., Vayda, E., Enkin, M. W.,
& Hannah, W. J. (1989). Do practice guidelines guide practice? The
effect of a consensus statement on the practice of physicians.
New England Journal of Medicine, 321, 1306-1311.
Lopes, L. L. (1981). Decision making in the short
run. Journal of Experimental Psychology: Human
Learning and Memory, 7, 377-385.
Lopes, L. L. (1996). When time is of the essence: Averaging, aspiration,
and the short run. Organizational Behavior and Human Decision
Processes, 65, 179-189.
Mellers, B., Hertwig, R., & Kahneman, D. (2001). Do frequency
representations eliminate conjunction effects: An exercise in
adversarial collaboration. Psychological Science, 12,
269-275.
Montgomery, H., & Adelbratt, T. (1982). Gambling decisions and
information about expected value. Organizational Behavior and
Human Performance, 29, 39-57.
Nielsen, L. T. (1985). Attractive compounds of unattractive investments
and gambles. Scandinavian Journal of Economics, 87,
463-473.
Read, D., Loewenstein, G., & Rabin, M. (1999). Choice bracketing,
Journal of Risk and Uncertainty 19, 171-197.
Redelmeier, D. A., & Tversky, A. (1990). Discrepancy between decisions
for individual patients and for groups. New England Journal of
Medicine, 322, 1162-1164.
Redelmeier, D. A., & Tversky, A. (1992). On the framing of multiple
prospects, Psychological Science, 3, 191-193.
Ritov, I., & Baron, J. (1990). Reluctance to vaccinate: Omission bias
and ambiguity. Journal of Behavioral Decision Making,
3, 263-277.
Ritov, I., & Baron, J. (1992). Status quo and omission biases.
Journal of Risk and Uncertainty, 5, 49-61.
Ross, S. A. (1999). Adding risks: Samuelson's fallacy of large numbers
revisited. Journal of Financial and Quantitative Analysis,
34, 323-339.
Sackett, D. L. (1989). Inference and decision at the bedside.
Journal of Clinical Epidemiology, 42, 309-316.
Samuelson, P. (1963). Risk and uncertainty: A fallacy of large numbers.
Scientia, 98, 108-113.
Samuelson, W., & Zeckhauser, R. (1988). Status quo bias in decision
making. Journal of Risk and Uncertainty, 1, 7-59.
Schoemaker, P. J. H., & Hershey, J. C. (1996). Maximizing your chance
of winning: The long and short of it revisited. Organizational
Behavior and Human Decision Processes, 65, 194-200.
Sorum, P. C., Shim, J., Chasseigne, G., Bonnin-Scaon, S., Cogneau, J.,
& Mullet, E. (2003). Why do primary care physicians in the United
States and France order prostate-specific antigen tests for
asymptomatic patients? Medical Decision Making, 23,
301-313.
Spranca, M., Minsk, E., & Baron, J. (1991). Omission and commission in
judgment and choice. Journal of Experimental Social
Psychology, 27, 76-105.
Timmermans, D. R. M., Sprij, A. J., & de Bel, C. E. (1996). The
discrepancy between daily practice and the policy of a
decision-analytic model: The management of fever of unknown origin.
Medical Decision Making, 16, 357-366.
Tversky, A., & Bar-Hillel, M. (1983). Risk: The
long and the short. Journal of Experimental
Psychology: Learning, Memory, and Cognition, 9,
713-717.
Tversky, A., & Kahneman, D. (1983). Extensional versus intuitive
reasoning: The conjunction fallacy in probability judgment.
Psychological Review, 90, 293-315.
Tversky, A., Sattath, S., & Slovic, P. (1988). Contingent weighting in
judgment and choice. Psychological Review, 95,
371-384.
Wedell, D. H., & Böckenholt, U. (1990). Moderation of preference
reversals in the long run. Journal of Experimental Psychology:
Human Perception and Performance, 16, 429-438.
Wedell, D. H., & Böckenholt, U. (1994). Contemplating single versus
multiple encounters of a risky prospect. American Journal of
Psychology, 107, 499-518.
Woo, B., Woo, B., Cook, E. F., Weisberg, M., & Goldman, L. (1985).
Screening procedures in the asymptomatic adult: Comparison of
physicians' recommendations, patients' desires, published guidelines,
and actual practice. Journal of the American Medical
Association, 254, 1480-1484.
Footnotes:
1We are grateful to Christine
Weeks for assistance with data collection and entry, and to
Jon Baron, Tehila Kogut, and two anonymous reviewers for
helpful comments on earlier versions of this article.
Preparation of this article was supported by National Science
Foundation grant SES-0218318 to the first author. During
the conduct of this research, Dr. Ubel was recipient of a
Presidential Early Career Award for Scientists and Engineers
(PECASE). Correspondence and reprint requests should be
addressed to: Michael L. DeKay, Department of Engineering and
Public Policy, Carnegie Mellon University, Pittsburgh, PA
15213-3890, E-Mail: dekay@andrew.cmu.edu.
2 Spranca et al.'s (1991) and Ritov and
Baron's (1990) studies of omission bias were not about risk per
se, as the action and inaction alternatives both involved risk.
In the study presented in the next section, actions were risker
than omissions, but this was not clearly the case in the
omission-bias studies. The studies are cited here because they
compared decisions affecting one patient with decisions
affecting many patients.
3 An
additional concern about the original (full-sample) ANOVA involved the
residuals. Because the distribution of no-flu-shot ranks was skewed,
the distribution of residuals was also skewed. We addressed this issue
in two ways. First, we re-ran the ANOVA after rank-transforming the
original data. Skew in the residuals dropped from -1.18 to -0.53.
Results were the same as before, except that the effect of uncertainty
frame was not significant, F(1, 160) = 1.85. p =
0.175. The simple effect of uncertainty frame remained significant in
the group perspective, F(1, 80) = 4.71, p = 0.033.
Second, we conducted logistic regressions to predict the percentage of
participants ranking the no-flu-shot option as worst (i.e., to assess
whether there were effects of perspective or other variables on the
percentage of participants choosing the "floor" for that option).
When participant population and its interactions were omitted, results
were the same as those for the original analysis, except that the
effect of uncertainty frame was not significant, OR = 1.30,
Wald c = 2.77, p = 0.274,
and the simple effect of uncertainty frame was not quite significant in
the group perspective, OR = 1.54, Wald
c = 3.75, p = 0.053. As
before, the distinction between the individual and group perspectives
appeared unimportant in these analyses.
4 In the frequency format, a net
improvement was essentially guaranteed because no uncertainty was
reported for the numbers of patients experiencing each outcome (see
Figure 1). In the probability frame, a net improvement may have
appeared less certain because participants themselves would have had to
aggregate outcomes over patients.
File translated from
TEX
by
TTH,
version 3.74.
On 16 Nov 2006, 10:20.