Judgment and Decision Making, vol. 1, no. 2, November 2006, pp. 118-133.

The influence of the ratio bias phenomenon on the elicitation of health states utilities

José-Luis Pinto-Prades1
University Pablo de Olavide
Sevilla, Spain

Jorge-Eduardo Martinez-Perez
University of Murcia
Murcia, Spain

José-María Abellán-Perpiñán
University of Murcia
Murcia, Spain

Abstract

This paper tests whether logically equivalent risk formats can lead to different health state utilities elicited by means of the traditional standard gamble (SG) method and a modified version of the method that we call "double lottery." We compare utilities for health states elicited when probabilities are framed in terms of frequencies with respect to 100 people in the population (i.e., X out of 100 who follow a medical treatment will die) with SG utilities elicited for frequencies with respect to 1,000 people in the population (i.e., Y out of 1,000 who follow a medical treatment will die). We found that people accepted a lower risk of death when success and failure probabilities were framed as frequencies type "Y deaths out of 1,000" rather than as frequencies type "X deaths out of 100" and hence the utilities for health outcomes were higher when the denominator was 1000 than when it was 100. This framing effect, known as Ratio Bias, may have important consequences in resource allocation decisions.

Keywords: framing effect, risk format, standard gamble, health state, dual-process theories.
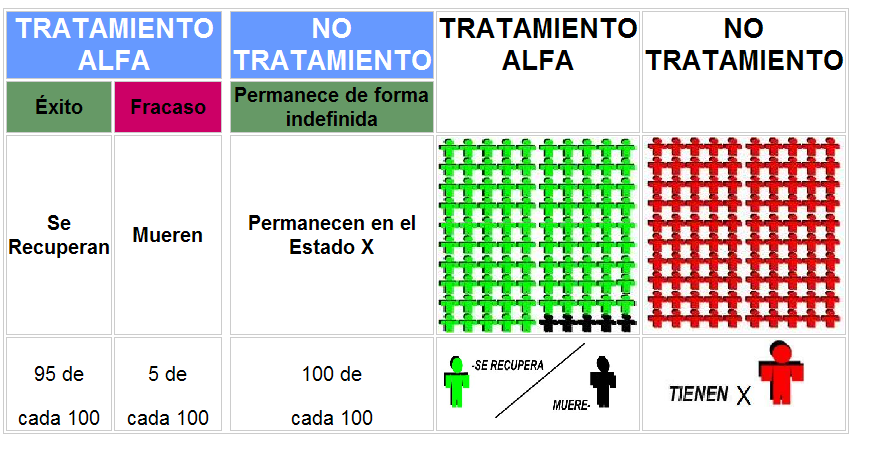
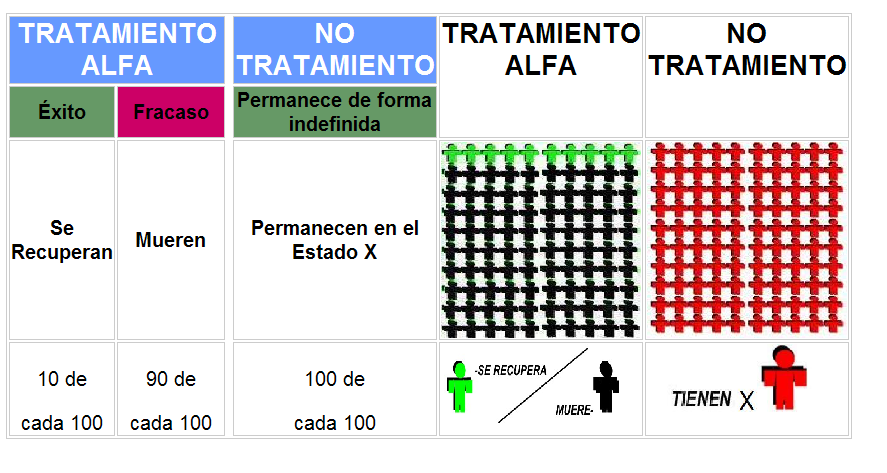

1  Introduction

"Framing" refers to the wording and/or other means of presenting logically equivalent information. A "framing effect" (Tversky & Kahneman, 1981) arises when alternative framing of logically equivalent information produces different decisions. Though the essence of that information may not change, people may respond differently depending on choice of words, context, or other aspects of communicating that information. According to Kahneman (2003) framing effects are discrepancies between choice problems that decision makers on reflection consider identical. Evidence to date suggests that framing effects are a common phenomenon affecting both hypothetical and real decisions made by patients and physicians (see Edwards et al., 2001, for a review).
One aspect of information that is often presented is risk - the probability of an event, such as a cure or side-effect resulting from treatment. In the case of risk information, empirical evidence suggests several types of framing effect. First, preference reversals may occur when equivalent risk information is presented in a negative or a positive frame (i.e., as a gain or a loss) (Eraker and Sox, 1981; O'Connor et al., 1985; O'Connor, 1989; Banks et al., 1995; Redelmeier et al., 1993; Llewellyn-Thomas et al., 1995; Gurm and Litaker, 2000; Amstrong et al., 2002). Second, quite different decisions over alternative treatments can emerge when the same information is presented as relative risk, absolute risk, or the number-needed-to treat (Forrow et al., 1992; Malenka et al., 1993; Bucher and Weinbacher, 1994; Hux et al., 1994; Sarfati et al., 1998; McGettigan et al., 1999). Third, numerically equivalent risk formats (e.g., frequency versus percentage) can lead to inconsistent preferences (Slovic et al., 2000, Schapira et al., 2004). Some research has indicated that frequency formats are more easily understood than probability formats (e.g., Bowling & Ebrahim, 2001; Gigerenzer & Hoffrage, 1995; Hoffrage & Gigerenzer, 1998; Hoffrage et al., 2000). However, some research has shown that some people are also subject to biases using frequency formats. The "ratio-bias phenomenon" (RBP) is a paradigmatic case (Denes-Raj & Epstein, 1994).
The RBP suggests that, when making a decision on the basis of the probability of an event, people tend to focus on the numerator, disregarding the denominator. For example, if they are offered the possibility of winning some amount of money by drawing a red ball from two trays one with 10 balls (1 red, 9 white) and another one with 100 balls (9 red, 91 white) they often prefer to draw the ball from the large tray, even if the chances of winning are objectively lower. This bias has not received much attention in medical decision making despite its potential relevance. For example, some (e.g., Barrat et al., 2005) describe the consequences of screening mammography in terms of number of cancers diagnosed in a group of 1000 women, while others (University of Michigan Health System, 2004) describe the outcomes in terms of events in a group of 10,000 women, and yet others as the number of cancers diagnosed in a population of 100,000 women (National Breast Cancer Coalition, 2002). The RBP suggests that the potential benefit of mammography screening will look different in these three cases even if the probabilities of events are the same.
The objective of this paper is to investigate whether, and how, the RBP may influence utility derivation. Specifically, to test if utilities elicited through the standard gamble (SG) or by means of a modified version we call "double lottery" method are susceptible to the RBP. This is important to determine, as the SG method is quite frequently used to elicit von-Neumann Morgenstern utilities for individual decision making and has been used to estimate population utilities in widely used instruments like the Health Utility Index (Torrance et al., 1995). The SG method for chronic health states usually asks people to choose between suffering a condition Q (worse than Full Health) for the rest of their lives (RL) and a medical treatment that if successful will return people to Full Health (FH) but if it fails will cause immediate death (D). The probabilities of failure (p) and success (1-p) are changed until indifference is reached. More schematically, we want to find "p" such that U(Q,RL) = U[p, D; (FH,RL)]. Following the scaling convention that U(D) = 0 and that U(FH, RL) = 1 we have that U(Q,RL) = 1-p. However, it is theoretically irrelevant that when presenting probabilities we use 100 (p100) or 1000 (p1000) in the denominator as long as the numerator is adjusted proportionally. The RBP suggests this cannot be the case.
The SG has been shown to be subject to biases like the certainty effect (Kahneman & Tversky, 1979). For this reason, some authors have argued that double lotteries are less subject to biases (McCord & de Neufville, 1986) and then have found empirical evidence supporting it as a better preference elicitation method (de Neufville & Delquié, 1988). In this method, we do not have a sure outcome. In our example, we compare two medical treatments, characterized by involving both a certain risk of death. Since there is risk in both decisions, the certainty effect is reduced. More schematically we want to find the probabilities "p" and "r" such that U[p, D; (Q, RL)] = U[r, D; (FH, RL)]. Following the same scaling convention as above, U(Q, RL)=(1-p)/(1-r). This method has been used to elicit the Value of a Statistical Life in the UK (Carthy et al., 1999) and also to elicit utilities for health states (Pinto and Abellán, 2005; Bleichrodt et al., forthcoming). For this reason, we ask whether the potential effect of the RBP would also extend to this method. We will see if the risk accepted by respondent changes when the probabilities used in both lotteries is presented using 100 or 1000 as the denominator. That is, in one group we will ask people to state "r" such that U[p100, D; (Q, RL)] = U[r, D; (FH, RL)] and in another group to state "r" such that U[p1000, D; (Q, RL)] = U[r, D; (FH, RL)].
Health state utilities can be used in individual decision making or in social decision making. In individual decision making, they are used as von Neumann-Morgenstern utilities in order to estimate the expected utility of a medical treatment and then to help people to choose between different treatments. However, these utilities are more frequently used to take resource allocation decisions. They are used to estimate the cost-effectiveness ratio of medical treatments. The effectiveness of a medical treatment is measured as the difference between the utility of patient health state before (UB) and after (UA) treatment. The benefit (B) of a medical treatment can then be estimated as the difference between the two health states (B=UA - UB). In order to compare the cost-effectiveness of two medical treatments, the ratio of these benefits is relevant since this shows how much more benefit one treatment provides and allow us to compare effectiveness ratio with cost ratio. For example, if the benefit of two medical treatments (X and Y) is Bx and By, and the ratio (Bx/By) is 2, this implies that treatment X will be more cost-effective than treatment Y if it is less than twice more costly. We then consider quite relevant to test if the RBP can influence these utilities and the corresponding measure of the relative benefit.
Although we are focusing on the influence of the RBP on the SG utilities our findings could, in principle, apply to other methods of eliciting utilities for health states, like the Person Trade-Off. In this method, as the utility (value) of the health state is the ratio between two groups of people and we use the size of one group as the stimulus, the RBP would suggest that the value could change by manipulating the size of the group. However, we will not address this issue in this paper (see Damschroder et al., 2004, for some evidence on this issue).
The paper is structured as follows. In section 2 we describe the RBP and offer a psychological explanation for it. In section 3 we hypothesize that SG utilities elicited when probabilities are framed in terms of frequencies with respect to 1000 people in the population will be higher than SG utilities elicited for frequencies with respect to 100 people in the population. This prediction is based on the joint effect of, at least, four motivations for the presence of the RBP phenomenon: small number effect, numerosity, saliency and the affect heuristic. Sections 4 and 5 describe the methods and results of two experiments designed to test the potential influence of the RBP in SG and double lottery. The paper closes with a discussion of the implications of the findings from this experiment.

1.1  Definition and explanation of the Ratio-Bias Phenomenon

Denes-Raj and Epstein (1994) showed that, when offered a chance to win $1 by drawing a red jelly bean from an tray, 61% of subjects chose to draw from a bowl containing a greater absolute number, but a smaller proportion, of read beans (9 out of 100) than from a bowl with fewer red beans but a better chance of winning (1 out of 10). When subjects were asked to justify their choice, they admitted that this choice went contrary to what a rational individual should do, but they felt they had a better chance when there were more red beans.
Other research has shown that this bias is not a mere curiosity of laboratory experiments with students. Slovic et al. (2000) showed that 40% of clinicians refused to discharge a mental patient when violence risk was communicated as "20 out of every 100 patients similar to Mr. Jones are estimated to commit an act of violence", but only 20% refused to discharge the patient when risk was explained as "2 out of every 10 patients similar to Mr. Jones are estimated to commit an act of violence." Yamagishi (1997a) found a clear inconsistency in risk judgements provided by lay people using frequency formats. In his experiment, subjects rated a disease that kills 1,286 people out of every 10,000 as more dangerous than one that kills 24.14 out of every 100. The RBP has also been produced using vignettes (Denes-Raj, Epstein & Cole, 1994).
The psychological theory that Kirkpatrick and Epstein (1992) and Denes-Raj and Epstein (1994) proposed to explain this bias is the so called Cognitive-experiential self-theory (CEST). This theory distinguishes between two partially independent information-processing systems, a rational system that operates according to some rules of logic and an experiential system that processes information automatically and more simply. The experiential system operates in an automatic, holistic manner. It represents events in the form of concrete exemplars and operates through heuristics. The essence of the two systems is that the experiential system is an automatic learning system and the rational system is a verbal reasoning system. CEST is a theory that falls within the so-called dual-process theories (Epstein, 1983, 2003; Kahneman & Frederick, 2002; Sloman, 1996; Hogarth, 2005) that have in common the notion of two systems or thinking styles. One system is more analytical and the other is more intuitive. The choice of a tray with an objective lower probability of success (or a larger probability of a loss) shows, according to Kirkpatrick and Epstein, Denes-Raj and Epstein, that it is the experiential system that is governing this decision.
However, even if the RBP can be explained ultimately applying to the influence of the experiential system the question is: can we provide more specific reasons that lead the experiential system to a) judge equivalent ratios differently, b) focus on the numerator of the ratio and not on the denominator, c) overweight the relevance of one of the events of the numerator? All these give rise finally to the RBP.
There are, at least, two potential explanations of the fact that people judge equivalent ratios differently:
  1. Numerosity heuristic: numerosity refers to the tendency to judge quantity or probability on the basis of the number of units into which a stimulus is divided without fully considering variables like the size of the units (Pelham et al., 1994). Pacini and Epstein (1999a) explain the RBP in terms of this heuristic. They claim that the experiential system encodes and better comprehends absolute numbers (numerosity) than ratios because single numbers are more concrete than relations between numbers. In our case, the tendency to concentrate on absolute numbers can lead people to overweight some of the events, like the number of deaths and to perceive as a higher a risk presented as 100 deaths out of 1000 than 10 out of 100.
  2. Small number bias: The small numbers effect asserts that the experiential system comprehends smaller numbers better than larger numbers. In this respect, a 1 in 10 probability conveys the idea of a low probability better than 10 in 100, because subjects find it easier to visualize 10 than 100 subjects. The smaller tray gives a better idea than the larger tray that a 10% chance is a low probability. For this reason, if the lottery is positive (win if red, nothing if white) people choose the larger tray and the opposite if the lottery is negative. Some evidence that probabilities expressed with low numbers are easier to interpret is provided in Pelham et al. (1994) where subjects expressed their preferences about participating in a lottery where all subjects are given one ticket or in another lottery where all subjects are given 10 tickets. People tend to choose the lottery where they are given 10 tickets if they are told that there are 1 million subjects but they show indifference between both lotteries when they are told that there are only 2 subjects. Apparently, with lower numbers they better realize that the chances are the same in both lotteries.
However, in order to explain the RBP we also need to explain: a) why people focus on the numerator and b) why people focus on one of the components of the numerator, in our case, the number of negative events.
  1. Motivational concern. According to Denes-Raj and Epstein (1994) people focus on the numerator because it is the object of motivational concern. For example, the red beans are of motivational concern since we want to select them (if the outcome is a gain) or avoid them (if the outcome is a loss). In our case, the numerator is the source of motivational concern because it is in the numerator where the outcomes of the medical treatment (success or failure) are shown.
  2. Anchoring, adjustment and base-rate neglect. Yamagishi (1997ab) suggests a combination of two cognitive mechanisms as an explanation to his result (a risk of 1,286 out of 10,000 is perceived as more dangerous than a risk of 24.14 out of 100): anchoring and adjustment (Tversky & Kahneman, 1974) and base-rate neglect (Kahneman & Tversky, 1973). Yamagishi argues that people use the numerator as an anchor to do subsequent judgment and, simultaneously, tend to reject the base rate.
The final question is, why people focus on one aspect of the numerator (e.g., number of red jelly beans, number of criminals that commit violent actions, number of people who die) and not in the other aspect (e.g., number of white jelly beans, number of criminals that do not commit violent actions, number of people who do not die)?
  1. Biased instructions: one argument provided in Pacini and Epstein (1999b) to explain the RBP is related to the fact that instructions were stated in terms of drawing a red jelly bean. There is evidence in the literature (e.g., Amstrong et al., 2002) that framing positively (probability of winning) or negatively (probability of losing) has a strong influence on the perceptions that subjects have of risk. For example, subjects are less willing to accept a risk if the framing is negative than if it is positive.
  2. Affect heuristic. Slovic et al. (2000) explain the results by Kirkpatrik and Epstein (1992) and Denes-Raj and Epstein (1994) as a manifestation of a mental strategy of "imaging the numerator" (the red beans) and "neglecting the denominator" (number of beans in the tray). According to Slovic et al., images of winning beans convey positive affect that motivates the choice of the bowl with the greater absolute number of red beans. Slovic et al. (2002) called this mechanism the affect heuristic. Applying this to their paper they say that 20 mental patients out of 100 conducting violent acts may evoke more images of harmful attacks than 2 out of 10.
  3. Saliency: another argument that Kirkpatrick and Epstein (1992) provide is that red jelly beans are more salient because there are fewer of them, standing out as figure against ground. In our case, if the risk of the bad event (e.g., death) is lower than 50% it becomes more salient. However, some of the other elements already quoted already contribute to making the less frequent event more salient. For example, biased instructions can lead people to concentrate on the less frequent event. Also, it could be argued that the less frequent event (death, winning something, etc., is the event that triggers a stronger affective reaction in many people. For this reason, it is difficult to know if the effect is simply due to being less frequent can be disentangled from the fact that some other elements make the less frequent event more salient. Then, it could be the case that saliency is not a factor of its own but just a consequence of some other elements that have been put forward previously. However, we prefer to leave it as an independent explanation of the RBP since the authors that originally observed this bias considered it to be an independent explanation.
In summary then, there are several reasons that can explain the RBP:
  1. Numerosity: people understand numbers more easily than ratios.
  2. Small numbers: people have a better idea of the likelihood of an event expressed in small numbers.
  3. Biased Instructions: asking people to think in the consequence of a certain kind of event (e.g., drawing a red ball).
  4. Neglect of the base: tendency to forget about the denominator.
  5. Affect heuristic: people respond by imaging the part of the numerator that is more salient.
  6. Saliency: people concentrate on the number of events that are less frequent.
As we have seen, all these reasons have an underlying explanation: all of them are congruent with the idea that the experiential system has a leading role in this kind of tasks. We now proceed to apply this theory to the case of preference elicitation in health.

1.2  Hypotheses and tests

1.2.1  Hypotheses

We can use the above explanations of the RBP in order to generate our hypotheses about the potential influence of this bias on SG utilities.
If we elicit SG utilities asking people the risk of death that they would accept in order to improve their health, then all reasons provided above will influence the response and utilities will be higher if frequencies are expressed as number (N) of deaths out 1000 (N1000) than number of deaths out of 100 (N100). The reason is that this type of question will make people focus on the number (N) of deaths and since this number is higher with 1000 as denominator, subjects will accept lower risks and they will produce higher utilities that when the denominator is 100. However, since we are interested in eliciting unbiased utilities, we try to avoid some of the reasons that give rise to the RBP. For this reason:
  1. We elicit utilities using a sequence of choices and not through direct matching. In this way, people do not have to focus on one single component of the numerator. That is, we want to find out probabilities P100 and P1000 such that the lotteries [D, P100; (FH, RL)] and [D, P1000; (FH, RL)] have the same utility as the sure outcome (Q, RL). If we ask people which value of N100 (N1000) makes both prospects equivalent we are making people focus only on one single number, namely, N100 (N1000). However, if we ask people to choose between (Q, RL) and the lottery and we keep moving the probabilities of both outcomes (of D and of FH) so that we finally reach indifference, we will reduce the chances that people concentrate only on N100 (N1000).
  2. We try to frame the decision in an otherwise neutral way. We do that providing information about both potential outcomes. That is, we provide information about N100 and (1- N100). The sequence of choices that we have described will present subjects with both pieces of information (quite frequently, SG utilities are elicited showing only the risk of death). In principle, this should reduce the chances that people concentrate on only one outcome (probability of death). In our case, the sequence of choices that we have described will present subjects with both pieces of information.
  3. We provide subjects with visual aids to help them think in terms of the total denominator so it is as clear as possible that the absolute number of good or bad events is related to the total number of potential events.
However, in spite of making every effort to provide information in the most unbiased way possible, the reasons behind the RBP cannot be totally eliminated. More specifically, it is hard to imagine how to avoid the influence of numerosity, the small-number effect and the affect heuristic. This leads us to propose two specific hypotheses:
  1. Existence of the RBP: Due to the effect of numerosity, small-numbers, saliency and the affect heuristic, SG utilities will be higher when the likelihood is framed in terms of X out 1000 people (USG1000) in the population than when it is framed in terms of X out of 100 people (USG100). This is because: (a) smaller numbers convey better the idea of small risk; (b) numerosity leads people to concentrate on absolute numbers and not ratios; (c) saliency leads people to concentrate on events that are less frequent (number of deaths), and (d) Affect will work more strongly when the absolute number of deaths is higher (although the probability is the same). For these reasons, we predict that people will accept a lower risk if frequencies are provided using 1000 in the denominator than if they are provided using 100 in the denominator, leading to higher SG utilities. Our prediction is that USG1000USG100.
  2. Intensity of the RBP: According to the saliency hypothesis, the influence of the RBP in SG utilities will be larger for milder health states than for more severe ones. This is because the difference in severity between a mild health state and death is much wider than between a more severe health state and death. For this reason people may be less motivated to avoid death in the case of more severe health states. There are two ways of interpreting the intensity of the RBP. One is to assume that the higher the effect the higher the difference USG1000-USG100. We would then expect this difference to be greater for milder health states. However, this test may run into problems since for the mild health state the difference between the utility of the health state and the utility of full health can be very small. For example, if U100=0.99 then the RBP would have "no room" to show up. So another possible way of testing the intensity of the RBP is through the ratio:
    1-U1000

    1-U100
    (1)
For example if U100=0.9 and U1000=0.99 we would consider that the RBP has a higher effect than if U100=0.5 and U1000=0.59. In any case, in order to study the relevance of the RBP for economic evaluation of health care technologies, (1) is the key ratio since it is the ratio of the benefits of medical treatments as has been explained above.
Table 1: Health states used in study 1.

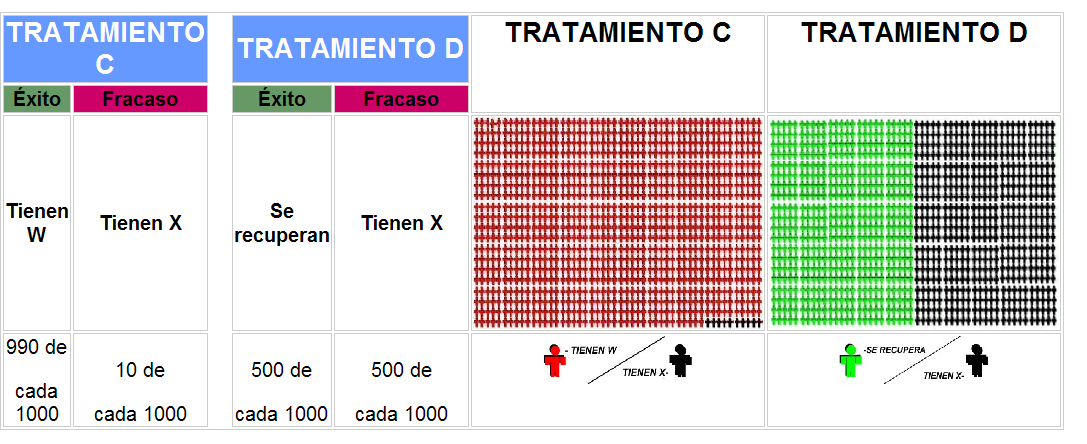
Health state X (22111):
Some problems walking about
Some problems with performing self care activities (e.g., eating, washing or dressing)
No problems with performing usual activities (e.g., work, study, housework, family or leisure activities)
No pain or discomfort
Not anxious or depressed
       Health state W (11222):
No problems walking about
No problems with performing self care activities (e.g., eating, washing or dressing)
Some problems with performing usual activities (e.g., work, study, housework, family or leisure activities)
Moderate pain or discomfort
Moderately anxious or depressed
Health state Z (22222):
Some problems walking about
Some problems with performing self care activities (e.g., eating, washing or dressing)
Some problems with performing usual activities (e.g., work, study, housework, family or leisure activities)
Moderate pain or discomfort
Moderately anxious or depressed
       Health state Y (23222):
Some problems walking about
Unable to wash or dress self
Some problems with performing usual activities (e.g., work, study, housework, family or leisure activities)
Moderate pain or discomfort
Moderately anxious or depressed
       

1.2.2  Tests

We split a convenience sample into two groups. We asked subjects in one group to set probabilities that yield indifference between the gamble [D, P100; (FH, RL)] and in the other for the gamble [D, P1000; (FH, RL)] and sure outcome (Q, RL). Overall, four SG questions were presented to each subject, one for each of the health states selected. In one group 100 was used as the denominator and in the other group 1000 was used.
fig1.png
Figure 1: Example of choice-based procedure (1)
fig2.png
Figure 2: Example of choice-based procedure (2)

2  First experiment

2.1  Method

2.1.1  Sample

The subjects were 200 economics students at the University of Murcia (Spain). They were paid 6 Euro for their participation. Responses were collected by face-to-face interview, with the questionnaire pilot-tested prior to the actual experiment.

2.1.2  Health states

We used the EQ-5D health states 22111, 11222, 22222, and 23222. These states are described in Table 1. Throughout the experiment, the health states were labeled health state X, W, Z and Y respectively.
Given the ordinal structure of the component dimensions in the EuroQol descriptive system, some states are logically ordered with respect to others. With the states used here, five such comparisons are possible. It would be expected that 22222 should be given a higher utility than 23222 because it is better on at least one dimension and no worse on any of the other dimensions. In the same way, this ordinal consistency would be expected for comparisons of 22111 vs 22222, 22111 vs 23222, 11222 vs 22222, and 11222 vs 23222. Only for comparison between 22111 and 11222 there is no a priori expectation of this kind.

2.1.3  Design

fig3.png
Figure 3: Reaching the indifference point between 10% and 20%
The experiment was run on a computer, which facilitated the use of visual aids and the choice-based SG procedure to elicit utilities. In addition, the pilot sessions showed that people found computer assisted personal interviews a user-friendly procedure. Subjects entered their responses directly into a computer with an interviewer (one of the co-authors was always present) nearby to answer questions and provide help if needed.
To avoid anchoring biases we split the total sample into two groups of 100 subjects each. One group answered four SG questions (one per health state) in which probabilities were framed in terms of frequencies with respect to 1000 people in the population, while the other group answered the same questions for probabilities framed as frequencies with respect to 100 people in the population. To avoid order effects, the computer randomly varied the order in which the different SG questions were asked. To minimize response errors, subjects had to confirm the elicited indifference value after each question. As a preliminary task, subjects were asked to rate the health states on a visual analogue scale (VAS), with 100 (best imaginable health state) and 0 (worst imaginable health state) as endpoints. The principal objective of the VAS was to familiarize subjects with the health state descriptions and also to have a test that both groups were similar.
Recruitment of subjects took place one week before the actual experiment started. At recruitment, subjects were handed a practice question. Subjects were asked to answer this practice question at home. This procedure was intended to familiarize subjects with the SG questions. Prior to the start of the experiment, subjects were asked to explain their answer to the practice question. When we were not convinced that a subject understood the task, we explained it again until we were convinced that he understood the task.
The formulation of SG questions was the same, regardless of the frequency format used. For example, in the case of health state X, the wording of the question (translated from the Spanish) was as follows:
Suppose that you are experiencing health state X. If you do not receive treatment you will remain in X for the rest of your life. However, you can receive a medical treatment (treatment ALFA), that if successful, will result in return to normal health. Nevertheless, treatment ALFA can also fail and in this case you will die. We are going to show you different probabilities of success and failure and you will tell us if you think you would choose treatment ALFA or no in each case.
The SG procedure was then applied to elicit utilities. Frequencies were displayed as pictographs using human figures, as frequency formats illustrated with human figures have been shown to be easy to interpret and convey a meaningful message (Schapira et al., 2001). Figures 1 and 2 illustrate the way indifferences were obtained. We used a ping-pong search procedure. We first presented the 5% risk of death, then 90%, 10%, 80%, 20%, 70%, 30%, 60%, 50%. The order was the same for both groups. In the case of the N100 group they were presented as (5 deads, 95 normal health), (90 deads, 10 normal health).... In the N1000 group they were presented as (50 deads, 950 normal health), (900 deads, 100 normal health)... In each case, these figures were illustrated using the pictograms already mentioned (see Figures 1 and 2).
As an example, suppose that for the 5% risk of death (5 dead, 95 normal health in the N100 group; 50 dead, 950 normal health in the N1000 group) displayed in Figure 1, the individual prefers treatment ALFA to no treatment. Next the computer would display a new choice (Figure 2), with a 90% risk of death (90 dead, 10 normal health in the N100 group; 900 dead, 1000 normal health in the N1000 group). Suppose that for these probabilities the individual prefers the sure outcome rather than treatment ALFA. Then the computer would present the 10% risk of death. If the subject prefers treatment ALFA, the computer would present the 80% risk of death. If the subject rejects treatment ALFA, the computer would present the 20% risk of death. Assume that the subject rejects treatment ALFA if risk is 20% (presented as 20 out of 100 or 200 out of 1000 in the corresponding sub-group). As she had accepted treatment with a 10% risk of death but she had rejected it with a 20% risk of death, the indifference point would be between 10% and 20%. Then the computer displayed a visual aid (see Figure 3) that showed the subject the interval where she should be indifferent between the gamble and the sure outcome. The subject had to write down the probabilities of death and full health in this interval that made her indifferent between the two options.

2.1.4  Data analysis and statistical methods

First, we performed a repeated-measures ANOVA in order to test our two specific hypotheses: (1) If utilities in the N1000 group are higher than in the N100 group, i.e., the RBP; and (2) if there is an interaction between health state severity and the size of the differences, i.e., intensity of the RPB when it is measured as the difference USG1000-USG100. Next, we used both parametric (t-test) and non-parametric (Wilcoxon Mann-Whitney test) procedures in order to test for the differences in utilities for each health state individually. Finally, we calculated ratio (1) as another way of testing the intensity of the RBP. In this case we could not use a statistical test since it is a ratio of the means.
Table 2: Means, medians, standard deviation (SD) elicited by the VAS (subsamples, N=100).

        Health state X Health state W Health state Z Health state Y
Group:         N100       N1000          N100       N1000          N100       N1000          N100       N1000
Median         60.00       60.00          60.00       50.00          30.00       30.00          15.00       12.50
Mean         57.32       61.10          56.23       53.75          30.56       30.15          16.62       16.51
(SD)         (1.66)       (1.57)          (1.49)       (1.47)          (0.95)       (1.17)          (0.82)       (0.94)
        

2.2  Results

Table 2 shows means, medians and standard deviations (SD) corresponding to the VAS for each sample.
Both samples gave similar values and no significant differences were detected (a=0.05) using the t-test and the Wilcoxon Mann-Whitney test. It was then concluded that both groups have similar preferences for health states. Also in both samples the rankings were internally consistent in the sense that state Y receives a lower value than state Z (p0.0001), and both Y and Z receive lower values than states X and W (p0.0001). This shows that subjects understood the basic task of valuing health states.
The hypothesis that SG utilities were the same in both groups was clearly rejected (repeated-measures-ANOVA: F=301.92, p0.00001). Table 3 shows that utilities were higher in group N1000 than in group N100 for all health states using both parametric (t-test) and non-parametric methods (Wilcoxon Mann-Whithney test). This was our prior expectation and confirms our hypothesis about the existence of the RBP.
Table 3: Utilities elicited by the SG (each group, N=100). SD=standard deviation.

Health state X**Health state W**Health state Z*Health state Y*
Group N100    N1000      N100    N1000      N100    N1000      N100    N1000
Median 0.850    0.945      0.800    0.908      0.600    0.700      0.375    0.500
Mean 0.790    0.902      0.796    0.880      0.575    0.673      0.393    0.481
(SD) (0.185)    (0.105)      (0.161)    (0.120)      (0.271)    (0.232)      (0.272)    (0.313)
U1000-U100 (from means) 0.112 0.084 0.098 0.088
(1-U1000)/(1-U100) 0.47   0.59   0.77   0.86  
* Significant different at a=0.05 using t-test and Wilcoxon Mann-Whitney test.
The interaction between health state severity and the effect size was not significant (repeated-measures-ANOVA: F=0.3, p0.827) showing that the intensity of the RBP was constant when measured as the difference USG1000-USG100. Table 3 shows that differences between U1000 and U100 are almost constant. However, the ratio of equation (1) is lower for milder health states. This implies that the RBP will distort more the utilities of mild health states than the utilities of severe health states, at least if they are used for economic evaluation of health care technologies. The second prediction, namely, a stronger effect for milder health states thus depends on the test that we apply.

3  The Ratio Bias Phenomenon and the double lottery method.

Once we had seen the influence of the RBP on the SG utilities we wanted to see if this phenomenon was also present in other contexts and in other populations more relevant for public policy. We then conducted a second study that differed from the first study as follows:
  1. Subjects were members of the general population.
  2. The tasks to be performed by subjects were the same that had been previously used in a study designed to estimate the value of a statistical life (VSL) from road accidents in Britain (Carthy et al., 1999).
  3. The tasks were a modified SG question characterized by the existence of risk in both parts of the question and that we call "double lottery."
Specifically, each subject answered two questions. Both questions involved asking people to estimate the probabilities that made one gamble indifferent to another gamble. The general structure of both questions was as follows. We used three outcomes that could be clearly ranked as the Best (Bst), the Worst (Wst) and the Intermediate (I). Assume gamble 1 is defined as providing a certain chance (p) of Wst and (1-p) of I. Gamble 2 is defined as providing a certain chance (q) of Wst and (1-q) of Bst. Obviously, if p=q gamble 2 dominates (is better) than gamble 1. In order to reach indifference q has to be larger than p. We fixed p and we asked for q (qp) so that subjects were indifferent between both gambles. One question was the same for all subjects. The other question manipulated the denominator for the risk that the subject was to match. In one group p was shown as 1 in 100 [and (1-p) as 99 in 100] and in the other group p was shown as 10 in 1000 [and (1-p) as 990 in 1000]. In order to test for the existence of the RBP only the second question was used. The first question was used as a control question and it allowed us to test that both groups had similar preferences for health. Its role was similar to the VAS question in the first study.

3.1  Method

3.1.1  The sample

We used two sub-groups (group A and group B) of the Spanish general population (n=180 each). They were chosen using a quota sample method. No statistically significant differences were found between both sub-samples in socio-demographic characteristics. Percentage of females was slightly higher than for males (51% and 49%, respectively). Mean age in both sub-samples was around 43. Population distributions according to educational status and income levels were roughly similar to actual distributions in Spain. All responses were collected by face-to-face interviews that were held at subjects home.

3.1.2  Health states

We used the same health states used by Carthy et al. (1999) in their study of the VSL. They are described in Table 4. One difference with our first study is that they did not involved chronic illnesses.
Table 4: Injury description cards.

Injury X:        Injury W:
In hospital.
  1. 2 weeks
  2. slight to moderate pain.
After hospital
  1. some pain/discomfort, gradually reducing.
  2. some restrictions to work and leisure activities, steadly improving.
  3. after 18 months, return to normal health with no permanent disability
       In hospital
  1. 2-3 days
  2. slight to moderate pain.
After hospital
  1. some pain/discomfort for several weeks.
  2. some restrictions to work and/or leisure activities for several weeks/months
  3. after 3-4 months, return to normal health with no permanent disability
       

3.1.3  Tasks

Subjects had to conduct two double lottery questions. Both tasks were quite similar. The main question that we used to test the existence of the RBP was framed as follows in the case of group A:
Assume that you have been injured in a road accident. If you do not receive medical treatment you will experience situation X. There are two alternative treatments available, C and D. When treatment C is applied to 100 people, 1 patient experience situation X and 99 patients experience situation W. When treatment B is applied to 100 people, N patients experience situation X and (100-N) patients return to normal health in 3-4 days.
In the case of group B it was framed as follows:
Assume that you have been injured in a road accident. If you do not receive medical treatment you will experience situation X. There are two alternative treatments available, C and D. When treatment C is applied to 1000 people, 10 patients experience situation X and 990 patients experience situation W. When treatment B is applied to 1000 people, N patients experience situation X and (1000-N) patients return to normal health in 3-4 days.
The number N [and, of course (100 or 1000 - N)] was changed until indifference was reached. In order to achieve indifference we used a ping-pong technique similar to the one used in study 1. Visual aids were also used in this second study (see Figure 4). Subject always saw, for each treatment, the number of people who experienced good and bad outcomes (both parts of the numerator) and the total number of patients (the denominator).
fig4.png
Figure 4: Example of visual aid used in second study for the case of 1000 in the denominator.
Health outcomes W and X were defined so that a logical ordinal ranking could be established between both (X W, see Table 4). We then have three outcomes (FH, W, X) that can be ranked from best (FH) to worst (X). The task can be represented as estimating [q, X; (1- q), FH] such that it produces the same utility level as [1%, X; 99%, W]. In one group (group A), the risk (1%) of X was framed in terms of 1 out 100. In group B, the same risk of X (1%) was framed in terms of 10 out 1000 (see Figure 4). So question 2 in group A was framed as the value of q that made gamble [q, X; (1- q), FH] indifferent to gamble [1 in 100, X; 99 in 100, W]. In group B, question 2 was framed as the value of q, that made gamble [q, X; (1- q), FH] indifferent to gamble [10 in 1000, X; 990 in 1000, W]. Obviously, in order to reach indifference q1%.
The other task was exactly the same in both groups (A and B). The objective of the task was to check to see that preferences for health states were similar in both groups, so that the potential differences in the main question between both groups could not be attributed to different preferences for health states between the groups. The question was framed as follows:
Assume that you have been injured in a road accident. If you do not receive medical treatment you will die. There are two alternative treatments available, A and B. When treatment A is applied to 1000 people, 1 patient dies and 999 patients experience situation X. When treatment B is applied to 1000 people, N patient die and (1000-N) return to normal health in 3-4 days.
Then N [and, of course, (1000-N)] were adjusted using a ping-pong technique until indifference was reached. Methods were the same as above. This task can be represented as estimating [r, Death; (1- r), FH] such that it produces the same utility level as [1 in 1000, Death; 999 in 1000, X]. Obviously, in order to reach indifference r 0.001.

3.1.4  Hypothesis

According to the RBP, as people concentrate on the absolute number of bad outcomes in the numerator, they will accept a lower risk q in group B (denominator 1000) than in group A (denominator 100). That is, assume that in group A, subjects are indifferent between treatments C and D when treatment D has a 10% risk of the worst outcome (X). Then they are indifferent between (1 in 100, X; 99 in 100, W) and (10 in 100, X; 90 in 100, FH). In group B, where the denominator is 1000, if the RBP played no role, we would expect to find a value of q of 10% (the same than in group A) but this time expressed as 100 in 1000 risk of X. That is, in the absence of the RBP we would find that subjects are indifferent between (10 in 1000, X; 990 in 1000, W) and (100 in 1000, X; 900 in 1000, FH) if they are indifferent between between (1 in 100, X; 99 in 100, W) and (10 in 100, X; 90 in 100, FH). However, the RBP predicts that subjects concentrate on one number, namely the number of bad outcomes, the absolute number of cases of X. For this reason, the RBP predicts that people will not multiply by as much as 10 times the absolute number of cases of X when the denominator increases 10 times. In conclusion, if group A subjects are indifferent between [1 in 100, X; 99 in 100, W] and [N100 in 100, X; (100-N100) in 100, FH] the RBP would predict that group B subjects will be indifferent between [10 in 1000, X; 990 in 1000, W] and [N1000 in 1000, X; (1000-N1000) in 1000, FH] for N1000(10xN100). In consequence, as noted above, the RBP predicts that subjects will accept a lower risk q in group B (denominator 1000) than in group A (denominator 100).
Although in this second case, we deal with risks and not with SG utilities, it is clear that, if we observe the effect of the RBP in our second case, this has implications for the use of double lotteries in the elicitation of SG utilities, since it has been suggested that double lotteries are a better elicitation method than the SG method as used in our first experiment (Pinto-Prades & Abellán-Perpiñán, 2005; Bleichrodt et al., forthcoming).

3.2  Results

Table 5 shows means and medians corresponding to both groups. In group A, the mean absolute number of cases with X (N100) was 37. In group B, the mean absolute number of cases with X (N1000) was 176. In group A, subjects were indifferent between [1 in 100, X; 99 in 100, W] and [37 in 100, X; 63 in 100, W]. In group B, subjects were indifferent between [10 in 1000, X; 990 in 1000, W] and [176 in 1000, X; 874 in 1000, FH]. As predicted by the RBP, N100010xN100 (17610x37). While subjects in group A accepted a risk of 37% in treatment D, subjects in group B accepted a risk of only 17.6% of X in treatment D. It can also be seen that in the case of the task that was common in both groups, the risk (r) was the same in both groups what supports the conclusion that the differences observed in the risk (q) can be attributed to the RBP and not to the fact that both groups were different in terms of preferences.
Table 5: Study 2: Means, medians, T-test and Mann-Whitney U-test by groups.

  Group A Group B
(lr)2-3(lr)4-5 Risk   Mean   Median      Mean   Median     T-test     U-test
r   15.2 out of 1000   5 out of 1000      14.8 out of 1000   5 out of 1000 0.911 0.120
q   37.1 out of 100   33.5 out of 100      176 out of 1000   95 out of 1000 0.000 0.000
  

4  Discussion

Our result provides new evidence on how "irrelevant" changes in the way we represent health risks can lead to inconsistent preferences. We find that utilities were significant higher when risk information was framed using 1,000 instead of 100 as denominator. It shows how superficially different frequency frames (e.g., X out of 100 vs Y out of 1,000) can distort SG measurements.
How relevant is this bias for practical decision making? Well, let's assume we use 1000 as the denominator when considering the benefit of curing somebody in health state Y, which is more than 5 times the benefit of curing somebody in X [(1-0.481)/(1-0.902)=5.27]. However, this relative benefit almost halves [(1-0.393)/(1-0.790)=2.89] if we use 100 as the denominator. Since there is no reason to prefer frequencies in 100 or in 1000, there is no reason to necessarily choose one framing over the other. Of course, if one wishes to deliberately increase the apparent relative benefit of Y respect to X, one can use 1000 as the denominator for Y and 100 as the denominator for X. This increases the relative benefit of Y to more than six times the benefit of X.
Having seen the potential implications of this bias, what can we do in order to avoid it? This depends on the perspective taken about the origins of the RBP. The RBP observed in SG values can be explained by the dual-process theory, such that SG is handled more by the experiential than the rational system. This system works using heuristics that, although they can do a good job in some decisions, may lead to irrationalities, like choosing a dominated lottery. In the case of preference elicitation for health states, the experiential system leads people to focus on just one component of the likelihood of one event. This is logically irrational. However, we do not imply that the rational system is totally absent in the elicitation task. For example, the rational system may work trying to avoid irrational responses, like accepting a higher risk of death for a health state that is less severe than another. This leads to utilities that are internally consistent. For this reason, we can see at the same time consistent (e.g., higher utilities for milder health states) but biased responses. This is similar to the idea behind the principle of coherent arbitrariness (Ariely et al., 2003), that apparently rational decisions can be based on arbitrary "anchors". This result of consistent but biased responses is not exclusive of our study. For example, Lenert et al. (1998) find rational responses, in the sense of very high test-retest correlations but quite different for two different search procedures, namely, titatrion vs ping-pong. We then suggest that some other framing or procedural effects observed in the literature may have a similar explanation to the RBP that we have observed in this paper.
If we accept that the above account of the origin of the RBP bias is correct, how can we deal with it? First, there are arguments that the SG method is intrinsically biased and that "gambles are thus incapable of yielding consistent utility estimates across different probabilities" (Baron, 1997). The results of our study would then be considered a further argument not to use the SG as a preference elicitation method. This conclusion would extend to the double lottery method. Another approach, in the spirit of Bleichrodt et al. (2001) is to accept that the method is biased but that the "irrational" SG utilities can be corrected. Some authors have shown that the SG method is affected by loss aversion and probability weighting (Bleichrodt, 2001, 2002). Since we have a good understanding of these biases there are quantitative corrections to these biases (Bleichrodt et al., 2001; van Osch et al., 2004; Bleichrodt et al., forthcoming). For example, it has been suggested that utilities should be estimated under Prospect Theory and not under Expected Utility. In this way, the bias coming from probability transformation can be avoided. This approach assumes that the rational system wants to adhere to expected utility and then corrects the experiential system in order to choose according to a rational rule. While in the case of some biases affecting SG (loss aversion, probability transformation) this could be the case, we cannot see how this correction can be applied to the RBP, since EU has nothing to do with the choice of the denominator.
Slovic et al. (2000) suggest a pragmatic strategy. They suggest using several formats in order to communicate risk. Subjects should then try to resolve their inconsistencies. Translating this to our case, we need to provide information using several denominators. Of course, this complicates the task of eliciting utilities. In order to avoid this complication we may try to confirm the hypothesis that people understand small numbers more than large numbers as some people has suggested (see section 1.1). If this is the case we would undertake the elicitation task using small numbers, as far as possible. For example, instead of asking subjects if they would accept a risk of death of X out of 100, it would be better to use X out of 10. If people say that they would accept 1 out of 10 but not 2 out of 10, we know that the indifference point is between 10% and 20%. We can the use larger numbers (X in 100, whereas 10X20 in our example) if we need a more accurate estimate. This approach reflects the Bleichrodt et al. (2001) approach in the sense that it assumes there is a denominator that is normatively better than others; the smaller one. It could also be that this is a useful short term solution, and in the longer term it might be interesting explore ways to "educate" the experiential system so that these biases can be reduced or eliminated. The results of Hsee and Rottenstreich (2004, study 1) show that this strategy is possible. For this, it would be quite helpful to categorize subjects according to how they handle conflicts between the experiential and the rational system. It has been shown (Epstein et al., 1996; Pacini & Epstein, 1999 a,b; Frederick, 2005), Amsel et al. (2006)] that some subjects are more prone to intuitive thinking and biased judgements than others. If this was the case, it would have important implications for individual and social decision making. In individual decision making, those subjects who are more susceptible to biases could be made aware of this problem in order that avoid taking biased decisions. In social decision making, it should be discussed if preferences of these subjects should or should not be taken into account in order to design social policy.
Finally, this article has some limitations that could be object of future research. One is that the RBP was seen with a single visual representation method and the results may not generalize to other methods of display. It would then be interesting to see if our result also holds for other displays. For example, saliency and/or affect may be reduced if no visual aids are given, that is, if only numbers were presented. We think that the used of visual aids has been advocated in order to help people understand probabilities but may be it also has some drawbacks, like people concentrating too much in some pictures. However, this study is essentially a replication of other studies using different methods and getting similar results, which suggests that it could be a consistent effect.
In conclusion, researchers working in utility measurement should be aware of the existence of the ratio bias (RBP) since it may have relevant consequences for individual and social decision making. We also believe that the RBP can be quite useful in understanding better the origin of other biases, since it may help to study the way that the rational and the experiential system work when subjects respond to preference elicitation tasks.

References

Amsel, E., Close, J., Sadler, E., & Klaczynski, P. (2006). Awareness and irrationality: College students' awareness of their irrational judgments on gambling tasks. Manuscript.
Ariely, D., Loewenstein, G. & Prelec, D. (2003). Coherent Arbitrariness: Stable Demand Curves without Stable Preferences. Quarterly Journal of Economics,118, 73-105
Armstrong, K., Schwartz, J. S., Fitzgerald, G., Putt, M. & Ubel, P. (2002). Effect of framing as gain versus loss on understanding and hypothetical treatment choices: survival and mortality curves. Medical Decision Making, 22, 76-83.
Banks, S. M., Salovey, P., Greener, S., Rothman, A. J., Moyer, A., Beauvais, J. & Epel, E. (1995). The effects of message framing on mammography utilization. Health Psychology, 14, 178-184.
Baron, J. (1997). Biases in the quantitative measurement of values for public decisions. Psychological Bulletin, 122, 72-88.
Barratt, A., Howard, K., Irwig, L., Salkeld, G. &, Houssami, N. (2005). Model of outcomes of screening mammography: information to support informed choices. British Medical Journal, 330, 936-938.
Bleichrodt, H. (2001). Probability weighting in choice under risk: an empirical test. Journal of Risk and Uncertainty, 23, 185-198.
Bleichrodt, H. (2002). A New Explanation for the Difference Between Standard Gamble and Time Trade-Off Utilities. Health Economics, 11, 447-456.
Bleichrodt, H., Pinto, J. L. & Wakker, P. (2001). Making Descriptive Use of Prospect Theory to Improve the Prescriptive applications of Expected Utility. Management Science, 47, 1498-1514
Bleichrodt, H., Abellan-Perpiñan, J. M., Pinto, J. L. & Mendez-Martinez, I. (Forthcoming). Resolving inconsistencies in utility measurement under risk: tests of generalizations of expected utility. Management Science.
Bowling, A. &, Ebrahim, S. (2001). Measuring patients' preferences for treatment and perceptions of risk. Quality in Health Care, 10, 2-8.
Bucher, H. C., Weinbacher, M. & Gyr, K. (1994). Influence of method of reporting study results on decision of physicians to prescribe drugs to lower cholesterol concentration, British Medical Journal, 309, 761-764.
Carthy, T., Chilton, S., Covey, J., Hopkins, L., Jones-Lee, M., Loomes, G., Pigdeon, N. & Spencer, A. (1999). On the contingent valuation of safety and the safety of contingent valuation: part 2- The CV/SG "chained" approach. Journal of Risk and Uncertainty ,17, 187-213.
Damschroder, L. J., Baron, J., Hershey, J. C., Asch, D. A., Jepson, C. &Ubel, P. A. (2004). The validity of person tradeoff measurements: randomized trial of computer elicitation versus face-to-face interview. Medical Decision Making. 24,:170-180.
Denes-Raj, V. & Epstein, S. (1994). Conflict between intuitive and rational processing: When people behave against their better judment. Journal of Personality and Social Psychology, 66, 819-829.
Denes-Raj, V., Epstein, S., & Cole, J. (1994). The generality of the ratio-bias phenomenon. Personality and Social Psychology Bulletin, 10, 1083-1092.
de Neufville, R. & Delquié, P. (1988). A model of the influence of certainty and probability effects on the measurement of utility. B. Munier ed. Risk, Decision and Rationality, pp. 189-205 D. Reidel, Dordrecht, The Netherlands.
Edwards A. G. K, Elwyn, G., Covey, J., Mathews, E., Pill, R. (2001). Presenting risk information: a review of the effects of `framing' and other manipulations on patient outcomes. Journal of Health Community, 6, 61-82.
Epstein, S. (1983). The unconscious, the preconscious and the self-concept. In Suls,J. & Greenwald,S. (Eds.), Psychological perspectives on the self, Vol. 2, pp. 219-247. Hillsdale, NJ: Erlbaum.
Epstein, S. (2003). "Cognitive-experiential self-theory." In Millon,T & Lerner, M. J. (Eds.), Comprehensive handbook of psychology, Vol. 5, : Personality and Social Psychology, pp. 159-184. Hoboken, NJ: John Wiley & Sons, Inc.
Epstein, S., Pacini, R., Denes-Raj, V., & Heier, H. (1996). Individual differences in intuitive-experiential and analytical-rational thinking styles. Journal of Personality and Social Psychology, 71, 390-405.
Eraker, S. A., Sox, H. C. (1981). Assessment of patients' preferences for therapeutic outcomes. Medical Decision Making, 1, 29-39.
Forrow, L., Taylor, W. C. &, Arnold, R. M. (1992). Absolutely relative: how research results are summarized can affect treatment decisions. The American Journal of Medicine, 92,121-124.
Frederick, S. (2005). Cognitive reflection and decision making, Journal of Economic Perspectives, 19, 25-42.
Gigerenzer, G. & Hoffrage, U. (1995). How to improve Bayesian reasoning without instruction: Frequency formats. Psychology Review, 102, 4-704.
Gurm, H. S. & Litaker, D. G.(2000). Framing procedural risks to patients: is 99% safe the same as a risk of 1 in 100?. Academic Medicine, 75, 840-842.
Hoffrage, U., & Gigerenzer, G. (1998). Using natural frequencies to improve diagnostic inferences. Academic Medicine ; 73, 538-540.
Hoffrage, U., Lindsey, S., Hertwig, R. & Gigerenzer, G. (2000). Communicating statistical information. Science, 290, 2261-2262.
Hogarth, R. (2005). Deciding analytically or trusting your intuition? The advantages and disadvantages of analytic and intuitive thought. In Haberstroh, S. & Betsch, T. (Eds.), The Routines of Decision Making, pp. 67-82. Mahwah, NJ: Lawrence Erlbaum Associates.
Hsee C. & Rottenstreich Y. (2004). Music, pandas and muggers: on the affective psychology of value. Journal of Experimental Psychology: General, 133, 23-30.
Hux, J. E., Levinton, C. M. & Naylor, C. D. (1994). Prescribing propensity: influence of life-expectancy gains and drug costs. Journal of General and Internal Medicine, 9, 195-201.
Kahneman, D. & Tversky, A. (1973). On the psychology of prediction. Psychology Review, 80, 237-251.
Kahneman, D. & Tversky, A. (1979). Prospect theory: An analysis of decision under risk. Econometrica, 47, 263-291.
Kahneman, D., & Frederick, S. (2002). Representativeness revisited: Attribute substitution in intuitive judgment. In T. Gilovich, D. Griffin & D. Kahneman (Eds.) Heuristics and Biases: The Psychology of Intuitive Judgment, pp. 49-82. New York: Cambridge University Press..
Kahneman, D. (2003) A perspective on judgement and choice, American Psychologyst, 58, 697-720.
Kirkpatrick, L. A. & Epstein, S. (1992). Cognitive-experiential self-theory and subjective probability: further evidence for two conceptual systems. Journal of Personality and Social Psychology, 63, 534-544.
Lenert, L. A., Cher, D. L., Goldstein, M. K., Bergen, M. R., & Garber, A. (1998). The effect of search procedures on utility elicitations. Medical Decision Making;18, 76-83
Llewellyn-Thomas, H. A., McGreal, J. & Thiel, E. C. (1995). Cancer patients' decisión making and trial-entry preferences: the effects of "framing" information about short-term toxicity and long-term survival. Medical Decision Making, 15, 4-12.
Malenka D. J., Baron, J. A., Johansen, S., Wahrenberger, J. W. & Ross, J. M.(1993). The framing effect of relative and absolute risk. Journal of General and Internal Medicine, 8, 543-548.
McCord, M. & de Neufville, R. (1986). Lottery equivalents: Reduction of the certainty effect in utility assessment. Management Science,32, 56-60.
McGettigan, P., Sly, K., O'Connell, D., Hill, S. & Henry, D. (1999). The effects of information framing on the practices of physicians. Journal of General and Internal Medicine, 14, 633-642.
National Breast Cancer Coalition (NBCC). (2002). The Mammography Screening Controversy: Questions and Answers. Retrieved March 10, 2006 from http://www.natlbcc.org/bin/index.asp ?strid=498\&depid=9\&btnid=2.
O'Connor, A.(1989), Effects of framing and level of probability on patients' preferences for cancer chemotherapy. Journal of Clinical Epidemiology, 42,119-126.
O'Connor, A. M., Boyd, N. F., Tritchler, D. L., Kriukov, Y., Sutherland, H. & Till, J. E. (1985). Eliciting preferences for alternative cancer drug treatments. The influence of framing, medium, and rater variables. Medical Decision Making, 5, 453-63.
Pacini, R., & Epstein, S. (1999a). The interaction of three facets of concrete thinking in a game of chance. Thinking and Reasoning, 5, 303-325.
Pacini, R., & Epstein, S. (1999b). The relation of rational and experiential information processing styles to personality, basic beliefs, and the ratio-bias phenomenon. Journal of Personality and Social Psychology, 76, 972-987.
Pelham, B. W., Sumarta, T. T., & Myaskovsky, L. (1994). The easy path from many to much: The numerosity heuristic. Cognitive Psychology, 26, 103-133.
Pinto-Prades, J. L., Abellán-Perpiñán, J. M. (2005). Measuring the health of populations: the veil of ignorance approach. Health Economics, 14, 69-82.
Redelmeier, D. A., Rozin, P., & Kahneman, D. (1993). Understanding patients' decisions: cognitive and emotional perspectives. Journal of the American Medical Association, 270, 72-76.
Sarfati, D., Howden-Chapman, P., & Woodward, S. C. (1998). Does the frame affect the picture? A study into how attitudes to screening for cancer are affected by the way benefit are expressed. Journal of Medical Screening, 5, 137-140.
Schapira M. M., Nattinger, A. B., & McHorney, C. A. (2001). Frequency or probability? A qualitative study of risk communication formats used in health care. Medical Decision Making, 21, 459-467.
Schapira, M. M., Davids, S. L., McAuliffe, T. L., & Nattinger, A. B. (2004). Agreement between scales in the measurement of breast cancer risk perceptions. Risk Analysis, 24, 665-673.
Sloman, S. A. (1996). The Empirical Case for Two Systems of Reasoning. Psychological Bulletin, 119, 3-22
Slovic, P., Finucane, M. L., Peters, E., & MacGregor, D. G. (2002). The affect heuristic. In Gilovich, T., Griffin, D., & Kahneman, D. (Eds.). Heuristic and biases: The Psychology of Intuitive Judgement, pp. 397-420. New York: Cambridge University Press.
Slovic, P., Monahan, J., & MacGregor, D. G. (2000). Violence risk assessment and risk communication: the effects of using actual cases, providing instructions and employing probability versus frequency formats. Law and Human Behavior, 24, 271-296.
Torrance, G. W., Furlong, W., Feeny, D., & Boyle, M. (1995). Multi-attribute preference functions:Health Utilities Index. Pharmacoeconomics, 7, 503-520.
Tversky, A., & Kahneman, D. (1974). Judgement under uncertainty: heuristics and biases. Science, 185, 453-458.
Tversky, A., & Kahneman, D. (1981). The framing of decisions and the psychology of choice. Science, 211, 453-458.
Van Osch, S., Wakker, P. P., van den Hout, W. B., & Stiggelbout, A. M. (2004). Correcting biases in standard gamble and time tradeoff utilities. Medical Decision Making, 24, 511-517.
University of Michigan Health System (UMHS) (2004). Adult preventive health care: cancer screening. Ann Arbor (MI): University of Michigan Health System. Retrieved March 10, 2006 from http://cme.med.umich.edu/pdf/ guideline/cancerscreening04.pdf
Yamagishi, K. (1997a). When a 12.86% mortality is more dangerous than 24.14%: implications for risk communication. Applied Cognitive Psychology, 11, 495-506.
Yamagishi, K. (1997b). Upward versus downward anchoring in frequency judgements of social facts. Japanese Psychological Research, 2, 124-129.

Footnotes:

1 This study was funded by Ministerio de Educación y Ciencia, grant SEJ2004-05079/ECO. We would like to thank Jon Baron, Han Bleichrodt, Seymour Epstein, Robin Hogarth, Graham Loomes, Richard Smith, Kimihiko Yamagishi and two anonymous reviewers for their helpful comments. The usual disclaimer applies. José Pinto is in the Department of Economics, University Pablo de Olavide, Sevilla, Spain


File translated from TEX by TTH, version 3.74.
On 16 Nov 2006, 10:12.